

Disruption of NREM sleep and sleep-related spatial memory consolidation in mice lacking adult hippocampal neurogenesis
- PMID: 33020501
- PMCID: PMC7536189
- DOI: 10.1038/s41598-020-72362-3
Disruption of NREM sleep and sleep-related spatial memory consolidation in mice lacking adult hippocampal neurogenesis
Abstract
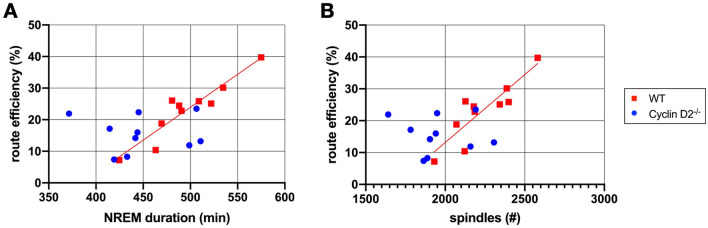
Cellular plasticity at the structural level and sleep at the behavioural level are both essential for memory formation. The link between the two is not well understood. A functional connection between adult neurogenesis and hippocampus-dependent memory consolidation during NREM sleep has been hypothesized but not experimentally shown. Here, we present evidence that during a three-day learning session in the Morris water maze task a genetic knockout model of adult neurogenesis (Cyclin D2-/-) showed changes in sleep macro- and microstructure. Sleep EEG analyses revealed a lower total sleep time and NREM fraction in Cyclin D2-/- mice as well as an impairment of sleep specific neuronal oscillations that are associated with memory consolidation. Better performance in the memory task was associated with specific sleep parameters in wild-type, but not in Cyclin D2-/- mice. In wild-type animals the number of proliferating cells correlated with the amount of NREM sleep. The lack of adult neurogenesis led to changes in sleep architecture and oscillations that represent the dialog between hippocampus and neocortex during sleep. We suggest that adult neurogenesis-as a key event of hippocampal plasticity-might play an important role for sleep-dependent memory consolidation and modulates learning-induced changes of sleep macro- and microstructure.
Conflict of interest statement
The authors declare no competing interests.
Figures


Similar articles
-
Monosynaptic Hippocampal-Prefrontal Projections Contribute to Spatial Memory Consolidation in Mice.J Neurosci. 2019 Aug 28;39(35):6978-6991. doi: 10.1523/JNEUROSCI.2158-18.2019. Epub 2019 Jul 8. J Neurosci. 2019. PMID: 31285301 Free PMC article.
-
Abnormal Locus Coeruleus Sleep Activity Alters Sleep Signatures of Memory Consolidation and Impairs Place Cell Stability and Spatial Memory.Curr Biol. 2018 Nov 19;28(22):3599-3609.e4. doi: 10.1016/j.cub.2018.09.054. Epub 2018 Nov 1. Curr Biol. 2018. PMID: 30393040 Free PMC article.
-
Hippocampal slow EEG frequencies during NREM sleep are involved in spatial memory consolidation in humans.Hippocampus. 2014 Oct;24(10):1157-68. doi: 10.1002/hipo.22299. Epub 2014 May 13. Hippocampus. 2014. PMID: 24796545
-
Sleep-A brain-state serving systems memory consolidation.Neuron. 2023 Apr 5;111(7):1050-1075. doi: 10.1016/j.neuron.2023.03.005. Neuron. 2023. PMID: 37023710 Review.
-
New neurons in the adult brain: the role of sleep and consequences of sleep loss.Sleep Med Rev. 2009 Jun;13(3):187-94. doi: 10.1016/j.smrv.2008.07.004. Epub 2008 Oct 9. Sleep Med Rev. 2009. PMID: 18848476 Free PMC article. Review.
Cited by
-
Adult-born neurons add flexibility to hippocampal memories.Front Neurosci. 2023 Feb 15;17:1128623. doi: 10.3389/fnins.2023.1128623. eCollection 2023. Front Neurosci. 2023. PMID: 36875670 Free PMC article. Review.
-
Implication of Hippocampal Neurogenesis in Autism Spectrum Disorder: Pathogenesis and Therapeutic Implications.Curr Neuropharmacol. 2023;21(11):2266-2282. doi: 10.2174/1570159X21666221220155455. Curr Neuropharmacol. 2023. PMID: 36545727 Free PMC article. Review.
-
Balancing Prediction and Surprise: A Role for Active Sleep at the Dawn of Consciousness?Front Syst Neurosci. 2021 Nov 5;15:768762. doi: 10.3389/fnsys.2021.768762. eCollection 2021. Front Syst Neurosci. 2021. PMID: 34803618 Free PMC article.
-
Sleep Identification Enabled by Supervised Training Algorithms (SIESTA): An Open-Source Platform for Automatic Sleep Staging of Rodent Electrocorticographic and Electromyographic Data.J Biol Rhythms. 2025 Aug;40(4):330-346. doi: 10.1177/07487304251336649. Epub 2025 Jun 6. J Biol Rhythms. 2025. PMID: 40476387 Free PMC article.
-
Adult neurogenesis and aging mechanisms: a collection of insights.Sci Rep. 2023 Oct 23;13(1):18104. doi: 10.1038/s41598-023-45452-1. Sci Rep. 2023. PMID: 37872391 Free PMC article.
References
Publication types
MeSH terms
Substances
LinkOut - more resources
Full Text Sources
Molecular Biology Databases
