. 2020 Oct 5;10(1):16444.
doi: 10.1038/s41598-020-73319-2.

Three-dimensional optoacoustic imaging of nailfold capillaries in systemic sclerosis and its potential for disease differentiation using deep learning

Affiliations

Three-dimensional optoacoustic imaging of nailfold capillaries in systemic sclerosis and its potential for disease differentiation using deep learning

Suhanyaa Nitkunanantharajah et al. Sci Rep. .

Abstract

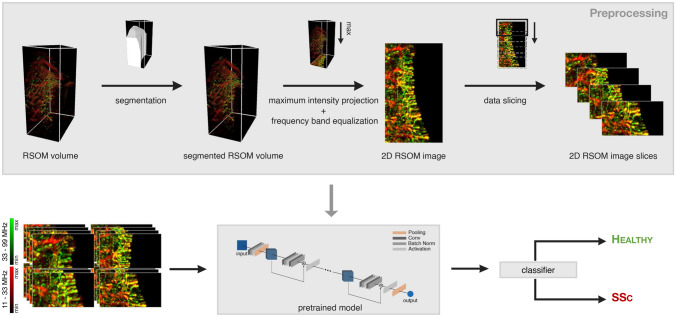
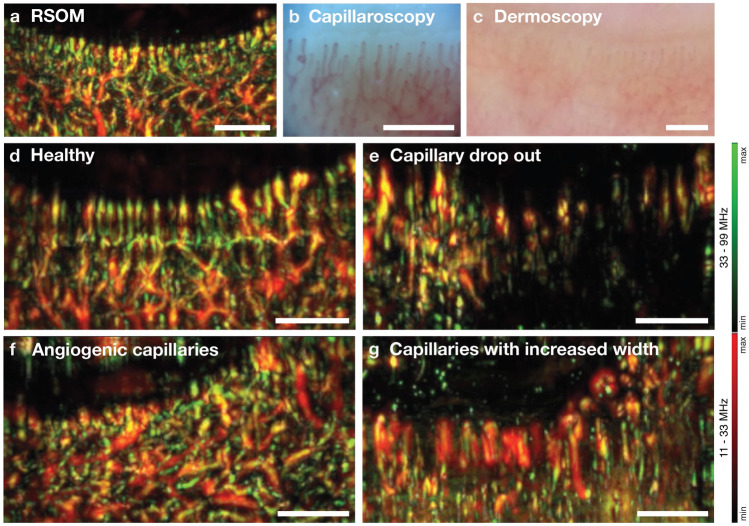
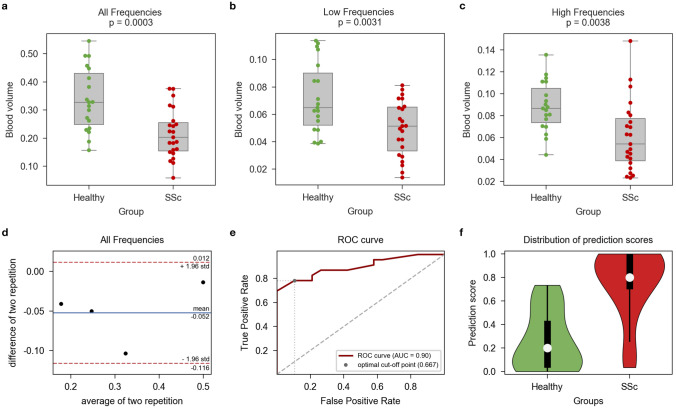
The autoimmune disease systemic sclerosis (SSc) causes microvascular changes that can be easily observed cutaneously at the finger nailfold. Optoacoustic imaging (OAI), a combination of optical and ultrasound imaging, specifically raster-scanning optoacoustic mesoscopy (RSOM), offers a non-invasive high-resolution 3D visualization of capillaries allowing for a better view of microvascular changes and an extraction of volumetric measures. In this study, nailfold capillaries of patients with SSc and healthy controls are imaged and compared with each other for the first time using OAI. The nailfolds of 23 patients with SSc and 19 controls were imaged using RSOM. The acquired images were qualitatively compared to images from state-of-the-art imaging tools for SSc, dermoscopy and high magnification capillaroscopy. The vascular volume in the nailfold capillaries were computed from the RSOM images. The vascular volumes differ significantly between both cohorts (0.216 ± 0.085 mm3 and 0.337 ± 0.110 mm3; p < 0.0005). In addition, an artificial neural network was trained to automatically differentiate nailfold images from both cohorts to further assess whether OAI is sensitive enough to visualize anatomical differences in the capillaries between the two cohorts. Using transfer learning, the model classifies images with an area under the ROC curve of 0.897, and a sensitivity of 0.783 and specificity of 0.895. In conclusion, this study demonstrates the capabilities of RSOM as an imaging tool for SSc and establishes it as a modality that facilitates more in-depth studies into the disease mechanisms and progression.


Conflict of interest statement

K.H. is an employee of iThera Medical. V.N. is a co-founder and shareholder of iThera Medical. Authors S.N., T.B.M, J.B.M., G.D., M.B, C.T., M.R.D., D.J. A.L.H and A.K.M declare no competing interests.

Figures

Figure 1
Figure 1
Examples of nailfold capillaries imaged with high magnification green light microscopy (optical magnification: × 200). (a) nailfold capillaries in a healthy control with narrow, straight, uniformly distributed capillaries and (b,c) vasculopathy observed at the nailbed for patients with SSc with (b) 1: dilated capillaries and 2: angiogenic, narrow twisted capillaries and with (c) 3: decreased capillary density with areas of avascularity and 4: dilated capillaries. Multiple images were stitched together to depict a larger field-of-view. All scale bars, 500 μm.
Figure 2
Figure 2
Study setup. (a) RSOM imaging system (RSOM Explorer C50) used to obtain OAI images in the nailfold with 1: flexible mechanical arm, 2: laser fibre optic cable, 3: 50 MHz detector. (b) Finger viewed from above showing approximate area imaged by OAI system (with field-of-view marked in green).
Figure 3
Figure 3
Schematic of machine learning process. RSOM volume is segmented, an MIP is created and the resulting 2D image is sliced into multiple image slices. For each image slice a pretrained deep neural network, ResNet18, predicts whether it belongs to a healthy control or a patient with SSc. The final classifier aggregates the network output for the image slices per patient and computes the prediction score for each patient. The MIPs combine the low and the high frequency bands following equalization, with the high frequency image in green and the low frequency image in red.
Figure 4
Figure 4
Visual Comparison. (a) MIP image of an RSOM volume of a healthy nailfold compared to optical imaging with (b) capillaroscopy and (c) lower magnification dermoscopy; (d) Examples of RSOM images taken from a healthy control with straight, uniformly distributed capillaries and (eg) patients with SSc showing (e) capillary drop out, (f) angiogenic, twisted capillaries and (g) increased capillary width. The MIP images are a combination of the images from the high and low frequency bands after equalization (green: high frequencies, smaller structures, red: low frequencies, larger structures, yellow: merging of both frequency bands). All scale bars, 1 mm.
Figure 5
Figure 5
Analysis results. (ac) Vascular volume for healthy controls vs subjects with SSc for the (a) all-frequency images, (b) low-frequency images (displaying large vessels) and (c) high-frequency images (displaying small vessels); the boxes represent the inter-quartile range while the whiskers extend to show the whole range of the distribution. (d) Bland–Altman plot showing reproducibility of vascular volume as a feature computed in RSOM (containing all frequencies); (e) ROC-curve for machine learning-based differentiation of RSOM images; (f) Distribution of prediction scores from machine learning-based classification.

References

    1. Herrick AL. Recent advances in the pathogenesis and management of Raynaud’s phenomenon and digital ulcers. Curr. Opin. Rheumatol. 2016;28:577–585. doi: 10.1097/BOR.0000000000000332. - DOI - PubMed
    1. Berks M, et al. Automated structure and flow measurement: a promising tool in nailfold capillaroscopy. Microvasc. Res. 2018;118:173–177. doi: 10.1016/j.mvr.2018.03.016. - DOI - PMC - PubMed
    1. Mihai C, et al. The emerging application of semi-quantitative and quantitative capillaroscopy in systemic sclerosis. Microvasc. Res. 2018;118:113–120. doi: 10.1016/j.mvr.2018.03.004. - DOI - PubMed
    1. Van Den Hoogen F, et al. 2013 classification criteria for systemic sclerosis: an American College of Rheumatology/European league against rheumatism collaborative initiative. Ann. Rheum. Dis. 2013;72:1747–1755. doi: 10.1136/annrheumdis-2013-204424. - DOI - PubMed
    1. Wang LV, Hu S. Photoacoustic tomography: In vivo imaging from organelles to organs. Science. 2012;335:1458–1462. doi: 10.1126/science.1216210. - DOI - PMC - PubMed

Publication types