. 2020 Oct 5;10(1):16459.
doi: 10.1038/s41598-020-73177-y.

Hyaluronan regulates synapse formation and function in developing neural networks

Affiliations

Hyaluronan regulates synapse formation and function in developing neural networks

Emily Wilson et al. Sci Rep. .

Abstract

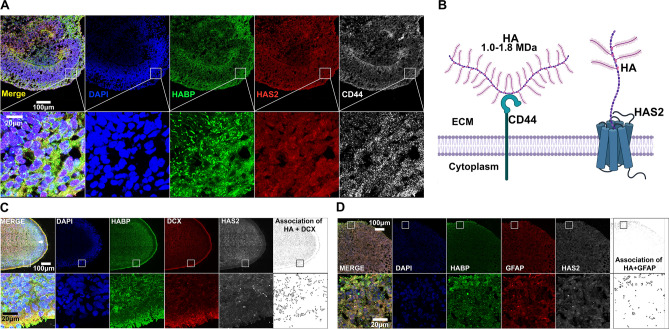
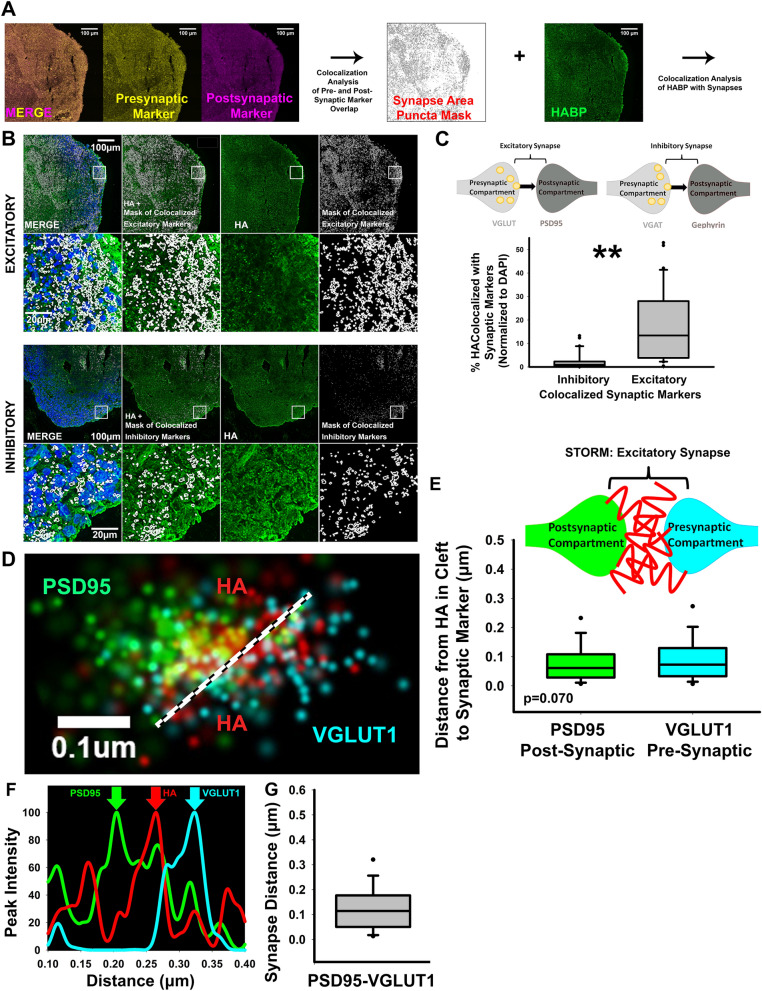
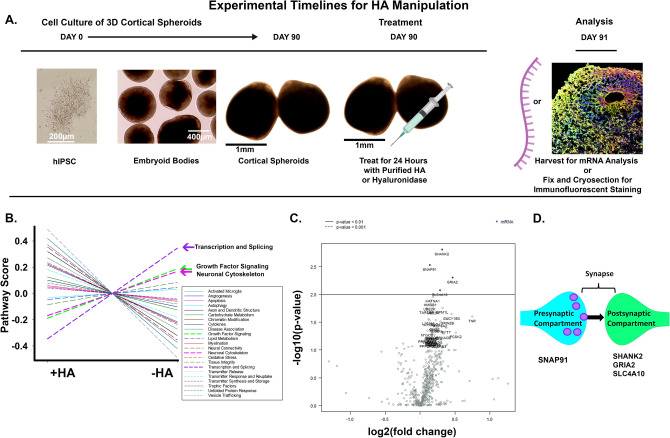
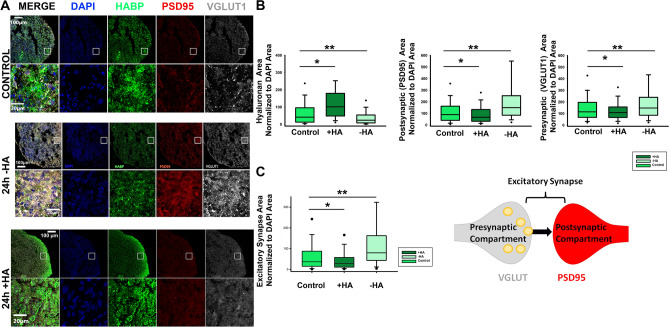
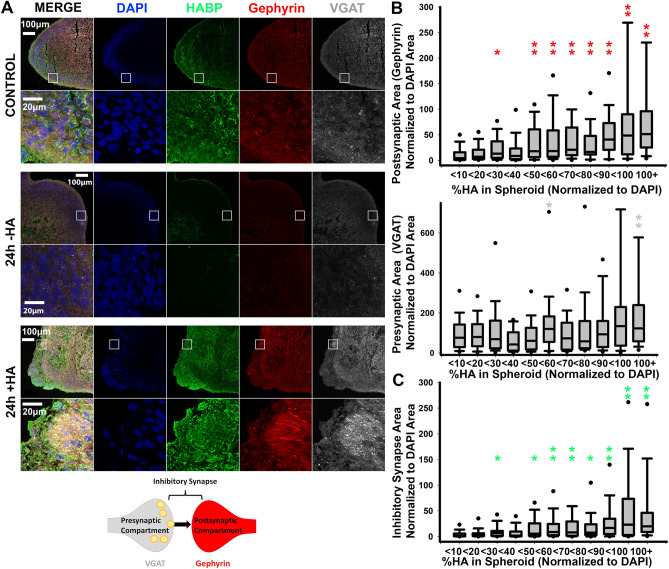
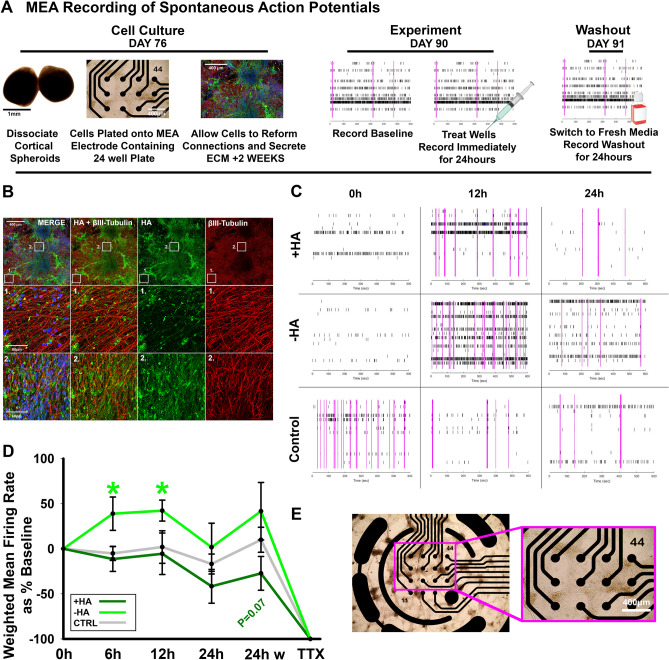
Neurodevelopmental disorders present with synaptic alterations that disrupt the balance between excitatory and inhibitory signaling. For example, hyperexcitability of cortical neurons is associated with both epilepsy and autism spectrum disorders. However, the mechanisms that initially establish the balance between excitatory and inhibitory signaling in brain development are not well understood. Here, we sought to determine how the extracellular matrix directs synapse formation and regulates synaptic function in a model of human cortical brain development. The extracellular matrix, making up twenty percent of brain volume, is largely comprised of hyaluronan. Hyaluronan acts as both a scaffold of the extracellular matrix and a space-filling molecule. Hyaluronan is present from the onset of brain development, beginning with neural crest cell migration. Through acute perturbation of hyaluronan levels during synaptogenesis, we sought to determine how hyaluronan impacts the ratio of excitatory to inhibitory synapse formation and the resulting neural activity. We used 3-D cortical spheroids derived from human induced pluripotent stem cells to replicate this neurodevelopmental window. Our results demonstrate that hyaluronan preferentially surrounds nascent excitatory synapses. Removal of hyaluronan increases the expression of excitatory synapse markers and results in a corresponding increase in the formation of excitatory synapses, while also decreasing inhibitory synapse formation. This increased excitatory synapse formation elevates network activity, as demonstrated by microelectrode array analysis. In contrast, the addition of purified hyaluronan suppresses excitatory synapse formation. These results establish that the hyaluronan extracellular matrix surrounds developing excitatory synapses, where it critically regulates synapse formation and the resulting balance between excitatory to inhibitory signaling.


Conflict of interest statement

The authors declare no competing interests.

Figures

Figure 1
Figure 1
Human IPSC-derived Cortical Spheroids Produce Hyaluronan ECM. (A) 10 μm thick cryosections of 90-day-old control spheroids were stained for ECM components. Left to right: merged channels, nuclei marker DAPI (blue), HA as detected by HABP (green), HA synthase HAS2 (red), and HA receptor CD44 (white). Bottom panel highlights a section of the cortical plate at increased magnification. Scale bar of top panel: 100 μm, bottom panel: 20 μm. (B) Graphic illustration of how HA is produced by HAS and interacts with CD44 at the cell membrane. (C) 10 μm thick cryosections of 90-day-old control spheroids were stained for DAPI (blue), HABP (green), neuronal marker DCX (red) and HAS2 (white). Arrows in top left panel highlight the cortical plate. Bottom panel highlights a section of the cortical plate at increased magnification. Scale bar of top panel: 100 μm, bottom panel: 20 μm. (D) 10 μm thick cryosections of 90-day-old control spheroids were stained for DAPI (blue), HABP (green), astrocyte marker GFAP (red) and HAS2 (white). Bottom panel highlights a section of the cortical plate at increased magnification. Scale bar of top panel: 100 μm, bottom panel: 20 μm. Further analysis of cell-type specific expression of HA-ECM components can be found in Fig. S2, while validation of HAS2 immunostaining can be found in Fig. S3.
Figure 2
Figure 2
HA is present at excitatory synapses. (A) Representative workflow of analysis of HA localization at excitatory and inhibitory synapses. Confocal images of pre- and post-synaptic markers are first analyzed to identify co-localization in synapses. The identified synapses are then analyzed for colocalization with HA. (B) Representative images of DAPI (blue), and HA (green) together with excitatory synapse markers, vGlut-1 and PSD-95, and inhibitory synapse markers, vGAT and gephyrin. White outlines indicate the identified synapses. (C) Co-localization analysis reveals that HA is preferentially enriched at excitatory synapses, shown as %HABP colocalized with synaptic markers. The corresponding percentage of excitatory and inhibitory synapses containing HA is quantified in Fig. S4, further demonstrating that excitatory synapses preferentially associate with HA. (D) STORM imaging was used to visualize HA at individual excitatory synapses. The pre-synaptic marker vGlut-1 is shown in blue, HA is shown in red, and post-synaptic PSD-95 is shown in green. Note that HA is positioned between the pre- and post-synaptic compartment of the excitatory synapse. (E) Quantification of the distance between HA and pre-synaptic vGlut-1 and post-synaptic PSD-95 as determined by the displacement of maximum peak intensities. There is not a significant difference between the distance of HA-vGlut1 and HA-PSD-95, indicating that HA does not preferentially localize to one side of the excitatory synapse, and instead lies in the synaptic cleft between pre- and post-synaptic compartments as illustrated by the corresponding diagram. n = 167 synapses. (F) Representative plot profile of the excitatory synaptic markers and HA in the highlighted synapse (D). (G) Quantification of distance from pre-synaptic vGlut-1 to post-synaptic PSD-95, n = 167 synapses.
Figure 3
Figure 3
Nanostring mRNA analysis reveals synaptic changes in response to hyaluronan manipulations. (A) Experimental timeline for HA manipulation. Human IPSCs (Day 0) are used to make cortical spheroids (Day 90). Middle image shows intermediate stage embryoid bodies around day 9. 90-day-old spheroids are treated with purified HA or streptomyces hyaluronidase to digest HA. After 24 h of treatment, spheroids are harvested for subsequent analysis. (B) Average pathway scores were plotted for + HA (hyaluronan addition) and − HA (hyaluronidase treatment), revealing three pathways that were preferentially increased by hyaluronidase treatment: Transcription and Splicing (purple), Growth Factor Signaling (green), and Neuronal Cytoskeleton (pink). (C) Volcano plot of the differential expression of all genes analyzed. − HA differential expression is plotted against + HA differential expression, such that mRNAs to the right of 0.0 on the x-axis are upregulated in response to hyaluronidase treatment. The top four differentially-expressed mRNAs (as indicated by blue dots above the p < 0.01 line) are all synapse-associated proteins. (D) Representative image of a synapse showing the pre- or post-synaptic protein localization corresponding to the differentially-expressed mRNAs.
Figure 4
Figure 4
HA regulates excitatory synapse formation. (A) 10 μm-thick cryosections of 90-day-old cortical spheroids were stained for excitatory synapse markers after 24 h of treatment with purified HA (+ HA) or streptomyces hyaluronidase (− HA). Blue: DAPI, Green: HABP (HA), Red: PSD-95 (post-synaptic marker), Grey: vGlut-1 (pre-synaptic marker). Scale bars for top panels of spheroid images are 100 µm, scale bars for bottom ROI panels for spheroid images are 20 µm. (B) Graphs quantifying the area of individual synapse markers following hyaluronan manipulations. n = 30 spheroid slices per treatment. (C) Quantification of the resulting changes in total excitatory synapse area as determined by co-localization of pre- and post-synaptic markers normalized to DAPI. n = 30 spheroid slices per treatment. Solid black dots represent 95th percentile outliers, one asterisk signifies p value < 0.05, two asterisks signify p value < 0.01.
Figure 5
Figure 5
HA regulates inhibitory synapse formation. (A) 10 μm-thick cryosections of 90-day-old cortical spheroids were stained for inhibitory synapse markers after 24 h of treatment with purified HA (+ HA) or streptomyces hyaluronidase (− HA). Blue: DAPI, Green: HABP (HA), Red: Gephyrin (post-synaptic marker), Grey: vGAT (pre-synaptic marker). (B) HA levels were quantified across all treatment groups, and were used to bin the corresponding areas of inhibitory synapse marker, gephyrin and vGAT. (C) Quantification of the resulting changes total inhibitory synapse area as determined by co-localized pre- and post-synaptic markers normalized to DAPI. Inhibitory synapse area is stratified based on the corresponding HA levels. n = 30 spheroid slices per treatment. Solid black dots represent 95th percentile outliers, one asterisk signifies p value < 0.05, two asterisks signify p value < 0.01.
Figure 6
Figure 6
HA regulates spontaneous action potential formation. (A) Workflow for MEA experiments. Day 76 spheroids are dissociated enzymatically and plated onto 24-well microelectrode array plates. After 2 weeks, neurons have re-established neural networks and the HA-based ECM. At day 90, the cells are treated and spontaneous action potentials are recorded for 10 min/hour for 24 h. After 24 h, fresh media is added to wells for a washout recording of 10 min/hour for 24 h. (B) Representative confocal image for βIII-tubulin (neurons, red), DAPI (nuclei, blue), and HABP (HA, green) for cortical spheroids dissociated at day 76 and imaged at day 90. Middle and bottom panels highlight detail of HABP and βIII-tubulin area. Scale bar top panel: 400 μm, middle and bottom panel: 60 μm. (C) Raster plots of spontaneous action potentials in + HA (top), − HA (middle), and control wells (bottom) at 0 h, 12 h, and 24 h after treatment. Each black bar is a single spike, meaning one electrode has fired, pink bars highlight network bursts, where more than one electrode detect simultaneous activity. High network bursting is characteristic of hyperexcitable networks. (D) Quantification of the weighted mean firing rate (WMFR) for each treatment at 0 h, 6 h, 12 h, 24 h post treatment, 24 h post washout, and immediately after TTX treatment. Hyaluronidase treatment significantly increased WMFR at 6 h and 12 h following treatment. (E) Brightfield image of dissociated spheroids plated for 2 weeks on a microelectrode array. Inset shows association of neurons with electrodes. Scale bar 400 µm.

Similar articles

Cited by

References

    1. Casini P, Nardi I, Ori M. Hyaluronan is required for cranial neural crest cells migration and craniofacial development. Dev. Dyn. 2012;241:294–302. doi: 10.1002/dvdy.23715. - DOI - PubMed
    1. Morris‐Wiman, J. & Brinkley, L. L. The role of the mesenchyme in mouse neural fold elevation. II. Patterns of hyaluronate synthesis and distribution in embryos developing in vitro. Am. J. Anat.188, 133–147 (1990). - PubMed
    1. Preston, M. & Sherman, L. S. Neural stem cell niches: roles for the hyaluronan-based extracellular matrix. Front. Biosci. (Schol. Ed).3, 1165–79 (2011). - PMC - PubMed
    1. Su W, et al. CD44 transmembrane receptor and hyaluronan regulate adult hippocampal neural stem cell quiescence and differentiation. J. Biol. Chem. 2017 doi: 10.1074/jbc.M116.774109. - DOI - PMC - PubMed
    1. Fowke, T. M. et al. Hyaluronan synthesis by developing cortical neurons in vitro. Sci. Rep.7, (2017). - PMC - PubMed

MeSH terms

Substances