. 2020 Oct 5;10(1):16492.
doi: 10.1038/s41598-020-73473-7.

Enhanced asthma-related fibroblast to myofibroblast transition is the result of profibrotic TGF-β/Smad2/3 pathway intensification and antifibrotic TGF-β/Smad1/5/(8)9 pathway impairment

Affiliations

Enhanced asthma-related fibroblast to myofibroblast transition is the result of profibrotic TGF-β/Smad2/3 pathway intensification and antifibrotic TGF-β/Smad1/5/(8)9 pathway impairment

Dawid Wnuk et al. Sci Rep. .

Abstract

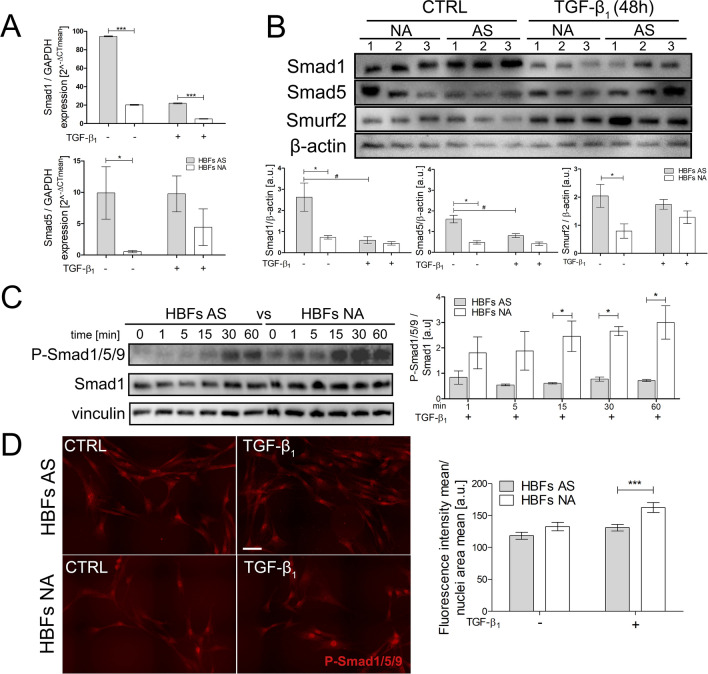
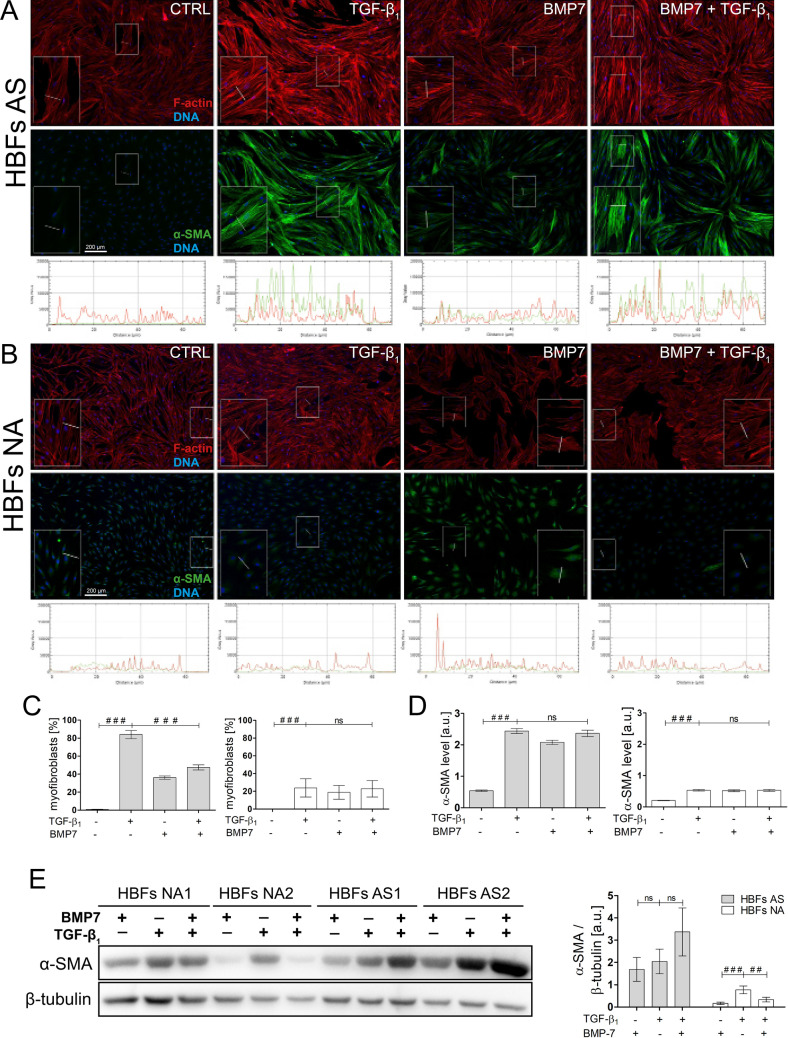
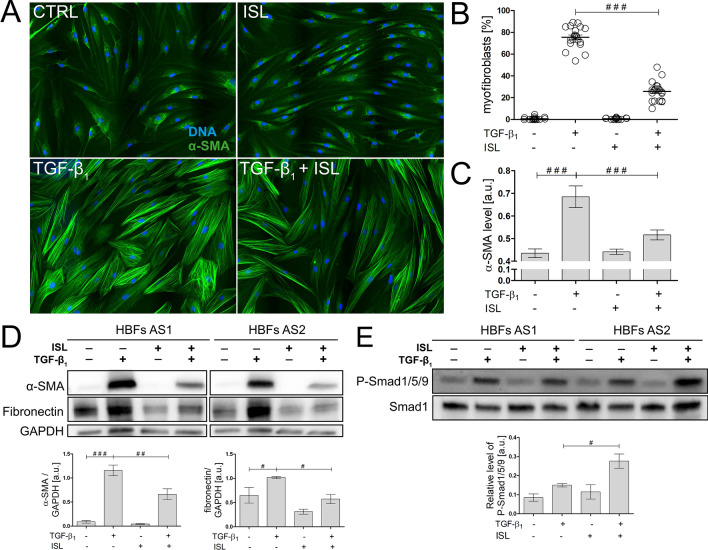
Airway remodelling with subepithelial fibrosis, which abolishes the physiological functions of the bronchial wall, is a major issue in bronchial asthma. Human bronchial fibroblasts (HBFs) derived from patients diagnosed with asthma display in vitro predestination towards TGF-β1-induced fibroblast-to-myofibroblast transition (FMT), a key event in subepithelial fibrosis. As commonly used anti-asthmatic drugs do not reverse the structural changes of the airways, and the molecular mechanism of enhanced asthma-related TGF-β1-induced FMT is poorly understood, we investigated the balance between the profibrotic TGF-β/Smad2/3 and the antifibrotic TGF-β/Smad1/5/9 signalling pathways and its role in the myofibroblast formation of HBF populations derived from asthmatic and non-asthmatic donors. Our findings showed for the first time that TGF-β-induced activation of the profibrotic Smad2/3 signalling pathway was enhanced, but the activation of the antifibrotic Smad1/5/(8)9 pathway by TGF-β1 was significantly diminished in fibroblasts from asthmatic donors compared to those from their healthy counterparts. The impairment of the antifibrotic TGF-β/Smad1/5/(8)9 pathway in HBFs derived from asthmatic donors was correlated with enhanced FMT. Furthermore, we showed that Smad1 silencing in HBFs from non-asthmatic donors increased the FMT potential in these cells. Additionally, we demonstrated that activation of antifibrotic Smad signalling via BMP7 or isoliquiritigenin [a small-molecule activator of the TGF-β/Smad1/5/(8)9 pathway] administration prevents FMT in HBFs from asthmatic donors through downregulation of profibrotic genes, e.g., α-SMA and fibronectin. Our data suggest that influencing the balance between the antifibrotic and profibrotic TGF-β/Smad signalling pathways using BMP7-mimetic compounds presents an unprecedented opportunity to inhibit subepithelial fibrosis during airway remodelling in asthma.


Conflict of interest statement

The authors declare no competing interests.

Figures

Figure 1
Figure 1
HBFs derived from patients with asthma transdifferentiate into myofibroblasts efficiently and faster than those of their healthy counterparts. HBFs (AS = 10; NA = 6) were cultured in serum-free conditions in the absence or presence of TGF-β1 (5 ng/mL) for 0–7 days. (A) Then, the cells were fixed with 3.7% formaldehyde, permeabilized, and immunostained for α-SMA (green) and counterstained for DNA (blue), as shown on representative images. Scale bar = 25 μm. (B) The fraction of cells with prominent α-SMA-positive stress fibres in HBF populations was determined using fluorescence microscopy, each in three independent experiments. (C,D) Main markers of myofibroblast formation: α-SMA and EDA-fibronectin levels were assessed using in-cell-ELISA tests, and the results are presented as the mean value of absorbance (450 nm) reflecting the protein content. Data represent the mean ± SEM carried out on HBFs (AS = 10; NA = 6), each in triplicate. (E,F) HBFs (AS = 7; NA = 7) were cultured in serum-free conditions in the absence or presence of TGF-β1 for 24 h. RT-qPCR analyses of alpha smooth muscle actin (ACTA2) and TGF-β1 expression were performed. Statistical significances of all experiments were tested using the non-parametric Mann–Whitney test; *p ≤ 0.05, **p ≤ 0.01.
Figure 2
Figure 2
The TGF-β1/Smad2/3 pathway is intensified in HBFs derived from patients with asthma compared to their healthy counterparts. Cells (AS = 7, NA = 7) were cultured in serum-free medium with or without TGF-β1 (5 ng/mL) for 24 h (A), 48 h (B), 1–60 min (C,D) or 0–240 min (E,F). (A) Smad expression was analysed at the mRNA level using RT-qPCR. (B-D) Smad2, Smad3, and their phosphorylated forms were detected using Western blots. Representative membranes are shown. Densitometric quantification of Smad proteins in relation to β-actin and p-Smad2 or 3 in relation to appropriate Smads (as control proteins) are presented on the graphs as values of relative optical densities (ROD) (n = 6). (EF) HBFs were fixed, permeabilized, and immunostained for p-Smad2 or p-Smad3. Representative photos were selected. Scale bar = 25 μm. The percentage of cells with p-Smad + nuclei was determined using fluorescence microscopy. Alternatively, p-Smad levels in HBF nuclei were quantified with the fluorometric approach using ImageJ, and the results are presented as the mean fluorescence intensity in relation to the nuclei area. Data on photos (yellow) represent the mean ± SEM of AS = 5, NA = 5; each in min. 100 cells. Statistical significance (CF) * between HBFs AS TGF vs HBFs NA TGF; (F) # HBFs AS CTRL vs HBFs NA CTRL. Statistical significance was tested using the non-parametric Mann–Whitney test; * p ≤ 0.05, **p ≤ 0.01, *** p ≤ 0.001.
Figure 3
Figure 3
The TGF-β1/Smad1/5/9 pathway is intensified in HBFs derived from patients without asthma compared to asthmatic patients. (A) Cells were cultured in serum-free medium supplemented with TGF-β1 (5 ng/mL) for 24 h. Then, the mRNA was isolated, and transcripts were analysed using RT-qPCR. (B) Smad1, Smad5, and Smurf2 were detected using Western blots. Representative membranes are shown. Densitometric quantification is presented on the graphs as values of the relative optical densities (ROD) (n = 6) of the bands in relation to that of β-actin (control protein). (C) Phosphorylated forms of Smad1/5/9 (p-Smad1/5/9) were detected using Western blots. Representative membranes are shown. Densitometric quantification is presented on the graph as values of the relative optical densities (ROD) (n = 4) of p-Smads in relation to Smad1 (as the control protein) (D) HBFs cultured in serum-free medium were fixed, permeabilized, and immunostained for p-Smad1/5/9, and the percentage of cells with p-Smad1/5/9-positive nuclei was determined using fluorescence microscopy. Representative photos were selected. Scale bar = 25 μm. The mean fluorescence intensity in relation to the nuclei area (AS = 3, NA = 3 each in 200 cells) was measured using ImageJ. Statistical significance was tested using the non-parametric Mann–Whitney test; *p ≤ 0.05, ***p ≤ 0.001 or the T-test; #p ≤ 0.05.
Figure 4
Figure 4
The Smad2/3 pathway is overactivated in HBFs derived from patients without asthma after Smad1 silencing. (A) HBFs cultured in serum-free medium were transfected with siRNA-Smad1 or control-siRNA, treated with TGF-β1 (5 ng/ml) for 1 h (photos) and 5 days (inserts), fixed, permeabilized, and immunostained for p-Smad2/3 (red) and α-SMA (green), as shown on representative images and inserts. The fluorescence intensity of α-SMA-enriched fibres is presented on the plot profiles (under the photos). (B,C) Fluorescence intensity of p-Smad2/3-positive nuclei was determined using fluorescence microscopy at the same excitation and analysed by ImageJ. Representative photos were selected. Scale bar = 100 μm. Data represent the mean ± SEM of 100 cells (AS = 3, NA = 3); each in duplicate. Statistical significance was tested using one-way ANOVA with the Bonferroni multiple comparison post hoc test; ###p ≤ 0.001.
Figure 5
Figure 5
Smad2/3 versus Smad1/5/9 activation balance plays a pivotal role in fibroblast to myofibroblast transition of HBFs. (A,B) HBFs were cultured in serum-free medium without (Ctrl) or with TGF-β1 (5 ng/ml) in the absence or presence of BMP7 (100 ng/ml) for 7 days. Then, the cells were fixed, permeabilized, and immunostained for α-SMA (green) and counterstained for F-actin (red) and DNA (blue), as shown on representative images. The intensity of actin fibre fluorescence in the sections is presented on plot profiles and quantified in graphs (under the photos). Scale bar = 200 μm. (C,E) The fraction of cells with prominent α-SMA-positive stress fibres in HBF populations was determined using fluorescence microscopy in three independent experiments. (D,F) Analyses of α-SMA content were carried out using an in-cell ELISA test, and the results are presented as the mean value of absorbance (450 nm) reflecting the protein content. Data represent the mean ± SEM carried out on HBFs (AS = 10; NA = 6), each in triplicate. (G) α-SMA was detected using Western blots. Representative membranes are shown. Glyceraldehyde 3 phosphate dehydrogenase (GAPDH) was used as a loading control. (H) Densitometric quantification of membranes is presented on the graph as values of the relative optical densities (ROD) (n = 2) of α-SMA in relation to GAPDH (as control protein) (A,C,D) HBFs from asthmatics, (B,E,F) HBFs from non-asthmatics. Statistical significance was tested using were determined using Statistical significance was tested using one-way ANOVA with the Bonferroni multiple comparison post hoc test; ns – non statistically significant, #p ≤ 0.05, ##p ≤ 0.01, ###p ≤ 0.001.
Figure 6
Figure 6
Isoliquiritigenin (ISL) attenuates the TGF-β1-induced phenotypic transition of HBFs into myofibroblasts through Smad1/5/9 pathway stimulation. (A) HBFs derived from asthmatic donors were cultured in serum-free medium supplemented with TGF-β1 (5 ng/mL) or not (Ctrl) in the absence or presence of ISL (25 μM) for four days. Then, the cells were fixed with 3.7% formaldehyde, permeabilized, and immunostained for α-SMA (green) and DNA (blue), as shown on representative images. Scale bar = 25 μm. (B) The fraction of cells with prominent α-SMA+ stress fibres (myofibroblasts) in HBF populations (n = 6) was determined using fluorescence microscopy in three independent experiments. (C) α-SMA content was defined using in-cell ELISA, and the results are presented as the mean value of absorbance (450 nm) reflecting the protein content. Data represent the mean ± SEM carried out on HBFs AS (n = 6), each in duplicate. (D) Analyses of α-SMA and fibronectin content were carried out in total cell lysates from HBFs cultured as in (A) using immunoblotting. Glyceraldehyde 3 phosphate dehydrogenase (GAPDH) was used as a loading control. The effect of ISL on the α-SMA levels in the TGF-β1-treated HBFs is presented as a bar graph and shows densitometric quantification of the Western blots. Data are the mean ± SEM (n = 5). (E) The activation of the Smad1/5/9 pathway was determined using Western blot analysis of Smad1/5/9 phosphorylation in relation to Smad1 and GAPDH as a loading control. Statistical significance was tested using the t-test; #p ≤ 0.05, ##p ≤ 0.01, ###p ≤ 0.001.
Figure 7
Figure 7
Schematic representation of interrelations between profibrotic Smad2/3-dependent and anti-fibrotic Smad1/5/(8)9-dependent pathways in HBFs. TGF-β1-activated profibrotic Smad2/3 pathway is enhanced in HBFs derived from asthmatic patients (↑AS; red) than in its non-asthmatic (NA) counterparts (both at the level of phosphorylation of Smad2/3 proteins and their intranuclear translocation). However, in response to TGF-β1 exposition, HBFs NA shows the increased activation of anti-fibrotic Smad1/5/(8)9 pathway (↑NA; green) (both at the level of phosphorylation of Smad1/5/(8)9 proteins and their intranuclear translocation). Isoliquiritigenin (ISL), is able to increasing the activation of Smad1/5/(8)9-dependent pathway (↑AS; green) and concomitant attenuation of pro-fibrotic potential in HBFs AS. Dysregulation of balance between profibrotic Smad2/3 and anti-fibrotic Smad1/5/(8)9 pathway may leads to the enhanced fibrogenic potential of asthmatic HBFs (↑AS; red). ↑—activation of pro-fibrotic pathway (red); ↑—activation of anti-fibrotic pathway (green); Abbreviations: TGF-β1 transforming growth factor-β1; BMP7 bone morphogenic protein 7; ISL isoliquiritigenin; SBE Smad binding elements; HBFs human bronchial fibroblasts; AS asthmatic; NA non-asthmatic; P phosphorylation sites; ERK1/2 extracellular signal-related kinase 1/2.

References

    1. Grainge CL, et al. Effect of bronchoconstriction on airway remodeling in asthma. N. Engl. J. Med. 2011;364:2006–2015. doi: 10.1056/NEJMoa1014350. - DOI - PubMed
    1. Baldwin L, Roche WR. Does remodelling of the airway wall precede asthma? Paediatr. Respir. Rev. 2002;3:315–320. doi: 10.1016/S1526054202002610. - DOI - PubMed
    1. Martin JG, Verma N. Mechanisms of airway remodeling in asthma. Drug Discov. Today Dis. Mech. 2012;9:e95–e102. doi: 10.1016/j.ddmec.2012.11.004. - DOI
    1. Michalik M, et al. Fibroblast-to-myofibroblast transition in bronchial asthma. Cell. Mol. Life Sci. 2018;75:3943–3961. doi: 10.1007/s00018-018-2899-4. - DOI - PMC - PubMed
    1. Fehrenbach H, Wagner C, Wegmann M. Airway remodeling in asthma: what really matters. Cell Tissue Res. 2017;367:551–569. doi: 10.1007/s00441-016-2566-8. - DOI - PMC - PubMed

Publication types

Substances