. 2020 Oct 5;10(1):16455.
doi: 10.1038/s41598-020-73423-3.

Evidence of drought memory in Dipteryx alata indicates differential acclimation of plants to savanna conditions

Affiliations

Evidence of drought memory in Dipteryx alata indicates differential acclimation of plants to savanna conditions

Rauander D F B Alves et al. Sci Rep. .

Abstract

The remarkable phytogeographic characteristics of the Brazilian savanna (Cerrado) resulted in a vegetation domain composed of plants with high structural and functional diversity to tolerate climate extremes. Here we used a key Cerrado species (Dipteryx alata) to evaluate if species of this domain present a mechanism of stress memory, responding more quickly and efficiently when exposed to recurrent drought episodes. The exposure of D. alata seedlings to drought resulted in several changes, mainly in physiological and biochemical traits, and these changes differed substantially when the water deficit was imposed as an isolated event or when the plants were subjected to drought cycles, suggesting the existence of a drought memory mechanism. Plants submitted to recurrent drought events were able to maintain essential processes for plant survival when compared to those submitted to drought for the first time. This differential acclimation to drought was the result of orchestrated changes in several metabolic pathways, involving differential carbon allocation for defense responses and the reprogramming and coordination of primary, secondary and antioxidant metabolism. The stress memory in D. alata is probably linked the evolutionary history of the species and reflects the environment in which it evolved.


Conflict of interest statement

The authors declare no competing interests.

Figures

Figure 1
Figure 1
Water content (WC) (A), predawn water potential (Ѱpd) (B) and leaf hydraulic conductivity (Kleaf) (C) in Dipteryx alata seedlings exposed to continuous irrigation (control, CT), one drought cycle (1D) and three drought cycles (3D) for 6 days. Means followed by the same letter do not differ from each other by the SNK test (P ≤ 0.05).
Figure 2
Figure 2
Specific leaf area (SLA) (A), aerial dry mass (ADM) (B) and root dry mass (RDM) (C) in Dipteryx alata seedlings exposed to continuous irrigation (control, CT), one drought cycle (1D) and three drought cycles (3D) for 6 days. Means followed by the same letter do not differ from each other by the SNK test (P ≤ 0.05).
Figure 3
Figure 3
Stomatal density (SD) (A), stomatal index (SI) (B), maximum stomatal conductance (gwmax) (C) and vein density (VD) (D) in Dipteryx alata seedlings exposed to continuous irrigation (control, CT), one drought cycle (1D) and three drought cycles (3D) for 6 days. Means followed by the same letter do not differ from each other by the SNK test (P ≤ 0.05).
Figure 4
Figure 4
Chlorophyll a (A), chlorophyll b (B) and potential quantum yield of photosystem II (Fv/Fm) (C) in Dipteryx alata seedlings exposed to continuous irrigation (control, CT), one drought cycle (1D) and three drought cycles (3D) for 6 days. Means followed by the same letter do not differ from each other by the SNK test (P ≤ 0.05).
Figure 5
Figure 5
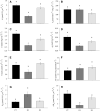
Net carbon assimilation rate (A) (A), internal CO2 concentration (Ci) (B), transpiration rate (E) (C), stomatal conductance (gs) (D), Rubisco maximum carboxylation rate (Vcmax) (E), water use efficiency (A/E) (F), dark respiration (RN) (G) and A/RN ratio (H) in Dipteryx alata seedlings exposed to continuous irrigation (control, CT), one drought cycle (1D) and three drought cycles (3D) for 6 days. Means followed by the same letter do not differ from each other by the SNK test (P ≤ 0.05).
Figure 6
Figure 6
Hydrogen peroxide concentration (H2O2) (A) and Electrolyte leakage (EL) (B) in Dipteryx alata seedlings exposed to continuous irrigation (control, CT), one drought cycle (1D) and three drought cycles (3D) for 6 days. Means followed by the same letter do not differ from each other by the SNK test (P ≤ 0.05).
Figure 7
Figure 7
Enzymatic antioxidant system: superoxide dismutase (SOD) (A), peroxidase (POX) (B), catalase (CAT) (C), ascorbate peroxidase (APX) (D) and glutathione reductase (GR) in Dipteryx alata seedlings exposed to continuous irrigation (control, CT), one drought cycle (1D) and three drought cycles (3D) for 6 days. Means followed by the same letter do not differ from each other by the SNK test (P ≤ 0.05).
Figure 8
Figure 8
Major metabolic alterations in Dipteryx alata seedlings exposed to continuous irrigation (control, CT), one drought cycle (1D) and three drought cycles (3D) for 6 days. Values are the fold change relative to control mean. Boxes followed by the same letter do not differ from each other by the SNK test (P ≤ 0.05).
Figure 9
Figure 9
Carbon balance in plants exposed to 1 (1D plants) or 3 (3D plants) drought cycles. Blue arrows indicate anabolic process (photosynthesis) and red arrows indicate catabolic processes. The thickness of the arrow indicates the intensity of the process. Plants that experienced 3 drought cycles were able to keep their stomata open and, consequently, had a higher rate of carbon fixation, which was directed to defense mechanisms. Activation of defense responses maintained cell integrity, which allowed maintenance respiration to continue at levels similar to control. In plants exposed to a single drought cycle, stomatal closure resulted in less carbohydrate production, which associated with less activation of defense mechanisms triggered several cellular damages. The high increase in maintenance respiration in these plants required the deviation of metabolites from other pathways to the TCA cycle.
Figure 10
Figure 10
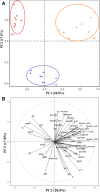
Multivariate analysis (PCA analysis). Two-dimensional PCA biplots showing associations between experimental groups and analysis spots generated by principal component analysis (PCA). The segregation of the experimental groups (A) and the correlation coefficients for all the analysis (B) were plotted in the first two component spaces.

References

    1. Lapola DM, et al. A climate-change vulnerability and adaptation assessment for Brazil’s protected areas. Conserv. Biol. 2019;0:1–11. - PubMed
    1. Dalle Laste KC, Durigan G, Andersen AN. Biodiversity responses to land-use and restoration in a global biodiversity hotspot: Ant communities in Brazilian Cerrado. Austral Ecol. 2019;44:313–326. doi: 10.1111/aec.12676. - DOI
    1. Haffer J. Speciation in Amazonian forest birds. Science (80-). 1969;165:131–137. doi: 10.1126/science.165.3889.131. - DOI - PubMed
    1. Ab’Saber AN. Spaces occupied by the expansion of dry climates in South America during the quaternary ice ages. Rev. Inst. Geol. 2000;21:71–78.
    1. Neves G. A chuva no estado de Goiás e Distrito Federal: Aspectos espaciais, temporais e dinâmicos. Rev. Bras. Climatol. 2019;8642:67–82.

Publication types