. 2020 Oct 5;10(1):16501.
doi: 10.1038/s41598-020-73552-9.

The immune receptor CD300e negatively regulates T cell activation by impairing the STAT1-dependent antigen presentation

Affiliations

The immune receptor CD300e negatively regulates T cell activation by impairing the STAT1-dependent antigen presentation

Sara Coletta et al. Sci Rep. .

Abstract

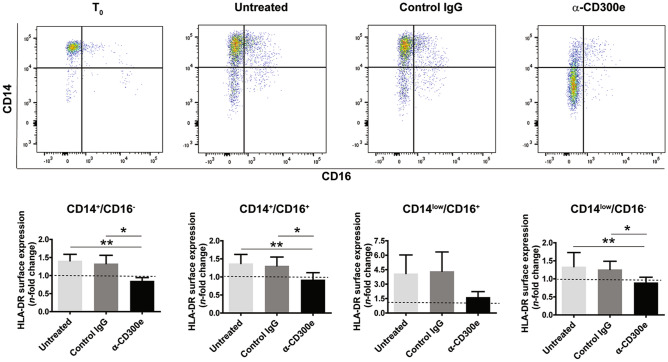
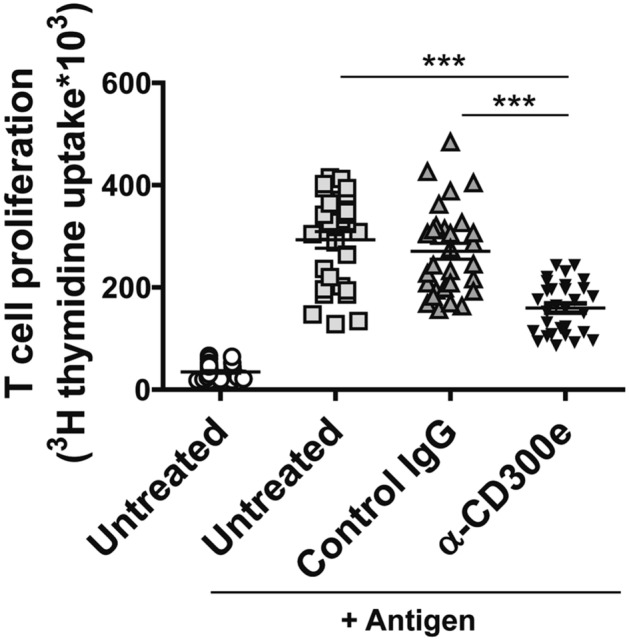
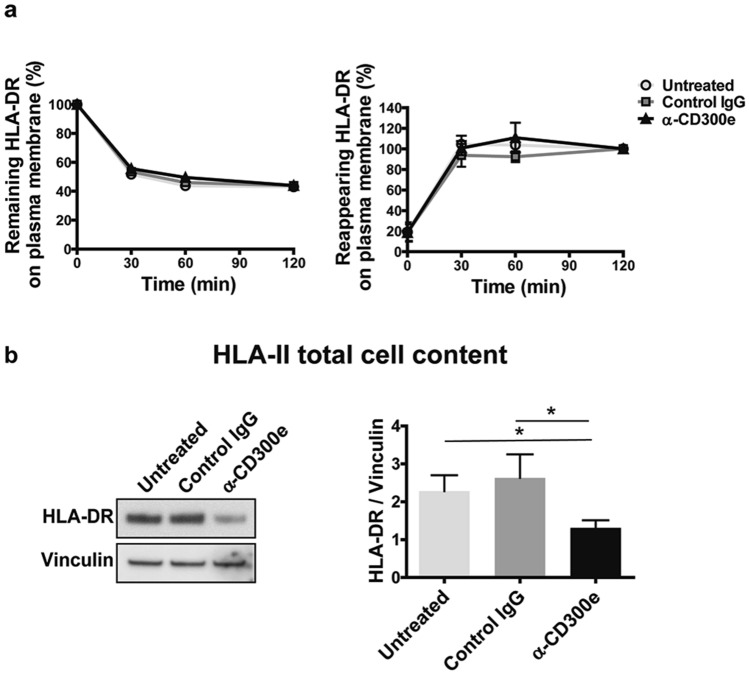
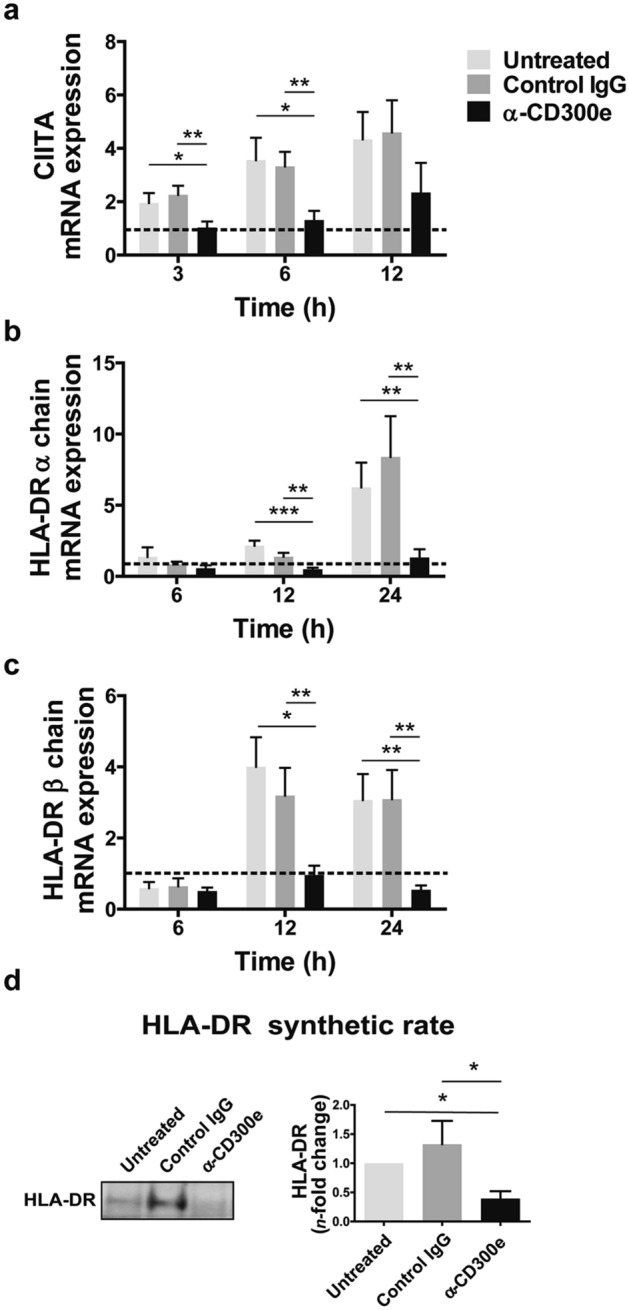
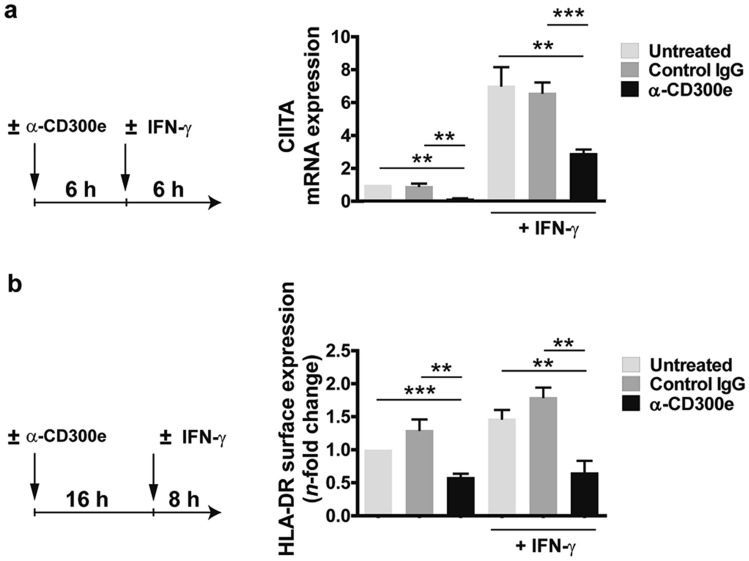
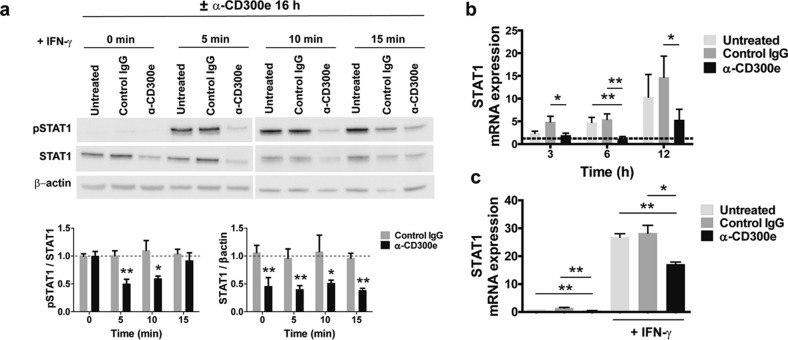
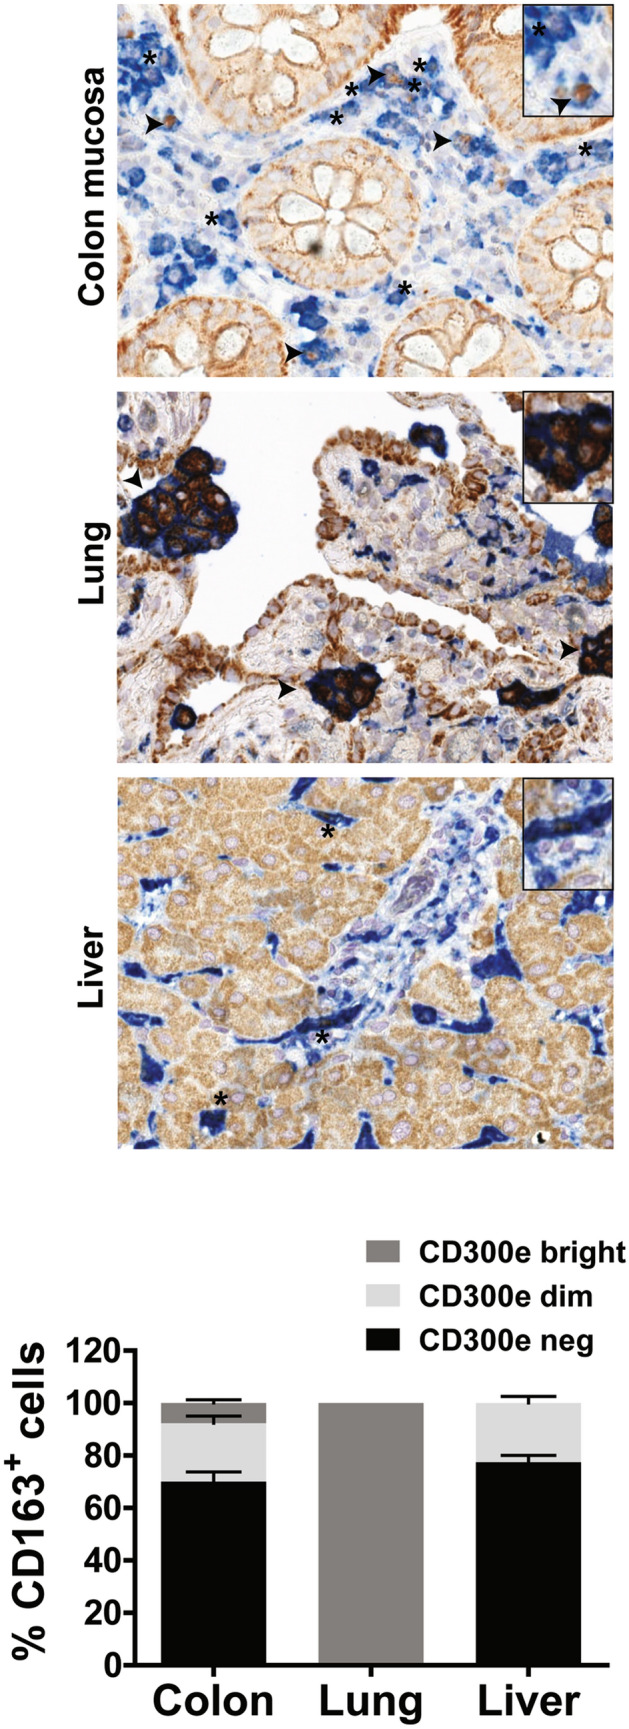
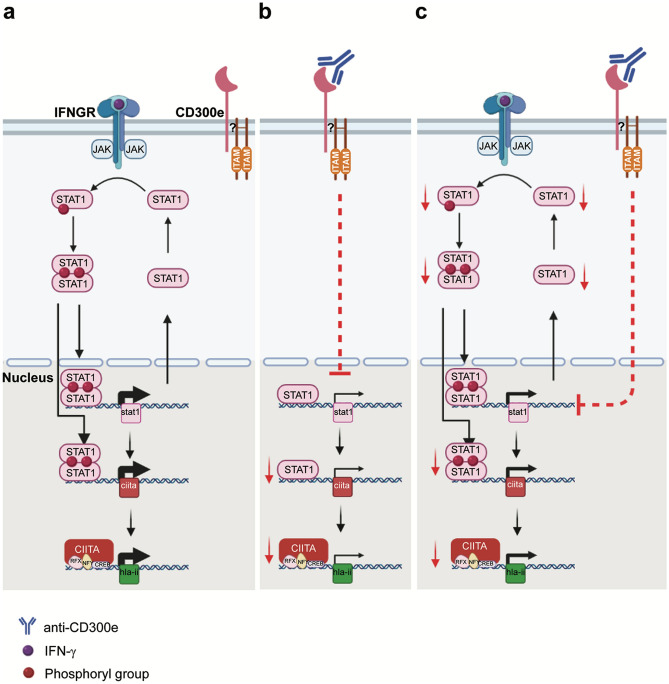
CD300e is a surface receptor, expressed by myeloid cells, involved in the tuning of immune responses. CD300e engagement was reported to provide the cells with survival signals, to trigger the expression of activation markers and the release of pro-inflammatory cytokines. Hence, CD300e is considered an immune activating receptor. In this study, we demonstrate that the ligation of CD300e in monocytes hampers the expression of the human leukocyte antigen (HLA) class II, affecting its synthesis. This effect, which is associated with the transcription impairment of the signal transducer and activator of transcription 1 (STAT1), overcomes the capacity of interferon gamma (IFN-γ) to promote the expression of the antigen-presenting molecules. Importantly, the decreased expression of HLA-II on the surface of CD300e-activated monocytes negatively impacts their capacity to activate T cells in an antigen-specific manner. Notably, unlike in vitro- differentiated macrophages which do not express CD300e, the immune receptor is expressed by tissue macrophages. Taken together, our findings argue against the possibility that this molecule should be considered an activating immune receptor sensu stricto. Moreover, our results support the notion that CD300e might be a new player in the regulation of the expansion of T cell-mediated responses.


Conflict of interest statement

The authors declare no competing interests.

Figures

Figure 1
Figure 1
Activation through CD300e reduces the expression of HLA-DR in all monocyte subsets. Freshly isolated monocytes were plated on 24-well plates uncoated, coated with isotypic IgG (control IgG) or with anti-CD300e monoclonal IgG (UP-H2). At time 0 and after 24 h cells were labelled with anti-CD14, anti-CD16 and anti-HLA-DR antibodies. The expression level of CD14 and CD16 was used to identify 4 cell subsets, namely CD14+CD16, CD14+CD16+, CD14lowCD16+ and CD14lowCD16. Upper panels: representative cytograms. Lower panels: median fluorescence intensity (MFI) of HLA-DR ± SEM of 4 independent experiments was calculated for each subset. Expression levels of HLA-DR are expressed as n-fold change relative to time 0 (T0) set as 1 (dotted line). Significance was determined by Student’s t-test. *p ≤ 0.05; **p ≤ 0.01.
Figure 2
Figure 2
Activation through CD300e compromises the ability of monocytes to activate antigen-specific T cells. Monocytes isolated from 10 patients with melanoma were seeded in triplicate as above on uncoated plates or on plates coated with isotype IgG or anti-CD300e. After 24 h, cells were harvested and co-cultured with CD4+ T lymphocytes purified from the same patients in presence of specific melanoma antigen (MAGE-A3). Lymphocyte proliferation was measured by 3[H]-TdR incorporation. Data are shown as mean ± SEM of 10 independent experiments. Significance was determined by Student’s t-test. ***p ≤ 0.001.
Figure 3
Figure 3
Activation through CD300e does not interfere with the intracellular trafficking of HLA-DR. (a) Kinetic of internalization and recycling of HLA-DR in monocytes. The amount of HLA-DR remaining or recycling back to the cell surface in untreated monocytes and in monocytes exposed to control IgG or anti-CD300e was determined by flow cytometry. For each sample, MFI values are expressed as percentage relative to T0 or to time 120 min (set as 100%). Data are shown as mean ± SEM of 5 independent experiments. (b) HLA-DR total cell content evaluated by western blot in monocytes seeded on uncoated, coated with isotypic IgG or with anti-CD300e for 24 h. Blot refers to a representative of 4 independent experiments. Quantification of HLA-DR was performed by densitometry and normalized to vinculin (mean ± SEM). Significance was determined by Student’s t-test. *p ≤ 0.05.
Figure 4
Figure 4
Activation through CD300e affects the synthesis of HLA-II in monocytes. (ac) mRNA expression of CIITA, HLA-DR α and β chains in monocytes activated or non-activated through anti-CD300e. Monocytes were plated on 24-well plates uncoated, coated with isotype IgG (control IgG) or with anti-CD300e. At the indicated time points, cells were processed for mRNA extraction. mRNA expression was determined by qRT-PCR and data were normalized to an endogenous reference gene (β-actin). Expression levels of treated cells are relative to values at T0 set as 1 (dotted line). Data are shown as mean ± SEM of 4 independent experiments. (d) HLA-DR synthetic rate in CD300e-activated or non-activated monocytes. Monocytes were plated on 24-well plates uncoated, coated with isotype IgG (control IgG) or with anti-CD300e. After 24 h, cells were processed as detailed in Methods section. Blot refers to a representative of 3 independent experiments. Quantification of HLA-DR was performed by densitometry and expressed as amount relative to untreated cells set as 1 (mean ± SEM). Significance was determined by Student’s t-test. *p ≤ 0.05; **p ≤ 0.01; ***p ≤ 0.001.
Figure 5
Figure 5
Engagement of CD300e dampens the IFN-γ-induced CIITA and HLA-DR expression. (a) mRNA expression of CIITA in monocytes activated or not by anti-CD300e for 6 h and then stimulated for further 6 h with 10 ng/ml IFN-γ. Cells were processed for mRNA extraction. mRNA expression was determined by qRT-PCR and data were normalized to β-actin. Expression levels of treated cells are relative to untreated cells set as 1. Data are shown as mean ± SEM of 4 independent experiments. (b) Surface expression of HLA-DR protein in monocytes activated by anti-CD300e for 16 h and then stimulated for further 8 h with 10 ng/ml IFN-γ. Cell surface level of HLA-DR was evaluated by flow cytometry. MFI of HLA-DR ± SEM of 4 independent experiments was calculated and expressed as n-fold change relative to untreated cells set as 1. Left panels in (a) and (b) describe the experimental setup. Significance was determined by Student’s t-test. **p ≤ 0.01; ***p ≤ 0.001.
Figure 6
Figure 6
Activation through CD300e impairs STAT1 expression. (a) STAT1 and pSTAT1 cell content in monocytes activated or not by anti-CD300e for 16 and then stimulated with 10 ng/ml IFN-γ for 5, 10 or 15 min. Blot refers to a representative of 4 independent experiments. Quantification was performed by densitometry. Data referred to pSTAT1 are expressed as ratio on STAT1; data referred to STAT1 are expressed as ratio of STAT1/β-actin (mean ± SEM). Expression levels of treated cells are relative to values of untreated cells set as 1 (dotted line) for each time point. Significance was determined by Student’s t-test vs untreated cells *p ≤ 0.05; **p ≤ 0.01. (b) mRNA expression of STAT1 in monocytes activated or non-activated by anti-CD300e. At the indicated time points, cells were processed for mRNA extraction. mRNA expression was determined by qRT-PCR. Data were normalized to β-actin. Expression levels of treated cells are relative to values of T0 cells set as 1 (dotted line). Data are shown as mean ± SEM of 4 independent experiment. (c) mRNA expression of STAT1 in monocytes activated or not by anti-CD300e for 6 h and then stimulated or not for further 6 h with 10 ng/ml IFN-γ. Cells were processed for mRNA extraction. mRNA expression was determined by qRT-PCR and data were normalized to β-actin. Expression levels of treated cells are relative to untreated cells set as 1. Data are shown as mean ± SEM of 4 independent experiments. Significance was determined by Student’s t-test. *p ≤ 0.05; **p ≤ 0.01.
Figure 7
Figure 7
Expression of CD300e in tissue macrophages. Immunohistochemical staining for CD300e (brown) and CD163 (blue) was performed on sections of normal colon mucosa, lung and liver. Arrows highlight macrophages which strongly express CD300e, while asterisks highlight weakly expressing macrophages. The percentage of CD163+ macrophages, CD300ebright, CD300edim or not expressing CD300e, in 3 patients for colon mucosa and liver and in 4 patients for lung was calculated and expressed in the bottom plot as mean ± SEM. Original magnification 400× , inset magnification 600 × .
Figure 8
Figure 8
CD300e working model. (a) The binding of IFN-γ to the interferon-gamma-receptor (IFNGR) leads to the dimerization of the receptor, activation of JAK1 and JAK2, recruitment and phosphorylation of STAT1. Following dimerization, phosphorylated STAT1 enters the nucleus and transcribes target genes, including STAT1 and CIITA, the master control regulator of HLA-II expression. (b) The engagement of CD300e in monocytes thwarts the basal expression of STAT1. Therefore, the unphosphorylated STAT1-dependent expression of CIITA is hampered, and in turn that of HLA-II. (c) The activation through CD300e, even under IFN-γ induction, keeps low the transcription of STAT1 gene, thus lowering the amount of STAT1 available for activation by phosphorylation. This, in turn, results in an impairment of CIITA and HLA-II synthesis. RFX, NFY and CREB are part of the heteromultimeric scaffold required for CIITA transcriptional activity.

References

    1. Borrego F. The CD300 molecules: an emerging family of regulators of the immune system. Blood. 2013;121:1951–1960. doi: 10.1182/blood-2012-09-435057. - DOI - PMC - PubMed
    1. Brckalo T, et al. Functional analysis of the CD300e receptor in human monocytes and myeloid dendritic cells. Eur. J. Immunol. 2010;40:722–732. doi: 10.1002/eji.200939468. - DOI - PubMed
    1. Aguilar H, et al. Molecular characterization of a novel immune receptor restricted to the monocytic lineage. J. Immunol. 2004;173:6703–6711. doi: 10.4049/jimmunol.173.11.6703. - DOI - PubMed
    1. Isobe M, et al. The CD300e molecule in mice is an immune-activating receptor. J. Biol. Chem. 2018;293:3793–3805. doi: 10.1074/jbc.RA117.000696. - DOI - PMC - PubMed
    1. Zenarruzabeitia O, et al. The expression and function of human CD300 receptors on blood circulating mononuclear cells are distinct in neonates and adults OPEN. Nat. Publish. Group. 2016 doi: 10.1038/srep32693. - DOI - PMC - PubMed

Publication types