. 2020 Oct 5;10(1):16505.
doi: 10.1038/s41598-020-73585-0.

Differential reperfusion patterns in retinal vascular plexuses following increase in intraocular pressure an OCT angiography study

Affiliations

Differential reperfusion patterns in retinal vascular plexuses following increase in intraocular pressure an OCT angiography study

Chui Ming Gemmy Cheung et al. Sci Rep. .

Abstract

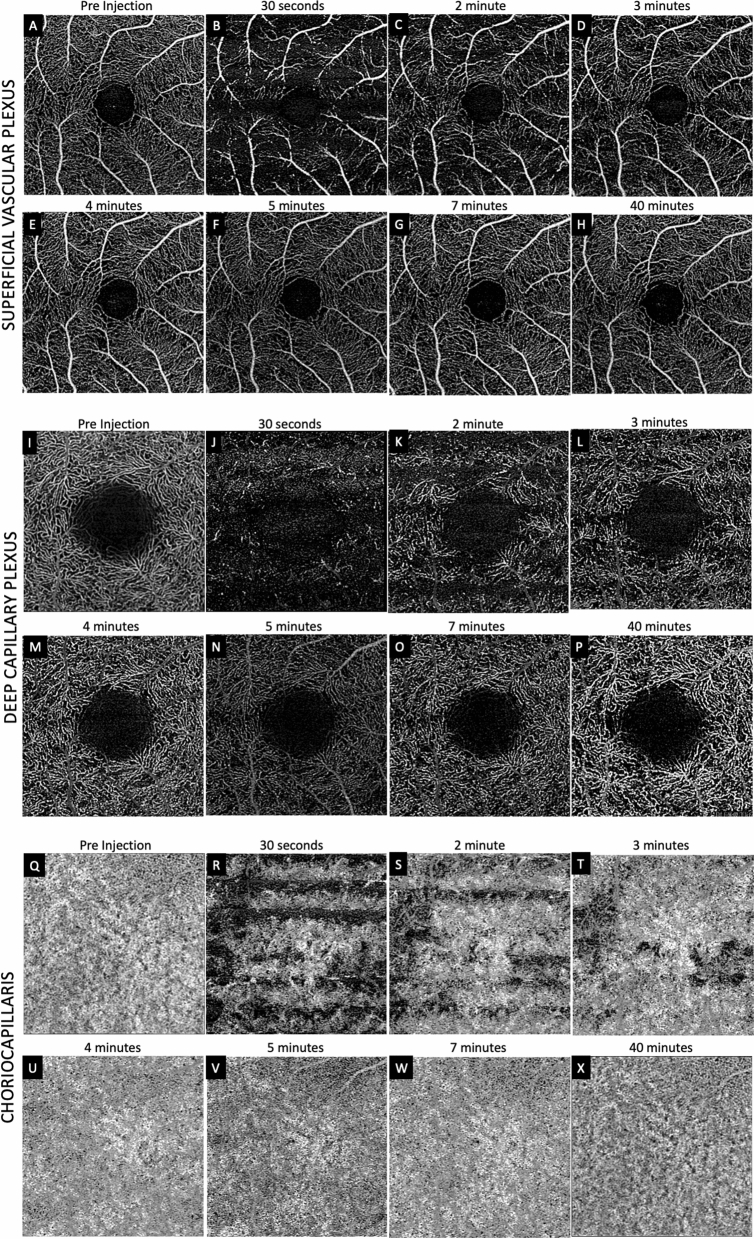
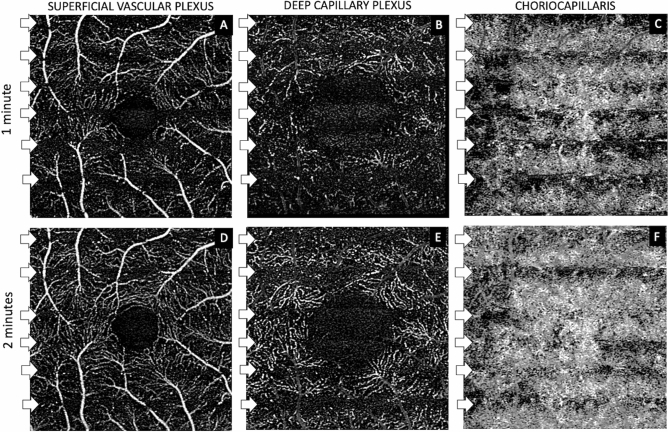
To describe patterns of reperfusion in the superficial vascular plexus (SVP), deep capillary plexus (DCP) and choriocapillaris (CC) as detected on optical coherence tomography (OCTA) in cynomogulus macaque monkey model following increase in intraocular pressure by an intravitreal injection. Animal imaging study. Two cynomogulus macaque monkeys. A 100 µL intravitreal injection (IVI) of saline was given in one eye of each monkey. Serial OCTA using a Zeiss Plex Elite 9000 was used to evaluate reperfusion patterns within the SCP, DCP, and CC. OCTA evidence of perfusion. Pulsation of the central retinal artery was detected after the intraocular pressure was elevated to 98 and ≥ 99 mmHg from IVI. Episodic flow within the SVP arterioles and venules and poor visualization of flow in capillaries was noted during the initial phase of elevated pressure. As the pressure declined, the flow signal within the DCP appeared initially as dots, which progressed laterally to loops which form capillary vortex configuration. Recovery of flow within the SVP and CC appeared sooner than in the DCP. At 40 min after the injection, well after the intraocular pressure normalized, the retinal and choriocapillaris vascular perfusion showed focal defects in every layer. Compared with pre-injection images, vessel density in the DCP was 68.8% and 78.6% of baseline in monkey 1 and monkey 2, respectively. In contrast vessel density in the SVP recovered to 84.2% and 88.9% of baseline. Increases in intraocular pressure from IVI have the potential to affect every layer of blood flow in the fundus. After nominal return of intraocular pressure, focal defects in flow persisted, which may result in longer term damage to the retina.


Conflict of interest statement

The authors declare no competing interests.

Figures

Figure 1
Figure 1
Sequential optical coherence tomography angiography (OCTA) Monkey 1. (A–H) shows superficial vascular plexus (SVP), deep capillary plexus (DCP) and choriocapillaris (CC) layers. Panel (A), (I) and (Q) show pre-injection OCTA of SVP, DCP and CC respectively. At 30 s post injection, when intra ocular pressure (IOP) was 98 mmHg, flow was only noted in main arterioles and veins with minimal detection of flow signal within the capillary beds in the SVP (B). At the same time, there was marked reduction in flow signal in the DCP (J) and in the CC (R). Dark horizontal bands are observed in all three layers. Progressively more flow signal was noted over time in the SVP (CG), DCP (KO) and CC (SW). By 7 min, when IOP was 22 mmHg. As flow signal increased in the DCP, recognizable capillary units arranged around an epicenter could be appreciated (LO), despite persistence of patchy areas of flow deficit. In the CC, areas of flow deficit progressively decreased (RU). By 40 min (H, P and X) the flow distribution in the SVP and CC resembled the respective pre-injection images, but flow deficits in the DCP were more evident when compared to the pre injection image.
Figure 2
Figure 2
Stripe dark band patterns across OCTA scans at 1-min and 2-min post-intravitreal injection. Evenly distributed horizontal stripe patterns (white arrows) across each OCTA scan at the superficial vascular plexus (SVP) (A, D), deep capillary plexus (DCP) (B, E) and choriocapillaris (CC) layers (C, F) was detected. These bands represent episodic flow signal as the intra ocular pressure (IOP) dropped below the instantaneous pressure in the arteries and veins. These 6–7 bands persisted for about 2–3 min post injection and if timed according to the duration of scan (approximately 3 s) would imply a heart rate of approximately 120 beats per minute, which was in agreement with the anesthesia record (101–128 beats per minute). These bands were more prominent and persistent in the DCP (B, E) than in the SVP (A, D) suggesting a lower perfusion pressure in the DCP.
Figure 3
Figure 3
Averaged OCTA images of pre- and 40-min post-injection of each retina layer of Monkey 1. Panel (A), (C) and (E) showed the OCTA images of the superficial vascular plexus (SVP), deep capillary plexus (DCP) and choriocapillaris (CC) layers pre injection and the corresponding 40-min post-injection images (B, D, F). In the SVP, the 40-min post injection image (B) is very similar to the pre-injection image (A) with only subtle and minimal areas of flow deficit compared to pre-injection. In the CC layer, the 40-min post-injection image was also similar to the pre-injection image (E, F) suggesting almost complete recovery of perfusion. The DCP however, showed persistent areas of reduction in flow in the 40-min post injection image (D) compared to pre-injection (C).
Figure 4
Figure 4
Sequential optical coherence tomography angiography (OCTA) Monkey 2. (AH) shows superficial vascular plexus (SVP), deep capillary plexus (DCP) and choriocapillaris (CC) layers. Panel (A), (I) and (Q) shows pre injections OCTA of SVP, DCP and CC respectively. Intra ocular pressure (IOP) was 99 mmHg at 30 s which dropped to 14 mmHg at 7 min. The progression of flow throughout the layers were similar to Monkey 1, but the delay in reperfusion was more marked in Monkey 2. At 30 s, minimal to no flow was detected within the capillary beds and none in the venules in the SVP (B) as compared to Monkey 1 at the same time point. This difference was even more evident when comparing the DCP between animals where recognizable capillary units were only detected after 3–4 min post-injection (M, N, O). There were more evident areas of persistent flow deficits in the CC at 40-min post-injection (X) as compared to Monkey 1. Defects in perfusion was also most apparent in the DCP (P) compared to the SVP (H) and CC at 40 min.

References

    1. Grzybowski A, et al. 2018 Update on intravitreal injections: Euretina expert consensus recommendations. Ophthalmologica. 2018;239:181–193. doi: 10.1159/000486145. - DOI - PubMed
    1. Falavarjani KG, Nguyen QD. Adverse events and complications associated with intravitreal injection of anti-VEGF agents: A review of literature. Eye (Lond.) 2013;27:787–794. doi: 10.1038/eye.2013.107. - DOI - PMC - PubMed
    1. Gomez-Mariscal M, Munoz-Negrete FJ, Rebolleda G. Letter: Effects of intravitreal anti-VEGF therapy on glaucoma-like progression in susceptible eyes. J. Glaucoma. 2020 doi: 10.1097/IJG.0000000000001499. - DOI - PubMed
    1. Spaide RF, Klancnik JM, Jr, Cooney MJ. Retinal vascular layers imaged by fluorescein angiography and optical coherence tomography angiography. JAMA Ophthalmol. 2015;133:45–50. doi: 10.1001/jamaophthalmol.2014.3616. - DOI - PubMed
    1. Weinhaus RS, Burke JM, Delori FC, Snodderly DM. Comparison of fluorescein angiography with microvascular anatomy of macaque retinas. Exp. Eye Res. 1995;61:1–16. doi: 10.1016/s0014-4835(95)80053-0. - DOI - PubMed

Publication types