Observational Study
. 2020 Dec;26(12):1878-1887.
doi: 10.1038/s41591-020-1061-7. Epub 2020 Oct 5.

Characteristics of anti-CD19 CAR T cell infusion products associated with efficacy and toxicity in patients with large B cell lymphomas

Affiliations
Observational Study

Characteristics of anti-CD19 CAR T cell infusion products associated with efficacy and toxicity in patients with large B cell lymphomas

Qing Deng et al. Nat Med. 2020 Dec.

Abstract

Autologous chimeric antigen receptor (CAR) T cell therapies targeting CD19 have high efficacy in large B cell lymphomas (LBCLs), but long-term remissions are observed in less than half of patients, and treatment-associated adverse events, such as immune effector cell-associated neurotoxicity syndrome (ICANS), are a clinical challenge. We performed single-cell RNA sequencing with capture-based cell identification on autologous axicabtagene ciloleucel (axi-cel) anti-CD19 CAR T cell infusion products to identify transcriptomic features associated with efficacy and toxicity in 24 patients with LBCL. Patients who achieved a complete response by positron emission tomography/computed tomography at their 3-month follow-up had three-fold higher frequencies of CD8 T cells expressing memory signatures than patients with partial response or progressive disease. Molecular response measured by cell-free DNA sequencing at day 7 after infusion was significantly associated with clinical response (P = 0.008), and a signature of CD8 T cell exhaustion was associated (q = 2.8 × 10-149) with a poor molecular response. Furthermore, a rare cell population with monocyte-like transcriptional features was associated (P = 0.0002) with high-grade ICANS. Our results suggest that heterogeneity in the cellular and molecular features of CAR T cell infusion products contributes to variation in efficacy and toxicity after axi-cel therapy in LBCL, and that day 7 molecular response might serve as an early predictor of CAR T cell efficacy.


Figures
Extended Data 1:
Extended Data 1:
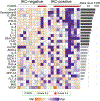
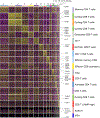
Heatmap showing the top 50 signature genes of each cluster and putative assignments to cell types according to canonical marker genes.
Extended Data 2:
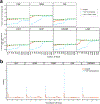
Extended Data 2:. Increased sequencing saturation and marker gene detection rate by CapID.
a) Sub-sampling of reads from a single CAR T infusion product with 600 million reads for whole transcriptome and 20 million reads for CapID, showing the saturation (flattening of curve) for CapID (orange) at ~10 million reads, for 10X whole transcriptome sequencing (blue) at ~400M reads, and the effect of supplementing whole transcriptome data with 10 million reads of CapID data (green). b) Density plots from the entire dataset show the reduced number of cells with UMI counts of zero and increased signal-to-noise ratio for CapID sequencing compared to 10X whole transcriptome sequencing. The 10X whole transcriptome sequencing in this study were performed to an average of 73,521 reads per cell, vastly exceeding the minimum of 20,000 reads per cell recommended by 10X.
Extended Data 3:
Extended Data 3:. Correlation of cell frequencies measured by scRNA-seq and flow cytometry.
Correlations are shown for 16 patients that had sufficient cells for flow cytometry (a), compared to the fractions measured using traditional 10X data (b) or CapID+ (c). All comparisons showed a significant correlation with Pearson’s correlation 2-tailed P-value < 0.001.
Extended Data 4:
Extended Data 4:. Volcano plots of differentially expressed genes between CAR-positive and CAR-negative CD8 and CD4 T-cells.
Q-values were calculated with a two-sided Wilcoxon rank sum test with Bonferonni correction.
Extended Data 5:
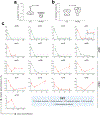
Extended Data 5:. Variant allele fractions of somatic variants detected by cfDNA sequencing.
a-b) Comparison of the average VAF of mutations at day 0 (a) and the number of calibrated mutations (b) between clinical response groups. P values were calculated by a two-sided Student’s t-test. c) Raw variant allele frequencies for each patient are shown for >5FMR (above) and <5FMR (below) groups. Lines are colored by clinical response as in figure 4a. The grey dashed line represents the 5-fold reduction threshold for each patient.
Extended Data 6:
Extended Data 6:. T-cell clonotypic diversity in patients grouped by clinical and molecular response.
a) The frequency of the top 10 clonotypes for each patient among all cells (above), CD4 T-cells (middle) and CD8 T-cells (below). Box, median +/− interquartile range. Whiskers, minimum and maximum. P-values calculated by a two-sided Wilcoxon rank sum test with Benjamini-Hochberg correction. b) Shannon’s clonality score for patients grouped by clinical or molecular response, shown for all cells (above), CD4 T-cells (middle) and CD8 T-cells (below). CR, n=9. PR/PD, n=14. >5FMR, n=8. <5FMR, n=9. Box, median +/− interquartile range. Whiskers, minimum and maximum. P-values calculated by a two-sided Wilcoxon rank sum test with Benjamini-Hochberg correction.
Extended Data 7:
Extended Data 7:. Analysis of association between molecular features of CAR T-cell infusion products and the development of high-grade cytokine release syndrome (CRS).
a) Comparison of functional states between patients with grade 0–2 and grade 3–4 identified reduced frequencies of exhausted CD8 T-cells and increased frequencies of exhausted CD4 T-cells to be associated with the development of high-grade CRS. Q-values were calculated by a two-sided Fisher exact test with a Benjamini-Hochberg correction. b-c) Heatmaps show differentially expressed genes between CD4 T-cells (b) and CD8 T-cells. (c) from the infusion products of patients with grade 0–2 CRS versus those that developed grade 3–4 CRS. The CD69 gene shows higher expression and the CCL3 and CLL4 genes show lower expression on both CD4 and CD8 T-cells from the CAR T-cell infusion products of patients that developed high grade CRS. All differentially expressed genes are shown in Supplementary Tables 10 and 11.
Extended Data 8:
Extended Data 8:. Percentage of CAR-positive cells in patients with grade 0–2 vs grade 3–4 ICANS.
Grade 0–2 ICANS, n=22. Grade 3–4 ICANS, n=18. Box, median +/− interquartile range. Whiskers, minimum and maximum. P-values calculated by a two-sided Wilcoxon rank-sum test.
Extended Data 9:
Extended Data 9:. Cytokine levels in serum between patients with IACs and those without IACs.
Significance level was tested with Mann-Whitney U test. FDR q-value was calculated for multiple testing correction.
Extended Data 10:
Extended Data 10:. Quantification of the ICANS-associated cells (IACs) signature by scGSVA in CAR T-cell infusion products.
a) A stringent threshold was set to ensure high confidence classification of IACs by scGSVA analysis of the 109 signature genes measured by CapID, as shown for the cells that were originally identified as IACs by unsupervised clustering of 10X whole-transcriptome data in figure 4a. b) The distribution of scGSVA scores shows a clear difference between infusion products from patients with grade 0–2 ICANS vs patients with grade 3–4 ICANS. The threshold for classification of cells as IACs (scGSVA score >1.5) is shown.
Figure 1:
Figure 1:. Single cell analysis of standard of care (SOC) CAR T-cell infusion products.
A schematic overview of the experimental design and bioinformatics flow for scRNA-seq analysis of 137,276 residual cells from CAR T-cell infusion products of 24 LBCL patients. Our approach incorporated single cell transcriptome profiling of CAR T-cell infusion products boosted by CapID+, correlation of single cell functional states and gene expression signatures with efficacy assessed by positron emission tomography/computed tomography (PET/CT) and by cfDNA sequencing, and with toxicity assessed by clinical grading.
Figure 2:
Figure 2:. Single cell analysis of standard of care (SOC) CAR T-cell infusion products.
a) An overview of the 133,405 cells that passed quality control (QC) for subsequent analyses in this study. Cells are color coded by the corresponding patient origin (sample ID) in the tSNE plot and a bar graph showing the number of cells per patient that passed QC. b) Cells are color coded by tSNE cluster number and a bar graph showing the distribution of cells from each patient among clusters. c) Individually scaled density plots show the normalized expression for the CAR, CD4 and CD8B transcripts in 10X scRNA-seq data and CapID hybrid capture sequencing data derived from the same scRNAseq libraries. Histogram overlays with identical scaling showing the relative fraction of cells with zero counts are shown in Extended Data 2b. d) The tSNE overview and bar graph summary of the cells identified as being CAR-positive (left), CD4 T-cells (middle) and CD8 T-cells (right) using 10X scRNA-seq data and those rescued by CapID+.
Figure 3:
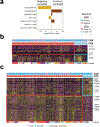
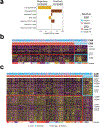
Figure 3:. Molecular phenotypes of CAR T-cell infusion products associated with response determined by PET/CT.
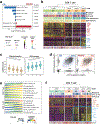
a) Cell types and functional states that were significantly more frequent in CAR T-cell products from patients with continued CR at 3 months (blue) or those from patients with PR/PD (red). Q-values were calculated by a two-sided Fisher exact test with a Benjamini-Hochberg correction. b) Heatmap of four CD8+ T cell clusters (C1-C4) generated from unsupervised clustering of genes that were differentially expressed in CD8 T-cells from the infusion products of patients with CR compared to those from patients with PR/PD. A color-coded track shows the cells that originated from infusion products of CR patients (blue: CR) and the percentage of these cells within each cluster labelled at the top. Additional tracks show the scGSVA scores of CD8 dysfunction and CD8 memory signatures, respectively, and the inferred cell cycle status. The percentage of cells that originated from infusion products of CR patients is significantly different between clusters (One-way ANOVA p < 2.2×10⁻¹⁶). The corresponding sample origins are labeled at the bottom, colored as per Figure 2a. c) Violin plots show the scGSVA scores of cells from each the four clusters in 2b. C1, n=26,917 cells. C2, n=9,047 cells. C3, n=10,113 cells. C4, n=6,440 cells. Box, median +/− interquartile range. Whiskers, 1.5X interquartile range. Pairwise comparisons were performed using a two-sided Wilcoxon rank-sum test with a Benjamini-Hochberg correction. d) Scatter plots of CCR7+CD27+ CD8 T-cells measured by CapID in the infusion products of patients who achieved CR compared to those who had PR/PD (Two-sided Fisher exact test p<2.2× 10⁻¹⁶). e) Gene sets that are significantly positively (+) or negatively (−) associated with CR in CD8 (above) or CD4 (below) T-cells. For each pathway, a heatmap of the single cell GSVA scores are shown, with % of cells originated from infusion products of CR patients annotated on the top. The origin of the gene set is shown in brackets (B, biocarta; R, reactome; K, KEGG; P, PID). f) A heatmap of five CD4+ T cell clusters (C1-C5) determined by unsupervised clustering of genes that were differentially expressed in CD4 T-cells from infusion products of patients with CR compared to those from patients with PR/PD. The percentage of cells that originated from infusion products of CR patients is shown in a track at the top and is significantly different between clusters (One-way ANOVA p < 2.2×10⁻¹⁶). Cells are annotated by inferred cell cycle state and sample origin as in panel b.
Figure 4:
Figure 4:. Association between early molecular response measured by cfDNA sequencing and clinical response measured by PET/CT.
a) Molecular response measured by deep targeted cfDNA sequencing over the first month following infusion. Variant allele fraction (VAF) for each patient (n = 17) are normalized to the infusion day time point (day 0) and lines are colored according to response assessed by PET/CT at their 3-month follow-up or prior disease progression. b) Fold change in molecular disease burden at the day 7 time point relative the day 0 time point is shown for each patient, with bars colored by clinical response determined by PET/CT at their 3 month follow-up. The fold reduction of molecular disease burden was significantly associated with clinical response at 3 months (two-sided Wilcoxon rank-sum P = 0.008). The 16 patients with evaluable response were split into two groups according to whether they achieved >5-fold molecular response (>5FMR) or had <5-fold molecular response (<5FMR).
Figure 5:
Figure 5:. Association between CD8 T-cell exhaustion markers and early molecular response.
a) Cell types and functional states associated with >5-fold molecular response at day 7 (>5FMR, blue) or failure to achieve 5-fold molecular response at day 7 (<5FMR, red). Q-values were calculated by a two-sided Fisher exact test with a Benjamini-Hochberg correction. b) The percentage of cells expressing co-inhibitory molecules utilized in the classification of exhausted CD8 T-cells, and the percentage of cells co-expressing LAG3 and TIM3, is shown for cells from patients with >5FMR (turquoise) compared to those from patients with <5FMR (red). c) Scatter plots show the expression of LAG3 and TIM3 in cells from patients who achieved >5FMR (left, blue) compared to those from patients with <5FMR (right, red). Each point represents a single cell and the proportion of cells at each state is labelled on the plot. Expression levels are normalized UMI counts from CapID sequencing, with normalized UMI counts >2 defined as positive expression. d) The percentage of cells from each TCR clonotype (identified from single cell TCR sequencing) co-expressing LAG3 and TIM3 are shown and data are compared between clonotypes within infusion products of patients with >5FMR (above, blue) and those from patients with <5FMR (below, red). The size of each point indicates the clonal fraction of each clonotype within each infusion product. >5FMR; n=72 clonotypes from 8 patients. <5FMR; n=196 clonotypes from 9 patients. Boxes, median +/− the interquartile range; whiskers, 1.5x interquartile range. P value was calculated by two-sided Wilcoxon rank-sum test. e) Transcripts were measured in 38,601 cells from fresh core needle biopsies of 9 rrLBCL tumors by CapID; 5 patients progressing following chemo-immunotherapy or targeted therapy (CAR T naïve) and 4 patients progressing following axi-cel CAR T-cell therapy (post-CAR T). The expression of TIM3 and LAG3 was quantified by CapID within CD8 T-cells in CAR T naïve and post-CAR T tumors, and within CD8 T-cells expressing the CAR transcript in post-CAR T tumors. The fraction of single- and double-positive cells annotated.
Figure 6:
Figure 6:. ICANS-associated cells in CD19 CAR T-cell infusion products.
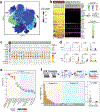
a) Clusters are shown for 10X transcriptome data of 24 patients in a tSNE plot, colored by the significance of their association with ICANS. The significant cluster of ICANs-associated cells (IACs) is circled. P-values were calculated using a two-sided Wilcoxon rank-sum test. b) Genes that are most highly expressed in cells from the IACs cluster compared to cells from other clusters are shown in a heatmap. Expression of additional T-cell markers, T-cell receptor (TCR) gene rearrangements and the CAR transcript are shown in tracks at the top. c) The expression of representative IACs markers, T-cell markers and canonical monocyte markers are shown for each cluster. The size of bubbles is relative to the percentage of cells within a cluster that express a given gene, and the color is relative to the mean expression of a given gene within each cluster. d) Density plots show the cellular distribution of transcript abundance of IACs marker genes in cells from the IAC cluster compared to cells from other clusters, determined by 10X transcriptome data. e) Single sample gene set enrichment (ssGSEA) values are shown for the IACs signature genes within gene expression data from purified populations of normal hematopoietic cell subsets, with increasing scores representing higher expression of the gene set. Myeloid lineage subsets [left, peach] have a significantly higher expression of genes that are characteristic of the IACs cluster compared to lymphoid lineage cells (Two-sided Wilcoxon rank-sum test, p<2.2×10⁻¹⁶). The highest expression of the IACs signature genes observed in monocytes. N=6 for all cell types except for basophils (n=4), myeloid DCs (n=5), non-classical monocytes (n=5), and memory CD8 T-cells (n=5). Boxes, median +/− the interquartile range; whiskers, 1.5x interquartile range. f) The cellular proportion of IACs determined by measurement of signature genes by CapID the infusion products of 269,164 single cells from 40 patients’ CAR T-cell infusion products (24 patient discovery cohort, 16 patient validation cohort [bold sample ID]) is shown. The samples are grouped according to patients with grade 3–4 ICANS (n=18, orange) compared to grade 0–2 ICANS (n=22, blue). Box, median +/− interquartile range. Whiskers, 1.5x interquartile range. P value was calculated by a two-sided Wilcoxon rank-sum test.

Comment in

References

    1. Locke FL et al.Long-term safety and activity of axicabtagene ciloleucel in refractory large B-cell lymphoma (ZUMA-1): a single-arm, multicentre, phase 1–2 trial. Lancet Oncol 20, 31–42, doi:10.1016/S1470-2045(18)30864-7 (2019). - DOI - PMC - PubMed
    1. Schuster SJ et al.Tisagenlecleucel in Adult Relapsed or Refractory Diffuse Large B-Cell Lymphoma. The New England journal of medicine 380, 45–56, doi:10.1056/NEJMoa1804980 (2019). - DOI - PubMed
    1. Shah NN & Fry TJ Mechanisms of resistance to CAR T cell therapy. Nature reviews. Clinical oncology 16, 372–385, doi:10.1038/s41571-019-0184-6 (2019). - DOI - PMC - PubMed
    1. Neelapu SS et al.Axicabtagene Ciloleucel CAR T-Cell Therapy in Refractory Large B-Cell Lymphoma. The New England journal of medicine 377, 2531–2544, doi:10.1056/NEJMoa1707447 (2017). - DOI - PMC - PubMed
    1. Mueller KT et al.Clinical Pharmacology of Tisagenlecleucel in B-cell Acute Lymphoblastic Leukemia. Clinical cancer research : an official journal of the American Association for Cancer Research 24, 6175–6184, doi:10.1158/1078-0432.CCR-18-0758 (2018). - DOI - PMC - PubMed

Methods-only References

    1. Fraietta JA et al.Disruption of TET2 promotes the therapeutic efficacy of CD19-targeted T cells. Nature 558, 307–312, doi:10.1038/s41586-018-0178-z (2018). - DOI - PMC - PubMed
    1. Butler A, Hoffman P, Smibert P, Papalexi E & Satija R Integrating single-cell transcriptomic data across different conditions, technologies, and species. Nature biotechnology 36, 411–420, doi:10.1038/nbt.4096 (2018). - DOI - PMC - PubMed
    1. Savas P. et al.Single-cell profiling of breast cancer T cells reveals a tissue-resident memory subset associated with improved prognosis. Nat Med 24, 986–993, doi:10.1038/s41591-018-0078-7 (2018). - DOI - PubMed
    1. Kochenderfer JN et al.Construction and preclinical evaluation of an anti-CD19 chimeric antigen receptor. J Immunother 32, 689–702, doi:10.1097/CJI.0b013e3181ac6138 (2009). - DOI - PMC - PubMed
    1. Jerby-Arnon L. et al.A Cancer Cell Program Promotes T Cell Exclusion and Resistance to Checkpoint Blockade. Cell 175, 984–997e924, doi:10.1016/j.cell.2018.09.006 (2018). - DOI - PMC - PubMed

Publication types

MeSH terms

Substances