. 2020 Oct 6:9:e57395.
doi: 10.7554/eLife.57395.

Optical control of ERK and AKT signaling promotes axon regeneration and functional recovery of PNS and CNS in Drosophila

Affiliations

Optical control of ERK and AKT signaling promotes axon regeneration and functional recovery of PNS and CNS in Drosophila

Qin Wang et al. Elife. .

Abstract

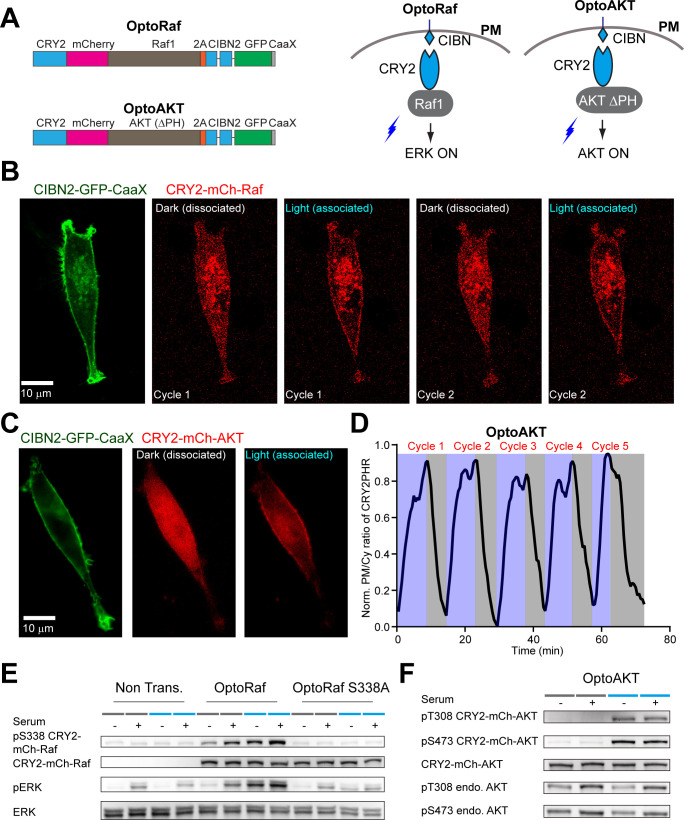
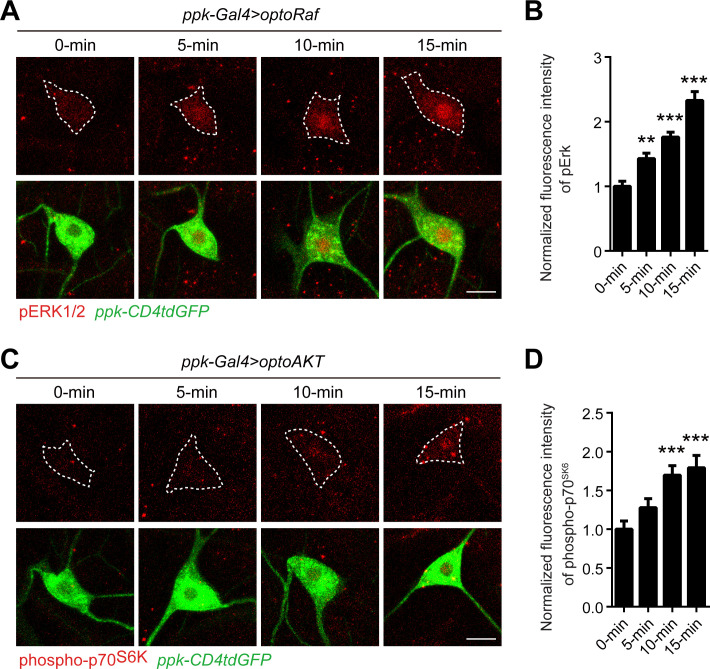
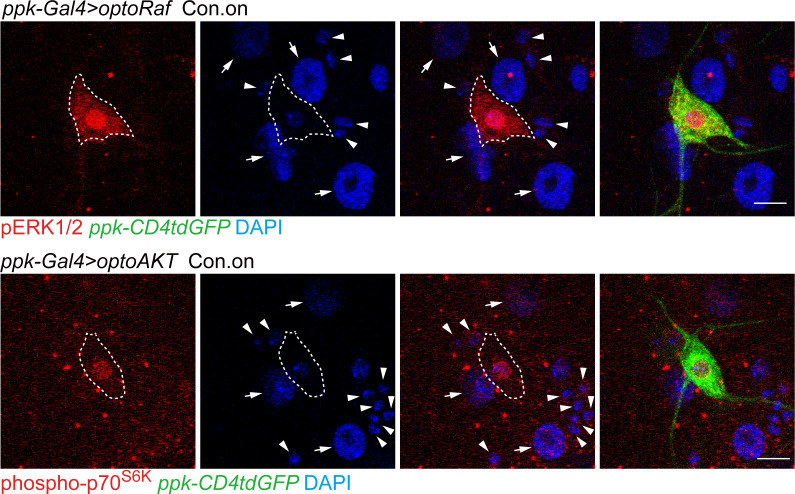
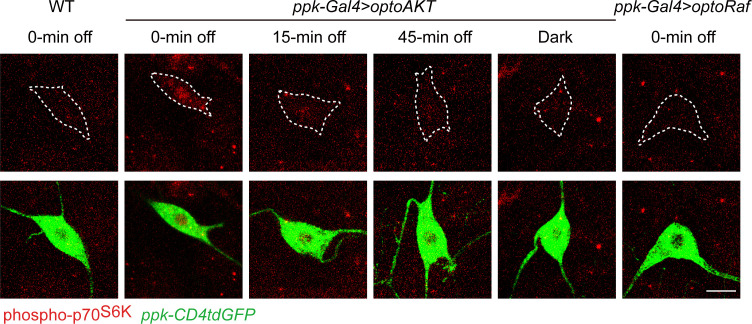
Neuroregeneration is a dynamic process synergizing the functional outcomes of multiple signaling circuits. Channelrhodopsin-based optogenetics shows the feasibility of stimulating neural repair but does not pin down specific signaling cascades. Here, we utilized optogenetic systems, optoRaf and optoAKT, to delineate the contribution of the ERK and AKT signaling pathways to neuroregeneration in live Drosophila larvae. We showed that optoRaf or optoAKT activation not only enhanced axon regeneration in both regeneration-competent and -incompetent sensory neurons in the peripheral nervous system but also allowed temporal tuning and proper guidance of axon regrowth. Furthermore, optoRaf and optoAKT differ in their signaling kinetics during regeneration, showing a gated versus graded response, respectively. Importantly in the central nervous system, their activation promotes axon regrowth and functional recovery of the thermonociceptive behavior. We conclude that non-neuronal optogenetics targets damaged neurons and signaling subcircuits, providing a novel strategy in the intervention of neural damage with improved precision.

Keywords: D. melanogaster; Drosophila; axon regeneration; dendritic arborization; neuroscience; optogenetics; sensory neurons; thermonociception.

Plain language summary

Most cells have a built-in regeneration signaling program that allows them to divide and repair. But, in the cells of the central nervous system, which are called neurons, this program is ineffective. This is why accidents and illnesses affecting the brain and spinal cord can cause permanent damage. Reactivating regeneration in neurons could help them repair, but it is not easy. Certain small molecules can switch repair signaling programs back on. Unfortunately, these molecules diffuse easily through tissues, spreading around the body and making it hard to target individual damaged cells. This both hampers research into neuronal repair and makes treatments directed at healing damage to the nervous system more likely to have side-effects. It is unclear whether reactivating regeneration signaling in individual neurons is possible. One way to address this question is to use optogenetics. This technique uses genetic engineering to fuse proteins that are light-sensitive to proteins responsible for relaying signals in the cell. When specific wavelengths of light hit the light-sensitive proteins, the fused signaling proteins switch on, leading to the activation of any proteins they control, for example, those involved in regeneration. Wang et al. used optogenetic tools to determine if light can help repair neurons in fruit fly larvae. First, a strong laser light was used to damage an individual neuron in a fruit fly larva that had been genetically modified so that blue light would activate the regeneration program in its neurons. Then, Wang et al. illuminated the cell with dim blue light, switching on the regeneration program. Not only did this allow the neuron to repair itself, it also allowed the light to guide its regeneration. By focusing the blue light on the damaged end of the neuron, it was possible to guide the direction of the cell's growth as it regenerated. Regeneration programs in flies and mammals involve similar signaling proteins, but blue light does not penetrate well into mammalian tissues. This means that further research into LEDs that can be implanted may be necessary before neuronal repair experiments can be performed in mammals. In any case, the ability to focus treatment on individual neurons paves the way for future work into the regeneration of the nervous system, and the combination of light and genetics could reveal more about how repair signals work.


Conflict of interest statement

QW, HF, FL, SS, VK, YS, KZ No competing interests declared

Figures

Figure 1.
Figure 1.. OptoRaf and optoAKT specifically activate the ERK and AKT subcircuits, respectively.
(A) Activation of optoRaf benchmarked with ERK2-EGFP nuclear translocation. (B) Activation of optoAKT benchmarked with FOXO3-EGFP nuclear export. Scale bars = 10 μm. (C) Western blot analysis of the pERK and ERK activities in response to time-stamped activation of optoRaf. Blue light (0.5 mW/cm2) was applied for 5, 10, 20, and 60 min to HEK293T cells transfected with optoRaf. Non-transfected cells or optoRaf-transfected cells (dark) were used as negative controls. (D) Inactivation of the pERK activity after blue light was shut off. (E) Western blot analysis of the pAKT (S473) and AKT activities in response to time-stamped activation of optoAKT. Cells were treated with identical illumination scheme in (C). (F) Inactivation of the pAKT activity after blue light was shut off. (G) Plots of normalized pERK and pAKT activity upon optoRaf and optoAKT activation, respectively (maximum activation was defined as 1). Both optoRaf and optoAKT show rapid (less than 5 min) and reversible activation patterns (N = 3). (H) OptoRaf and optoAKT do not show cross activity at the level of ERK and AKT. Cells were exposed to blue light (0.5 mW/cm2) for 10 min before lysis. (I) Quantification of the phosphorylated protein level, phosphorylation level was normalized to non-transfected group(N = 3). (J, K) PC12 cells transfected with either optoRaf (J) or optoAKT (K) were treated by blue light for 24 hr (0.2 mW/cm2). Scale bars = 50 μm. (I) Quantification of the neuritogenesis ratio of PC12 cells transfected with optoRaf or optoAKT. A membrane-targeted Raf (Raf1-EGFP-CaaX) causes constitutive neuritogenesis independent of light treatment, whereas the no-Raf (CIBN2-EGFP-CaaX) control does not increase the neuritogenesis ratio under light or dark treatment. See also Figure 1—figure supplement 1.
Figure 1—figure supplement 1.
Figure 1—figure supplement 1.. Design and live cell imaging for optoRaf and optoAKT in mammalian cell cultures.
(A) Blue light illumination facilitates the association of CIBN and CRY2, and the CIBN/CRY2 complex spontaneously dissociates in the dark. In both optoRaf and optoAKT, CIBN-EGFP-CaaX anchors to the plasma membrane and the cytosolic signaling protein is fused to CRY2. Under blue light stimulation, optoRaf and optoAKT recruit the signaling protein, Raf1 (optoRaf) and AKT ΔPH (optoAKT) to the plasma membrane to activate the ERK and AKT signaling pathway, respectively. (B, C) Live-cell imaging of reversible membrane recruitment of CRY2-mCh-Raf (B) CRY2-mCh-AKT (C). After each cycle of light stimulation, cells were kept in the dark for about 30 min. (D) Multiple cycles of membrane recruitment can be achieved from the same cell. (E) Western blot analysis of the optoRaf S338A mutant, serum containing full medium or blue light was applied to activate Raf/ERK signaling. (F) Western blot analysis of the T308 and S473 phosphorylation sites, serum containing full medium or blue light was applied to activate AKT signaling.
Figure 2.
Figure 2.. Activation of optoRaf but not optoAKT increases C4da neuron dendrite complexity.
(A–D) 15 min blue light stimulation activates optoRaf and optoAKT in flies in vivo. After the light was off, the downstream effectors inactivated gradually. (A) The body walls from WT and optoRaf expressing larvae were dissected and stained for pERK1/2. The 15 min continuous light illumination leads to the enhanced fluorescent intensity and nuclear translocation of pERK in the optoRaf-expressing C4da neurons (labeled by ppk-CD4tdGFP). pERK signal is significantly increased even at 45 min after the light was off. Notably, the ERK signaling is not activated by light stimulation in optoAKT-expressing neurons. C4da neuron cell bodies are outlined by dashed white lines. Scale Bar = 10 μm. (B) Phospho-p70S6K is activated by light illumination in optoAKT expressing neurons, and gradually returned to baseline after blue light was shut off. (C) Qualification of pERK fluorescence intensity in (A). The intensity of pERK in transgenic larvae was normalized to that of WT. WT (0 min off) N = 19, optoRaf (0 min off) N = 16, optoRaf (15 min off) N = 19, optoRaf (45 min off) N = 18, optoRaf (dark) N = 18, optoAKT (0 min off) N = 19 neurons. (D) Qualification of phospho-p70S6K fluorescence intensity in (B). The intensity of phospho-p70S6K in transgenic larvae was normalized to that of WT. WT (0 min off) N = 18, optoAKT (0 min off) N = 19, optoAKT (15 min off) N = 23, optoAKT (45 min off) N = 20, optoAKT (dark) N = 16, optoRaf (0 min off) N = 23 neurons. (E–G) Activation of Raf/MEK/ERK but not AKT signaling by 72 hr' light stimulation increases dendrite outgrowth and branching in C4da neurons. (E) Representative images of C4da neurons from WT, optoRaf and optoAKT expressing larvae with 72 hr' light stimulation and the unstimulated controls. Neurons were reconstructed with Neuronstudio. Scale bar = 50 μm. (F) Quantification of total dendrite length of C4da neurons. (G) Qualification of dendritic branch number. WT (light) N = 21, optoRaf (light) N = 21, optoRaf (dark) N = 21, optoAKT (light) N = 20, optoAKT (dark) N = 20 neurons. All data are mean ± SEM. The data were analyzed by one-way ANOVA followed by Dunnett's multiple comparisons test, **p<0.01, ***p<0.001. See also Figure 3—figure supplements 1–2.
Figure 2—figure supplement 1.
Figure 2—figure supplement 1.. Activation kinetics of optoRaf and optoAKT in fly sensory neurons.
(A–B) 5 min light illumination is sufficient to activate optoRaf, while longer light stimulation can further increase pERK intensity and induce ERK nuclear translocation. Blue light is applied for 0, 5, 10, and 15 min to optoRaf expressing larvae. The fluorescence intensity of pERK is normalized to that of neurons with no blue light treatment (0 min). optoRaf (0 min) N = 20, optoRaf (5 min) N = 21, optoRaf (10 min) N = 18, optoRaf (15 min) N = 16. (C–D) The intensity of phospho-p70S6K is significantly increased after 10 min light illumination in optoAKT expressing neurons. Blue light is applied for 0, 5, 10, and 15 min to optoAKT expressing larvae. The fluorescence intensity of phospho-p70S6K is normalized to that of neurons with no blue light treatment (0 min). optoAKT (0 min) N = 17, optoAKT (5 min) N = 18, optoAKT (10 min) N = 17, optoAKT (15 min) N = 17. Data are mean ± SEM, analyzed by one-way ANOVA followed by Dunnett’s multiple comparisons test. **p<0.01, ***p<0.001.
Figure 2—figure supplement 2.
Figure 2—figure supplement 2.. The specific activation of ERK/p70S6K in C4da neurons.
Downstream effectors are specifically activated in optoRaf or optoAKT expressing neurons by light illumination. The arrowheads mark da neurons and arrows mark epithelial cells. Scale S6K = 10 μm.
Figure 2—figure supplement 3.
Figure 2—figure supplement 3.. Inactivation kinetics of optoRaf, and activation of optoRaf does not upregulate phospho-p70S6K.
Phospho-p70S6K was activated by 15 min light illumination in optoAKT expressing neurons, and inactivated 15 min after the light was off. No enhancement of phospho-p70S6K fluorescent intensity was observed in optoRaf-expressing neurons with light stimulation.
Figure 3.
Figure 3.. Light-stimulated optoRaf or optoAKT enhances axon regeneration in the PNS.
(A–C) Compared with WT, C4da neurons expressing optoRaf or optoAKT show significantly increased axon regeneration in response to blue light. No enhancement was observed in the unstimulated controls. (A) C4da neuron axons were severed and their regeneration was assayed at 48 hr AI. The injury sites are marked by the red dashed circles and regenerating axons are marked by arrowheads. Axons are outlined with dashed green lines. Scale bar = 20 μm. (B) The regeneration percentage of light-stimulated transgenic groups is not significantly higher than WT. Fisher's exact test, p=0.3010, p=0.7608, p=0.4219, p=0.2007, p=0.5933, p=0.0440. (C) Qualification of C4da neuron axon regeneration by the regeneration index. WT (light) N = 33, WT (dark) N = 41, optoRaf (light) N = 36, optoRaf (dark) N = 36, optoAKT (light) N = 52, optoAKT (dark) N = 41, optoRaf + optoAKT (light) N = 51 neurons. Data are mean ± SEM, analyzed by one-way ANOVA followed by Dunnett's multiple comparisons test. (D–F) After injury, larvae were subjected to programmed light and dark cycles for a total of 48 hr. The intermittent light stimulation promotes axon regrowth in optoRaf expressing larvae similar to constant light when the off-time is 15 min. (D) The intermittent patterns of the light stimulus. (E) Compared with larvae incubated in dark, light stimulation is capable of increasing the percentage of regenerated axons. Fisher's exact test, p=0.3616, p=0.0795, p=0.2668, p=0.2030, p=0.1004, p=0.0285. (F) Qualification of C4da axon regeneration by the regeneration index. OptoRaf (dark) N = 36, optoRaf (45 min off) N = 46, optoRaf (15 min off) N = 36, optoRaf (Con. on) N = 36, optoAKT (dark) N = 41, optoAKT (45 min off) N = 49, optoAKT (15 min off) N = 40, optoAKT (Con. on) N = 52 neurons. Data are mean ± SEM, analyzed by one-way ANOVA followed by Dunnett's multiple comparisons test. (G–I) Blue light stimulation significantly enhances axon regeneration in the regeneration-incompetent C3da neurons. (G) C3da neuron axon degeneration was verified at 24 hr AI and axon regeneration was assessed at 48 hr AI. The injury sites are marked by the dashed circles, regenerated axons are demarcated by arrowheads, and arrows mark non-regenerated axons. Scale bar = 20 μm. (H) The regeneration percentage is not significantly different. Fisher’s exact test, p=0.1146, p=0.4155, p=0.3979, p=1.000. (I) Qualification of axon regeneration by the regeneration index. WT (light) N = 42, optoRaf (light) N = 36, optoRaf (dark) N = 39, optoAKT (light) N = 34, optoAKT (dark) N = 38 neurons. Data are mean ± SEM, analyzed by one-way ANOVA followed by Dunnett's multiple comparisons test. *p<0.05, **p<0.01. See also Figure 3—figure supplements 1 and 2.
Figure 3—figure supplement 1.
Figure 3—figure supplement 1.. Quantification of axon regeneration in the PNS.
(A) A schematic diagram depicts the C4da neuron injury model. At 48 hr AI, two branches of the regenerating axon are extended towards two opposite directions. To calculate the regeneration index, the increased length of the longer branch was measured and normalized by DCAC (the distance between the cell body and the axon converging point). Scale bar = 50 μm. (B) A schematic drawing depicts the C3da neuron injury model. The green line depicts the regenerated axon. Scale bar = 50 μm.
Figure 3—figure supplement 2.
Figure 3—figure supplement 2.. Co-activation of optoRaf and optoAKT does not further promote axon regeneration in C3da neurons.
(A) C3da neurons expressing both optoRaf and optoAKT show increased, but not additive regeneration capacity in response to blue light. (B–C) Quantification of C3da axon regeneration percentage (B) and regeneration index (C) at 48 hr AI. WT (light) N = 42, optoRaf + optoAKT (light) N = 44 neurons, regeneration index p=0.0409, regeneration percentage p=0.4300. Data are mean ± SEM, analyzed by unpaired t test or Fisher’s exact test. *p<0.05.
Figure 4.
Figure 4.. Local optogenetic stimulation conveys guidance instructions to regenerating axons.
(A, B) Regenerating axons prefer to regrow away from the original trajectory, with only a minority of axons finding the correct path. (A) Representative images of axons retracting or bifurcating at 24 hr AI. At 48 hr AI in WT, regenerating axons extend dorsally, ventrally, or both directions. The injury site is marked by the dashed circles and regenerating axons are marked by arrowheads. Axons are outlined with dashed green lines. Scale bar = 20 μm. (B) Light stimulation fails to increase the percentage of axons regrowing towards the right direction. The percentage of axons extending towards the correct trajectory (ventral + bidirectional) were analyzed by Fisher's exact test, p=0.7554, p=0.1729, p=0.6097, p=0.7638. WT (light) N = 26, optoRaf (light) N = 26, optoRaf (dark) N = 25, optoAKT (light) N = 45, optoAKT (dark) N = 28 neurons. (C, D) Restricted local activation of optoRaf or optoAKT significantly increases the relative regeneration ratio. The ratio is defined to weigh the regeneration potential of the ventral branch against the dorsal branch. (C) A single pulse of light stimulation delivered specifically on the ventral axon branch at 24 hr AI (blue flash symbol) is capable of promoting the preferential extension of regenerating axons in optoRaf or optoAKT expressing larvae. The injury sites are demarcated by the dashed red circles and regenerating axons are marked by arrowheads. Axons are outlined with dashed green lines. Blue flash symbols show the restrict light delivery to the ventral branch. (D) Qualification of the relative regeneration ratio of v'ada. WT (dark) N = 32, WT (local 5 min) N = 32, WT (Con. on) N = 33, optoRaf (dark) N = 32, optoRaf (local 5 min) N = 35, optoRaf (Con. on) N = 36, optoAKT (dark) N = 33, optoAKT (local 5 min) N = 34, optoAKT (Con. on) N = 36 neurons. Data are mean ± SEM, analyzed by one-way ANOVA followed by Dunnett's multiple comparisons test, *p<0.05, ***p<0.001.
Figure 5.
Figure 5.. Activation of optoRaf or optoAKT promotes axon regeneration in the CNS.
(A–C) Light stimulation significantly enhances axon regeneration in the VNC of optoRaf- or optoAKT-expressing larvae. (A) Complete degeneration in A3 and A6 commissure segments was confirmed at 24 hr AI and regeneration of these two segments was assayed independently at 48 hr AI. The injury sites are marked by the red dashed circles and regenerating axons are labeled by arrowheads. In the schematic diagrams, regrowing axons that reached other bundles and thus define a regenerating commissure segment are highlighted in red, while other regrowing axons are illustrated in blue. Scale bar = 20 μm. (B) The regeneration percentage is not significantly different. Fisher's exact test, p=0.0971, p=1.000, p=0.3415, p=0.7524. (C) Qualification of axon regeneration in VNC by the regeneration index. WT (light) N = 32, optoRaf (light) N = 36, optoRaf (dark) N = 32, optoAKT (light) N = 26, optoAKT (dark) N = 34 segments. Data are mean ± SEM, analyzed by one-way ANOVA followed by Dunnett's multiple comparisons test, ***p<0.001. See also Figure 5—figure supplement 1.
Figure 5—figure supplement 1.
Figure 5—figure supplement 1.. Quantification of axon regeneration in the CNS.
A schematic diagram of the VNC injury method. The abdominal A3 and A6 bundles were injured by laser and the regeneration of these two commissure segments were assessed independently at 48 hr AI. The regeneration index is defined as the total length of all regenerated axons normalized to the length between A4 and A5 bundles. However, a commissure segment is defined as regenerated only when at least one axon extends beyond the midline of the commissure region or connects with other intact bundles. Those axons are illustrated in the schematic diagrams in red, while other regrowing axons are in blue. Scale bar = 20 μm.
Figure 6.
Figure 6.. Activation of optoRaf or optoAKT promotes functional regeneration after CNS injury.
(A) A schematic drawing of the behavioral recovery test. The A7 and A8 C4da neuron axon bundles (corresponding to the A7 and A8 body segments) in the VNC were injured by laser and the larva was then subjected to three consecutive trials at 24 and 48 hr AI, respectively. In each trial, a 47°C heat probe was applied at the A7 or A8 segments. A fully recovered larva would produce a stereotypical rolling behavior in response to the heat probe and would be scored as ‘1’, otherwise as ‘0’. If the total score of the three trials was below 1 at 24 hr AI but increased to 2 or 3 at 48 hr AI, the larva was defined as recovered. (B, C) The behavioral recovery test was performed at 24 hr and 48 hr after VNC injury (A7 and A8 bundles). Larvae expressing optoRaf or optoAKT exhibit significantly accelerated recovery in response to light stimulation. (B) Qualification of the total scores at each time point. WT (uninjured) N = 15, WT (light) N = 22, optoRaf (light) N = 32, optoRaf (dark) N = 23, optoAKT (light) N = 26, optoAKT (dark) N = 28. Data are mean ± SEM, analyzed by two-way ANOVA followed by Tukey's multiple comparisons test. (C) Qualification of the recovery percentage. The data were analyzed by Fisher's exact test, p=0.0230, p=0.7222, p=0.0167, p=1.000. *p<0.05, **p<0.01.

References

    1. Aloe L, Rocco ML, Bianchi P, Manni L. Nerve growth factor: from the early discoveries to the potential clinical use. Journal of Translational Medicine. 2012;10:239. doi: 10.1186/1479-5876-10-239. - DOI - PMC - PubMed
    1. Awasaki T, Lai SL, Ito K, Lee T. Organization and postembryonic development of glial cells in the adult central brain of Drosophila. Journal of Neuroscience. 2008;28:13742–13753. doi: 10.1523/JNEUROSCI.4844-08.2008. - DOI - PMC - PubMed
    1. Bibel M, Barde YA. Neurotrophins: key regulators of cell fate and cell shape in the vertebrate nervous system. Genes & Development. 2000;14:2919–2937. doi: 10.1101/gad.841400. - DOI - PubMed
    1. Brunet A, Bonni A, Zigmond MJ, Lin MZ, Juo P, Hu LS, Anderson MJ, Arden KC, Blenis J, Greenberg ME. Akt promotes cell survival by phosphorylating and inhibiting a forkhead transcription factor. Cell. 1999;96:857–868. doi: 10.1016/S0092-8674(00)80595-4. - DOI - PubMed
    1. Cervellini I, Galino J, Zhu N, Allen S, Birchmeier C, Bennett DL. Sustained MAPK/ERK activation in adult schwann cells impairs nerve repair. The Journal of Neuroscience. 2018;38:679–690. doi: 10.1523/JNEUROSCI.2255-17.2017. - DOI - PMC - PubMed

Publication types

MeSH terms

Substances

LinkOut - more resources