. 2020 Nov 4;48(19):10973-10985.
doi: 10.1093/nar/gkaa795.

A C. elegans model for neurodegeneration in Cockayne syndrome

Affiliations

A C. elegans model for neurodegeneration in Cockayne syndrome

Amanda F C Lopes et al. Nucleic Acids Res. .

Abstract

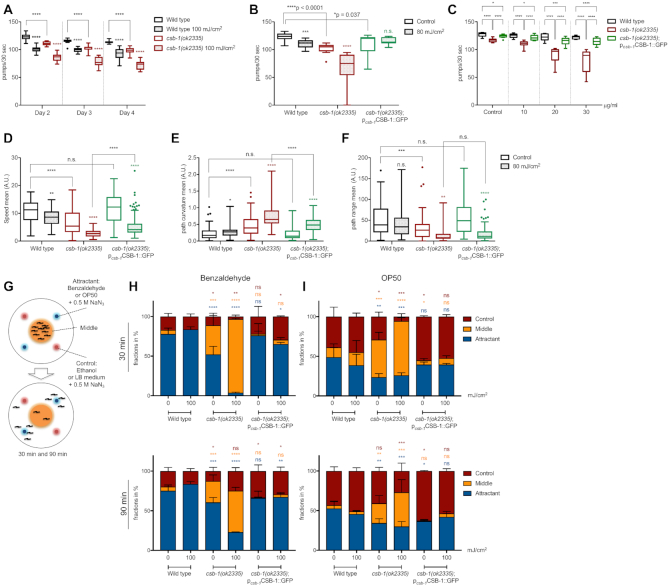
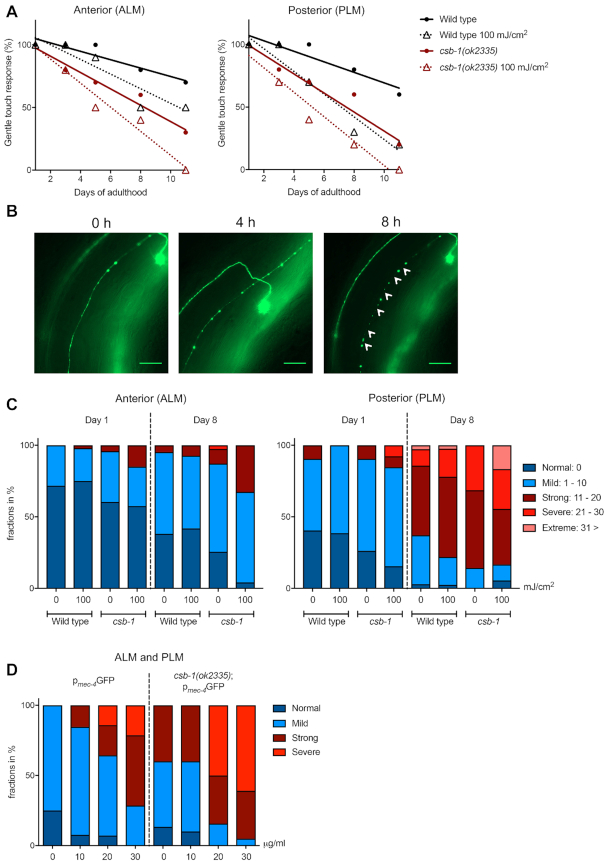
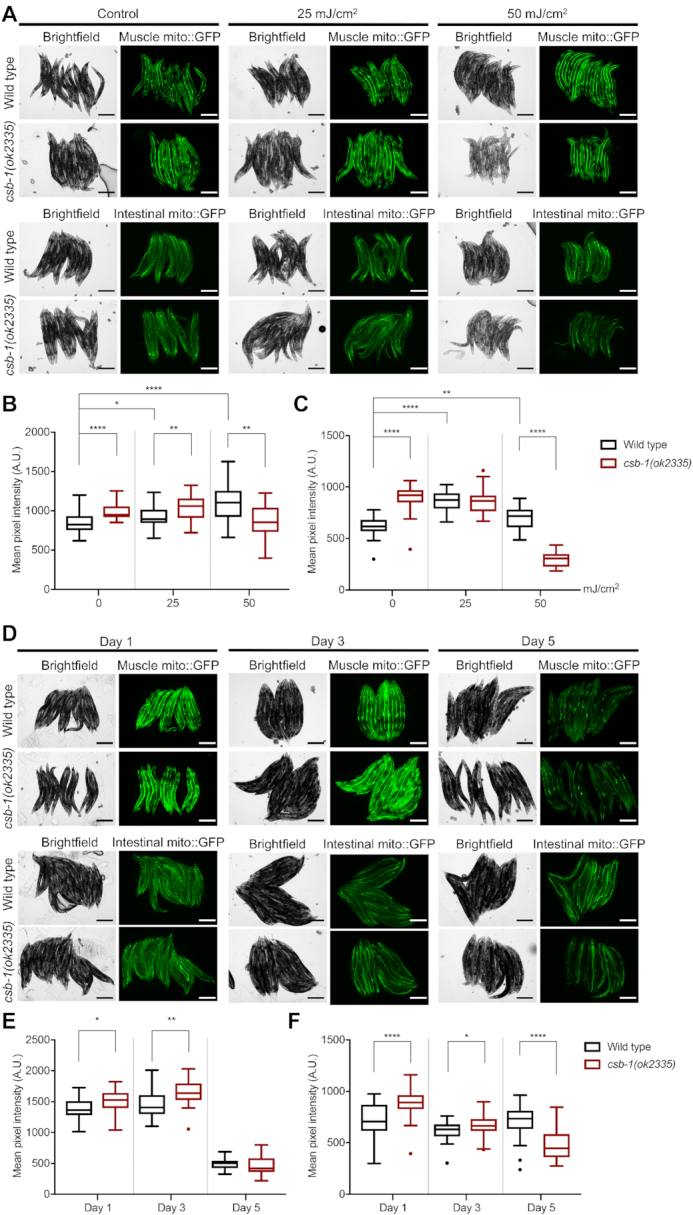
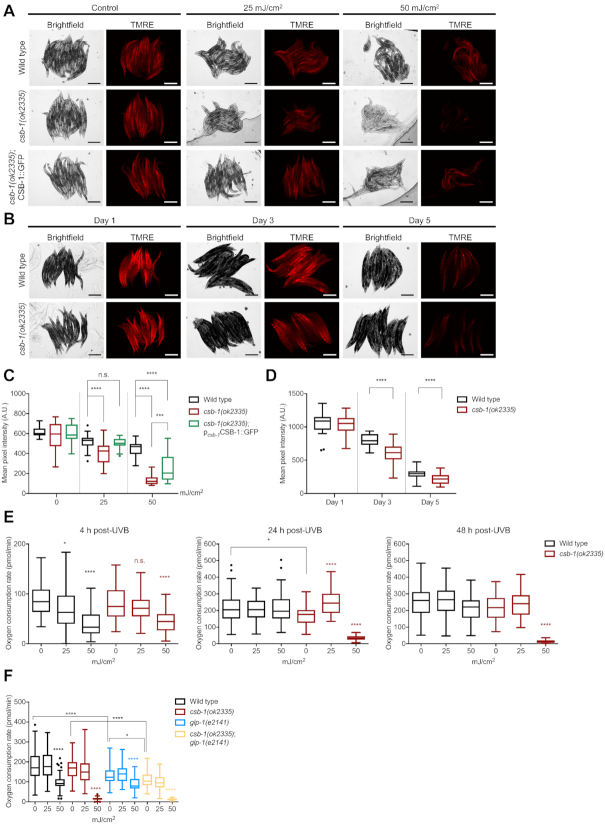
Cockayne syndrome (CS) is a congenital syndrome characterized by growth and mental retardation, and premature ageing. The complexity of CS and mammalian models warrants simpler metazoan models that display CS-like phenotypes that could be studied in the context of a live organism. Here, we provide a characterization of neuronal and mitochondrial aberrations caused by a mutation in the csb-1 gene in Caenorhabditis elegans. We report a progressive neurodegeneration in adult animals that is enhanced upon UV-induced DNA damage. The csb-1 mutants show dysfunctional hyperfused mitochondria that degrade upon DNA damage, resulting in diminished respiratory activity. Our data support the role of endogenous DNA damage as a driving factor of CS-related neuropathology and underline the role of mitochondrial dysfunction in the disease.


Figures

Figure 1.
Figure 1.
Behavioural changes imply neuronal defects in csb-1 mutants. (A) Pharyngeal pumping in wt and csb-1 mutants upon UVB irradiation. Nematodes were irradiated at Day 1 of adulthood, and assayed 24 h after irradiation (Day 2), 48 h later (Day 3) and 72 h later (Day 4) (n > 15 per group). (B) Pharyngeal pumping measured in the wt, the csb-1 mutant and the csb-1(ok2335);CSB-1::GFP rescue line upon UVB irradiation. Nematodes were irradiated at Day 1 of adulthood, and assayed 48 h after irradiation (n > 13 per group). (C) Pharyngeal pumping in the wt and csb-1(ok2335) (each carrying the pmec-4GFP neuronal reporter) and the csb-1(ok2335);CSB-1::GFP rescue line upon Illudin M treatment at different concentrations. Whiskers in (A) to (C) show the SD, statistics were computed with the non-parametric Mann-Whitney test with *P < 0.05, **P < 0.01, ***P < 0.001 and ****P < 0.0001 and Tukey outliers. (DF) display locomotion features of wt, the csb-1 mutant and the csb-1(ok2335);pcsb-1CSB-1::GFP rescue line 24 h after UVB irradiation, with (D) mean speed, (E) mean path curvature, and (F) mean path range (in A.U.) (n ≥ 60). Significance is measured via the Mann-Whitney test with *P < 0.05, **P < 0.01, ***P < 0.001 and ****P < 0.0001, and Tukey outliers are shown as dots. Statistical significance in (A) to (F) without specific indication always refers to the colour-matched untreated control. (G) Experiment scheme of the chemotaxis assay (see Materials and Methods). (H) and (I) are chemotaxis assays in the wt, the csb-1 mutant and the csb-1(ok2335);pcsb-1CSB-1::GFP rescue line, quantified after 30 and 90 min, while (H) uses benzaldehyde, and (I) OP50 E. coli as attractant, respectively. Significance between zone-specific localization compared to the wt is measured by using the Welch's t-test with *P < 0.05, **P < 0.01, ***P < 0.001 and ****P < 0.0001.
Figure 2.
Figure 2.
Loss of neuronal integrity is accentuated in csb-1 mutants. (A) Gentle touch response assayed in the anterior part of the animal (ALM neurons), or the posterior (PLM neurons), respectively. Animals were treated with UVB at young adult stage, and measured on the Day of UV radiation (Day 1), and on the Days 3, 5, 8 and 11 thereafter. Plot shows nonlinear regression (curve fit) line. (B) Representative images of neuronal beading in a time-dependent manner in animals expressing pmec-4GFP. Gentle touch mechanosensory neurons were irradiated at Day 1 of adulthood and neuronal beading was observed for morphological changes at Day 8 (time: 0) after treatment. The first timepoint shows a neuron with beading. With time, the beading becomes more severe, until it reaches a stage with breakages along the axon resulting in degeneration, which is indicated by white arrows. Scale bars are 25 μm. (C) Quantification of degeneration in anterior (ALM) and posterior (PLM) mechanosensory neurons. Animals were treated at young adult stage, and measured on the Day of treatment (Day 1) and 7 Days after (Day 8). Degeneration is measured by quantifying the severity of beading per animal. Statistical analysis is available in Supplementary Table S3. (D) Quantification of neuronal beading along ALM and PLM axons in animals 24 h post-treatment with different concentrations of Illudin M.
Figure 3.
Figure 3.
Mitochondrial mass accumulates in csb-1 mutants. (A) Representative images of animals expressing muscular (pmyo-3mito::GFP, upper panel) or intestinal (pges-1mito::GFP, lower panel) mitochondrial localized GFP upon UVB irradiation. The brightfield images and the corresponding fluorescence images are shown. (B) Quantification of pmyo-3mito::GFP. (C) Quantification of pges-1mito::GFP. (n = 25 animals). Whiskers in (B) and (C) show the SD. (n = 25 animals). Statistics were computed with the non-parametric Mann–Whitney test with *P < 0.05, **P < 0.01, ***P < 0.001 and ****P < 0.0001 and Tukey outliers are shown. (D) Representative images of animals expressing muscular (pmyo-3mito::GFP, upper panel) or intestinal (pges-1mito::GFP, lower panel) GFP in mitochondria during adult ageing. The brightfield images and the corresponding fluorescence images are shown. (E) Quantification of pmyo-3mito::GFP. (F) Quantification of pges-1mito::GFP. Error bars in (E) and (F) show the SD (n = 25 animals). Statistics were computed with the non-parametric Mann–Whitney test with *P < 0.05, **P < 0.01, ***P < 0.001 and ****P < 0.0001 and Tukey outliers are shown. Size bars in (A) and (D) are 250 μm.
Figure 4.
Figure 4.
Csb-1 mutants display mitochondrial damage upon UVB and during ageing. (A) Representative images of animals stained with the mitochondrial dye TMRE upon UVB irradiation or (B) during ageing. Images show the brightfield and the corresponding red fluorescence signal of TMRE. (C) Quantification of data represented in (A) comparing wt, csb-1(ok2335) and the CSB-1::GFP rescue (n = 25). (D) Quantification of data represented in (B) (n = 25). (E) Oxygen consumption rates of csb-1 mutants 4, 24 and 48 h after UVB irradiation (n > 50 per group, >5 wells with biological replicates, measured 10 times). Results are presented per wells containing 10 animals each. (F) Oxygen consumption rate of glp-1;csb-1 double-mutants after UVB irradiation (n > 50 per group, >5 wells with biological replicates, measured 10 times). Panels (C) to (F) show boxplot whiskers representing the SD with Tukey outliers indicated as dots. Statistical significance without specific indication always refers to the colour-matched untreated control. Statistics were computed with the Mann–Whitney test while *P < 0.05, **P < 0.01, ***P < 0.001 and ****P < 0.0001. Size bars in (A) and (B) are 250 μm.
Figure 5.
Figure 5.
Mitochondrial structure aberrations in csb-1 mutants. (A) Representative confocal images of the different mitochondrial morphology classes: ‘Tubular’ and ‘Intermediate’ mitochondrial classifications describe the unstressed mitochondrial status. The classifications ‘Fused’ and ‘Hyperfused’ belong to the mechanism mitochondria undergo in order to recover from a mild stress. The classifications ‘Fragmented’, ‘Hyperfragmented’ and ‘Degrading’ belong to the path mitochondria follow in response to acute stress. The dotted line represents the outline of the cell. Scale bars are 15 μm. (B) Quantification of mitochondrial classes in wt and the csb-1 mutant. Animals were treated at L4 stage, and measured 24 h after.

References

    1. Karikkineth A.C., Scheibye-Knudsen M., Fivenson E., Croteau D.L., Bohr V.A.. Cockayne syndrome: clinical features, model systems and pathways. Ageing Res. Rev. 2017; 33:3–17. - PMC - PubMed
    1. Nagtegaal A.P., Rainey R.N., van der Pluijm I., Brandt R.M., van der Horst G.T., Borst J.G., Segil N.. Cockayne syndrome group B (Csb) and group a (Csa) deficiencies predispose to hearing loss and cochlear hair cell degeneration in mice. J. Neurosci. 2015; 35:4280–4286. - PMC - PubMed
    1. Rapin I., Weidenheim K., Lindenbaum Y., Rosenbaum P., Merchant S.N., Krishna S., Dickson D.W.. Cockayne syndrome in adults: review with clinical and pathologic study of a new case. J. Child Neurol. 2006; 21:991–1006. - PMC - PubMed
    1. van der Horst G.T., Meira L., Gorgels T.G., de Wit J., Velasco-Miguel S., Richardson J.A., Kamp Y., Vreeswijk M.P., Smit B., Bootsma D. et al. .. UVB radiation-induced cancer predisposition in Cockayne syndrome group A (Csa) mutant mice. DNA Repair (Amst.). 2002; 1:143–157. - PubMed
    1. Nouspikel T. Nucleotide excision repair and neurological diseases. DNA Repair (Amst.). 2008; 7:1155–1167. - PubMed

Publication types

Substances