. 2020 Nov 4;48(19):10890-10908.
doi: 10.1093/nar/gkaa832.

HIV-1 infection activates endogenous retroviral promoters regulating antiviral gene expression

Affiliations

HIV-1 infection activates endogenous retroviral promoters regulating antiviral gene expression

Smitha Srinivasachar Badarinarayan et al. Nucleic Acids Res. .

Abstract

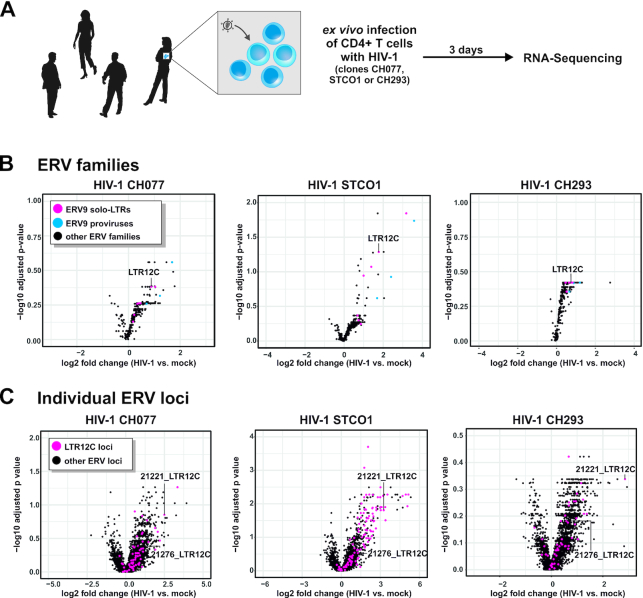
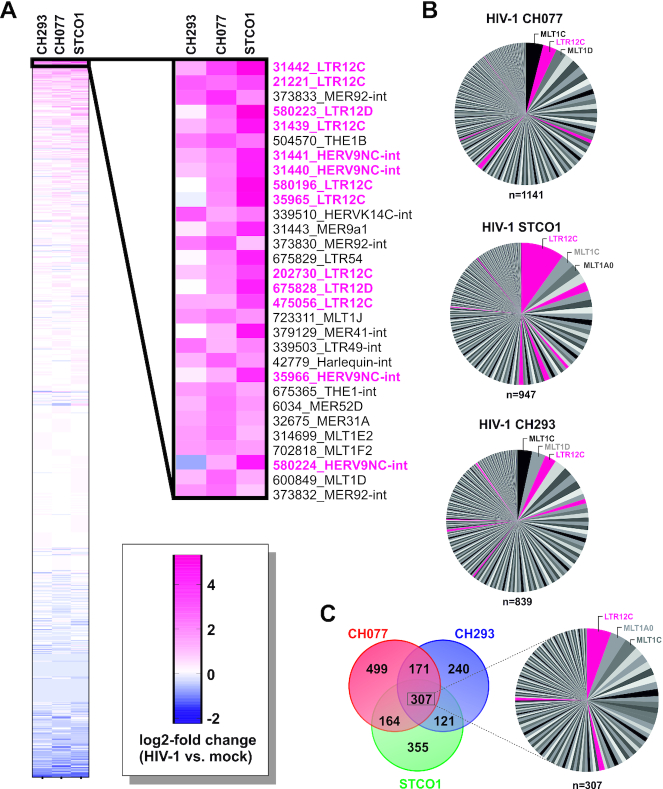
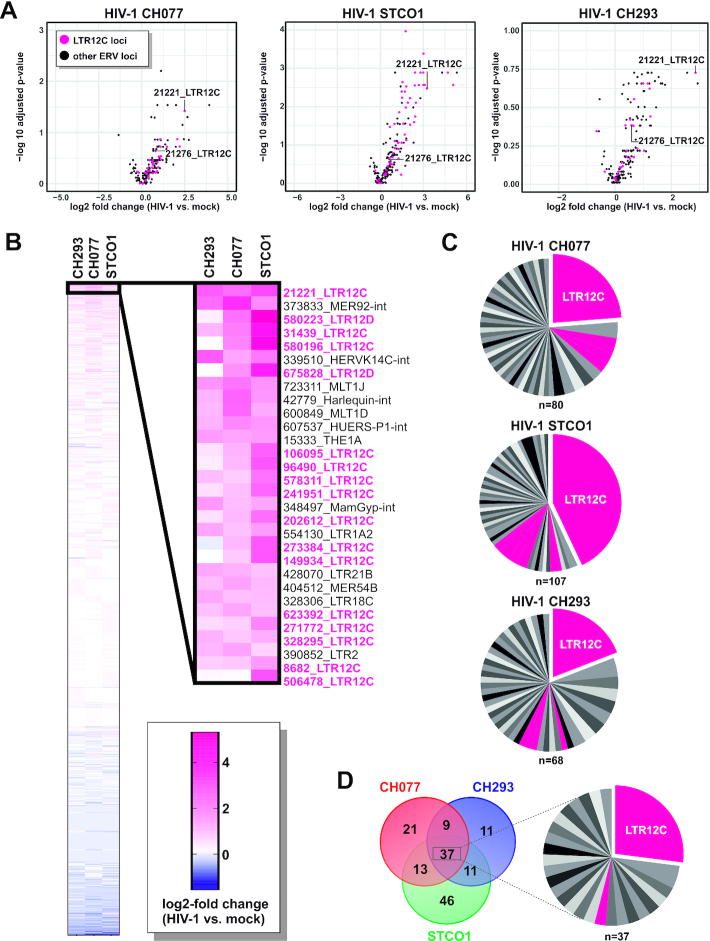
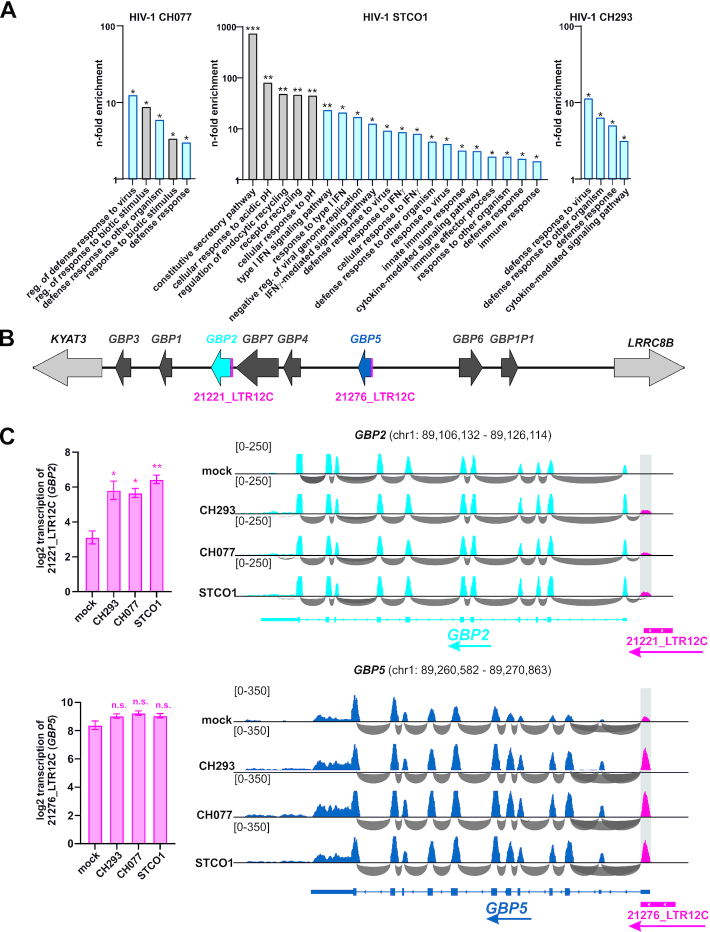
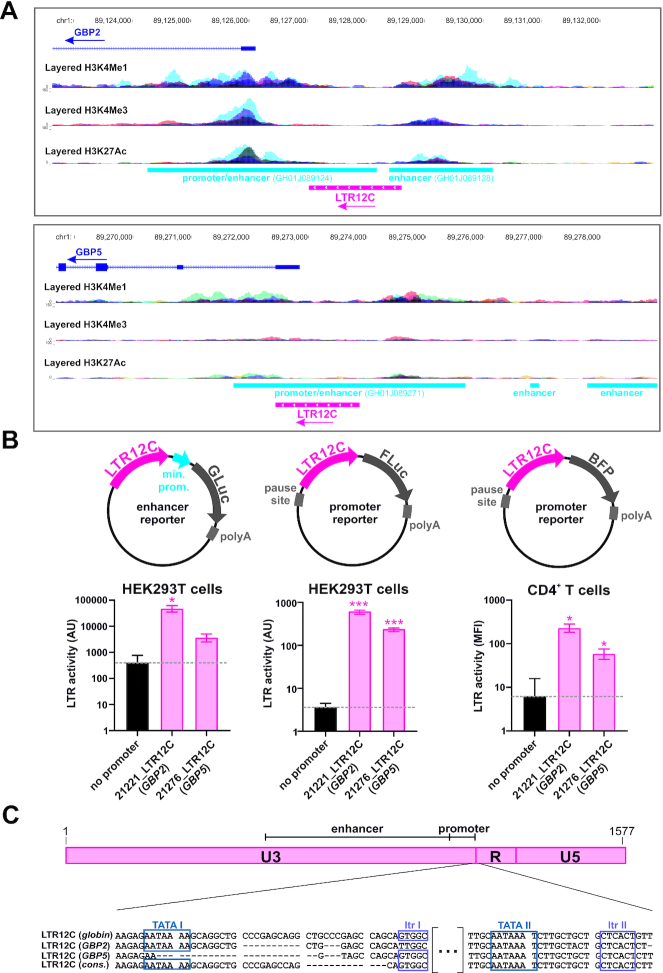
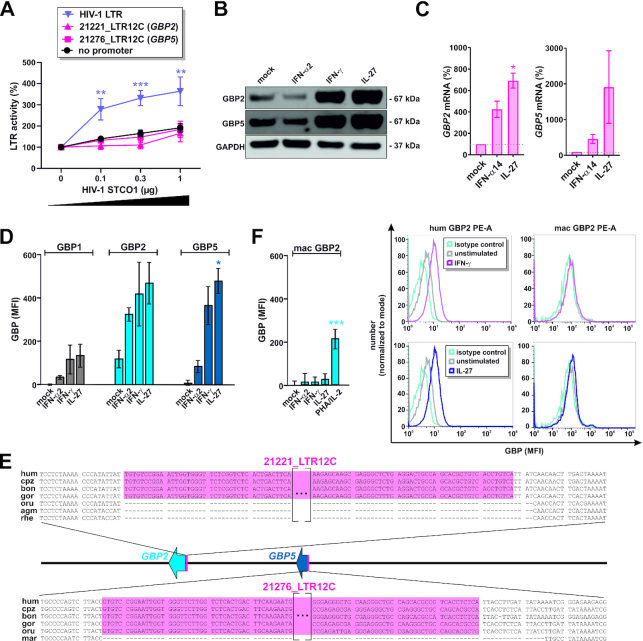
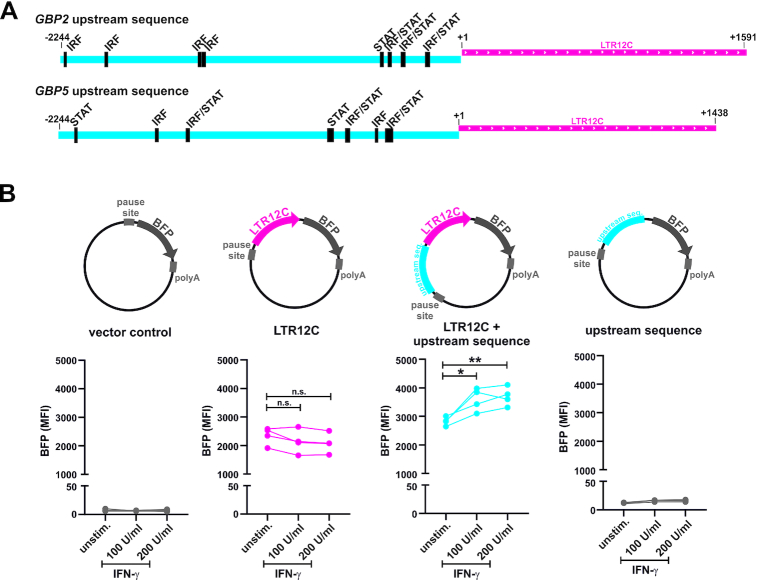
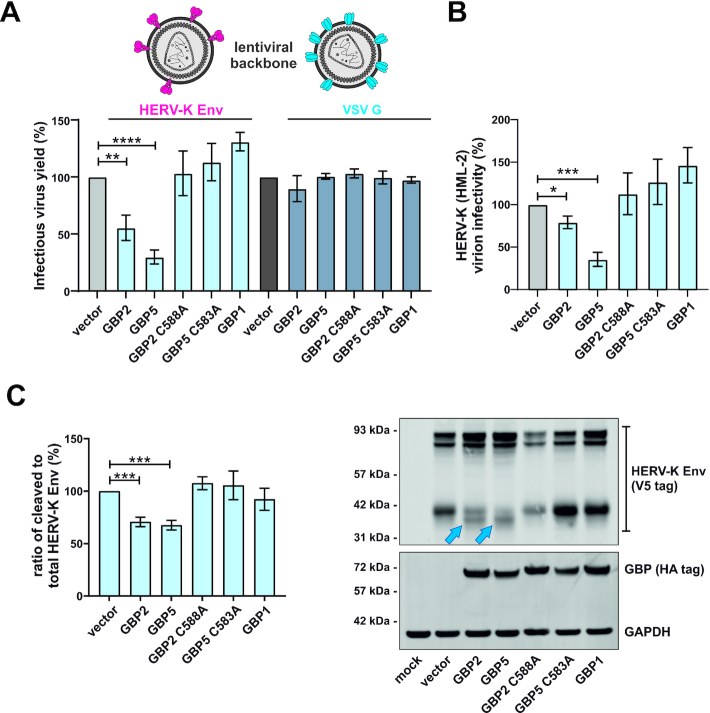
Although endogenous retroviruses (ERVs) are known to harbor cis-regulatory elements, their role in modulating cellular immune responses remains poorly understood. Using an RNA-seq approach, we show that several members of the ERV9 lineage, particularly LTR12C elements, are activated upon HIV-1 infection of primary CD4+ T cells. Intriguingly, HIV-1-induced ERVs harboring transcription start sites are primarily found in the vicinity of immunity genes. For example, HIV-1 infection activates LTR12C elements upstream of the interferon-inducible genes GBP2 and GBP5 that encode for broad-spectrum antiviral factors. Reporter assays demonstrated that these LTR12C elements drive gene expression in primary CD4+ T cells. In line with this, HIV-1 infection triggered the expression of a unique GBP2 transcript variant by activating a cryptic transcription start site within LTR12C. Furthermore, stimulation with HIV-1-induced cytokines increased GBP2 and GBP5 expression in human cells, but not in macaque cells that naturally lack the GBP5 gene and the LTR12C element upstream of GBP2. Finally, our findings suggest that GBP2 and GBP5 have already been active against ancient viral pathogens as they suppress the maturation of the extinct retrovirus HERV-K (HML-2). In summary, our findings uncover how human cells can exploit remnants of once-infectious retroviruses to regulate antiviral gene expression.


Figures

Figure 1.
Figure 1.
HIV-1 infection triggers ERV transcription in primary CD4+ T cells. (A) Experimental setup. CD4+ T cells of four healthy human donors were infected with three different clones of HIV-1 (40). Three days post-infection, cells were harvested and RNA sequencing was performed. (B, C) Differential expression of ERVs upon infection with HIV-1 CH077 (left), STCO1 (middle) or CH293 (right). (B) Multi-mapped reads were used to determine differential expression of ERV families. Solo-LTRs or (near) full-length members belonging to the ERV9 lineage are highlighted in pink and blue, respectively. (C) Uniquely mapped reads were used to determine differential expression of individual ERV loci. LTR12C loci are highlighted in pink.
Figure 2.
Figure 2.
HIV-1 infection triggers the transcription of ERV9 elements in primary CD4+ T cells. (A) Heatmap illustrating log2-fold changes of individual ERV loci upon infection with HIV-1 CH293, CH077 or STCO1. The 30 most strongly upregulated ERV repeats are shown on the right. (B) Pie charts illustrating the number of repeats in each ERV family that were induced upon infection with HIV-1 CH077 (left), STCO1 (middle) or CH293 (right). Families belonging to the ERV9 lineage are highlighted in pink. (C) Venn diagram (left) illustrating the overlap of ERVs induced by HIV-1 CH077, CH293 and/or STCO1 and pie chart (right) highlighting the number of repeats in each ERV family that were upregulated by all three HIV-1 clones tested.
Figure 3.
Figure 3.
HIV-1 infection triggers the transcription of ERV9 elements harboring TSS. (A) Results shown in Figure 1C were CAGE-filtered to illustrate differential expression of individual ERV loci harboring transcription start sites TSS. In the CH293 volcano plot of panel (A), one outlier (463751_LTR16D) was omitted for better visualization. LTR12C loci are highlighted in pink. (B) Heatmap illustrating log2-fold changes of CAGE-filtered ERV loci upon infection with HIV-1 CH293, CH077 or STCO1. The 30 most strongly upregulated ERV repeats harboring previously described TSS are shown on the right. (C) Pie charts illustrating the number of CAGE-filtered repeats in each ERV family that were induced upon infection with HIV-1 CH077 (left), STCO1 (middle) or CH293 (right). Families belonging to the ERV9 lineage are highlighted in pink. (D) Venn diagram (left) illustrating the overlap of CAGE-filtered ERVs induced by HIV-1 CH077, CH293 and/or STCO1 and pie chart (right) highlighting the number of CAGE-filtered repeats in each ERV family that were upregulated by all three HIV-1 clones tested.
Figure 4.
Figure 4.
HIV-1-induced ERVs are found in the vicinity of cellular immunity genes and may regulate their expression. (A) Identification of cellular pathways that may be cis-regulated by HIV-1 induced ERVs. CAGE-filtered ERV repeats that were upregulated at least log2 0.5-fold upon infection with HIV-1 CH077, STCO1 or CH293 were analyzed using GREAT (47). Pathways significant by binomial test are shown (Binom FDR q-value: *q< 0.05, **q < 0.01, ***q < 0.001). Gene sets involved in immunity and infection are highlighted in blue. (B) Guanylate-binding protein (GBP) gene locus illustrating all human GBP genes (GBP1–7), a pseudogene (GBP1P1) and two flanking genes (KYAT3, LRRC8B). GBP2 and GBP5, encoding for broad-spectrum antiviral factors (35) are shown in blue, the upstream LTR12C repeats are highlighted in pink. (C) Transcription of GBP2, GBP5 and the respective LTR12C repeats in uninfected and HIV-1 infected CD4+ T cells. Representative RNA-Seq data illustrating read coverage (blue) and exon linkage (grey) are shown on the right. The mean transcription of LTR12C in all four donors for all three viruses tested (±SEM) is shown on the left (*P <0.05, n.s. not significant, two-tailed paired Student's t test).
Figure 5.
Figure 5.
The LTR12C repeats upstream of GBP2 and GBP5 act as promoters. (A) Promoter and enhancer elements overlapping with the LTR12C repeats upstream of GBP2 (top) and GBP5 (bottom). Chromosomal positions are indicated on top, GBP genes are shown in dark blue, LTR12C repeats are highlighted in pink and promoter/enhancer sequences identified by GeneHancer (66) are shown in light blue. Histone modifications frequently found near promoters (H3K4Me3) or enhancer elements (H3K4Me1, H3K27Ac) are shown as three individual tracks and were obtained from the Encyclopedia of DNA Elements (ENCODE) via the UCSC browser (98). An overlay of data obtained from seven different cell types (GM12878, H1-hESC, HSMM, HUVEC, K562, NHEK, NHLF) is shown. The tracks show data from the Bernstein lab at the Broad Institute, as part of the ENCODE Consortium. (B) LTR12C repeats upstream of GBP2 or GBP5 were inserted into enhancer (left) or promoter (middle, right) reporter vectors. Schematic vector maps are shown on top. In the left and middle panels, HEK293T cells were co-transfected with the indicated reporter vectors expressing Gaussia luciferase (GLuc) or firefly luciferase (FLuc) and control vector. Two days post transfection, reporter luciferase activity was determined and normalized to the activity of the control luciferase. In the right panel, primary CD4+ T cells were electroporated with the indicated reporter vectors expressing blue fluorescent protein (BFP). Two days post electroporation, the mean fluorescence intensity (MFI) of BFP cells was quantified by flow cytometry. In (B), mean values of 3–18 independent experiments ± SEM are shown (*P < 0.05; *** P < 0.001). (C) The overall structure of the consensus LTR12C (1577 nt) is schematically illustrated on top. At the bottom, partial LTR12C sequences upstream of the globin locus, GBP2 and GBP5 were aligned with the consensus sequence. Two pairs of TATA box and initiator (Itr) sequence are indicated by blue and violet frames, respectively. The 5′ TATA box (TATA I) and initiator (Itr I) have previously been shown to initiate transcription in the LTR12C repeat upstream of the globin locus.
Figure 6.
Figure 6.
LTR12C repeats are associated with responsiveness of GBPs to cytokine stimulation. (A) HEK293T cells were co-transfected with the indicated firefly luciferase promoter reporter plasmids, a Gaussia luciferase control vector and increasing amounts of the HIV-1 STCO1 clone. Two days post transfection, luciferase activities were determined. Mean values of 4–9 independent experiments ± SEM are shown. (B) Primary human CD4+ T cells were stimulated with IFN-α2 (500 U/ml), IFN-γ (200 U/ml) or IL-27 (5 ng/ml) for 3 days or left untreated, and GBP2 and GBP5 expression was analyzed by Western blotting. One representative Western blot is shown. (C) Primary human CD4+ T cells were stimulated with IFN-α14 (50 ng/ml) or IL-27 (5 ng/ml) for 3 days or left untreated, and GBP2 and GBP5 mRNA levels were determined by qPCR. Mean values of three independent donors ± SEM are shown. (D) Primary human PBMCs were stimulated with IFN-α2 (500 U/ml) IFN-γ (200 U/ml) or IL-27 (50 ng/ml) for 3 days or left untreated, and GBP1, GBP2 and GBP5 expression was analyzed by flow cytometry. Mean values of three independent donors ± SEM are shown. (E) Alignment of the LTR12C integration sites upstream of GBP2 and GBP5 in humans (hum), chimpanzees (cpz), bonobos (bon), gorillas (gor), orangutans (oru), African green monkeys (agm), rhesus macaques (rhe) and marmosets (mar). (F) Primary rhesus macaque PBMCs were stimulated with IFN-α2 (500 U/ml), IFN-γ (200 U/ml) or IL-27 (50 ng/ml) for 3 days or left untreated, and GBP2 expression was analyzed by flow cytometry. Mean values of four independent donors ± SEM are shown. (*P <0.05; ** P <0.01; *** P <0.001). Exemplary primary FACS data for GBP2 induction upon IFN-γ and IL-27 treatment are shown on the right.
Figure 7.
Figure 7.
IFN-γ responsive elements enhance LTR12C-driven GBP expression. (A) IRF and STAT binding sites in the LTR12C elements of GBP2 (top), GBP5 (bottom) and upstream enhancer sequences as predicted by Homo sapiens Comprehensive Model Collection (HOCOMOCO) (82). (B) HEK293T cells were co-transfected with the BFP reporter plasmids indicated at top and a GFP control vector. Cells were stimulated with the indicated amounts of IFN-γ or left untreated, and BFP MFI were determined two days later. The results of three to four independent experiments are shown (*P <0.05; ** P <0.01; n.s. not significant).
Figure 8.
Figure 8.
GBP2 and GBP5 interfere with HERV-K (HML-2) maturation and reduce HERV-K (HML-2) pseudovirion infectivity. (A) HEK293T cells were co-transfected with an env-deficient lentiviral luciferase reporter construct (pSIvec1ΔenvLuc) and expression plasmids for HIV-1 Rev, the indicated GBPs and either HERV-K Env Δ659–699 (left) or VSV G (right). Two days post transfection, cell culture supernatants were harvested, and infectious pseudovirion yield was determined by infecting CRFK cells and quantifying luciferase activity three days later. Mean values of 2–3 independent experiments ± SEM are shown (**P <0.01; **** P <0.0001). A cartoon illustrating HERV-K and VSV pseudoparticles is shown on top. (B) To calculate HERV-K pseudovirion infectivity, total infectious yield of the samples shown in (A) was normalized to the amount of p27 capsid as determined by ELISA. Mean values of 3 independent experiments ± SEM are shown (**P <0.01; **** P <0.0001). (C) HEK293T cells were described in (A). Two days post transfection, cells were harvested and expression of HERV-K Env, GBP and GAPDH was determined by Western blotting. Blue arrows indicate a shift in the electrophoretic mobility of HERV-K Env in the presence of GBP2 and GBP5. Cleavage efficiency of HERV-K Env was quantified by determining the ratio of cleaved to total Env. The quantification of 4 independent blots ± SEM is shown on the left (** P <0.01; *** P <0.0001; **** P <0.0001). One representative Western blot is shown on the right.

References

    1. Johnson W.E. Origins and evolutionary consequences of ancient endogenous retroviruses. Nat. Rev. Microbiol. 2019; 17:355–370. - PubMed
    1. Groh S., Schotta G.. Silencing of endogenous retroviruses by heterochromatin. Cell. Mol. Life Sci. CMLS. 2017; 74:2055–2065. - PMC - PubMed
    1. Gemmell P., Hein J., Katzourakis A.. Phylogenetic analysis reveals that ERVs ‘Die Young’ but HERV-H is unusually conserved. PLoS Comput. Biol. 2016; 12:e1004964. - PMC - PubMed
    1. Belshaw R., Watson J., Katzourakis A., Howe A., Woolven-Allen J., Burt A., Tristem M.. Rate of recombinational deletion among human endogenous retroviruses. J. Virol. 2007; 81:9437–9442. - PMC - PubMed
    1. Mi S., Lee X., Li X., Veldman G.M., Finnerty H., Racie L., LaVallie E., Tang X.Y., Edouard P., Howes S. et al. .. Syncytin is a captive retroviral envelope protein involved in human placental morphogenesis. Nature. 2000; 403:785–789. - PubMed

Publication types