. 2021 Apr 15;203(8):1006-1022.
doi: 10.1164/rccm.202006-2169OC.

Single-Cell Study of Two Rat Models of Pulmonary Arterial Hypertension Reveals Connections to Human Pathobiology and Drug Repositioning

Affiliations

Single-Cell Study of Two Rat Models of Pulmonary Arterial Hypertension Reveals Connections to Human Pathobiology and Drug Repositioning

Jason Hong et al. Am J Respir Crit Care Med. .

Abstract

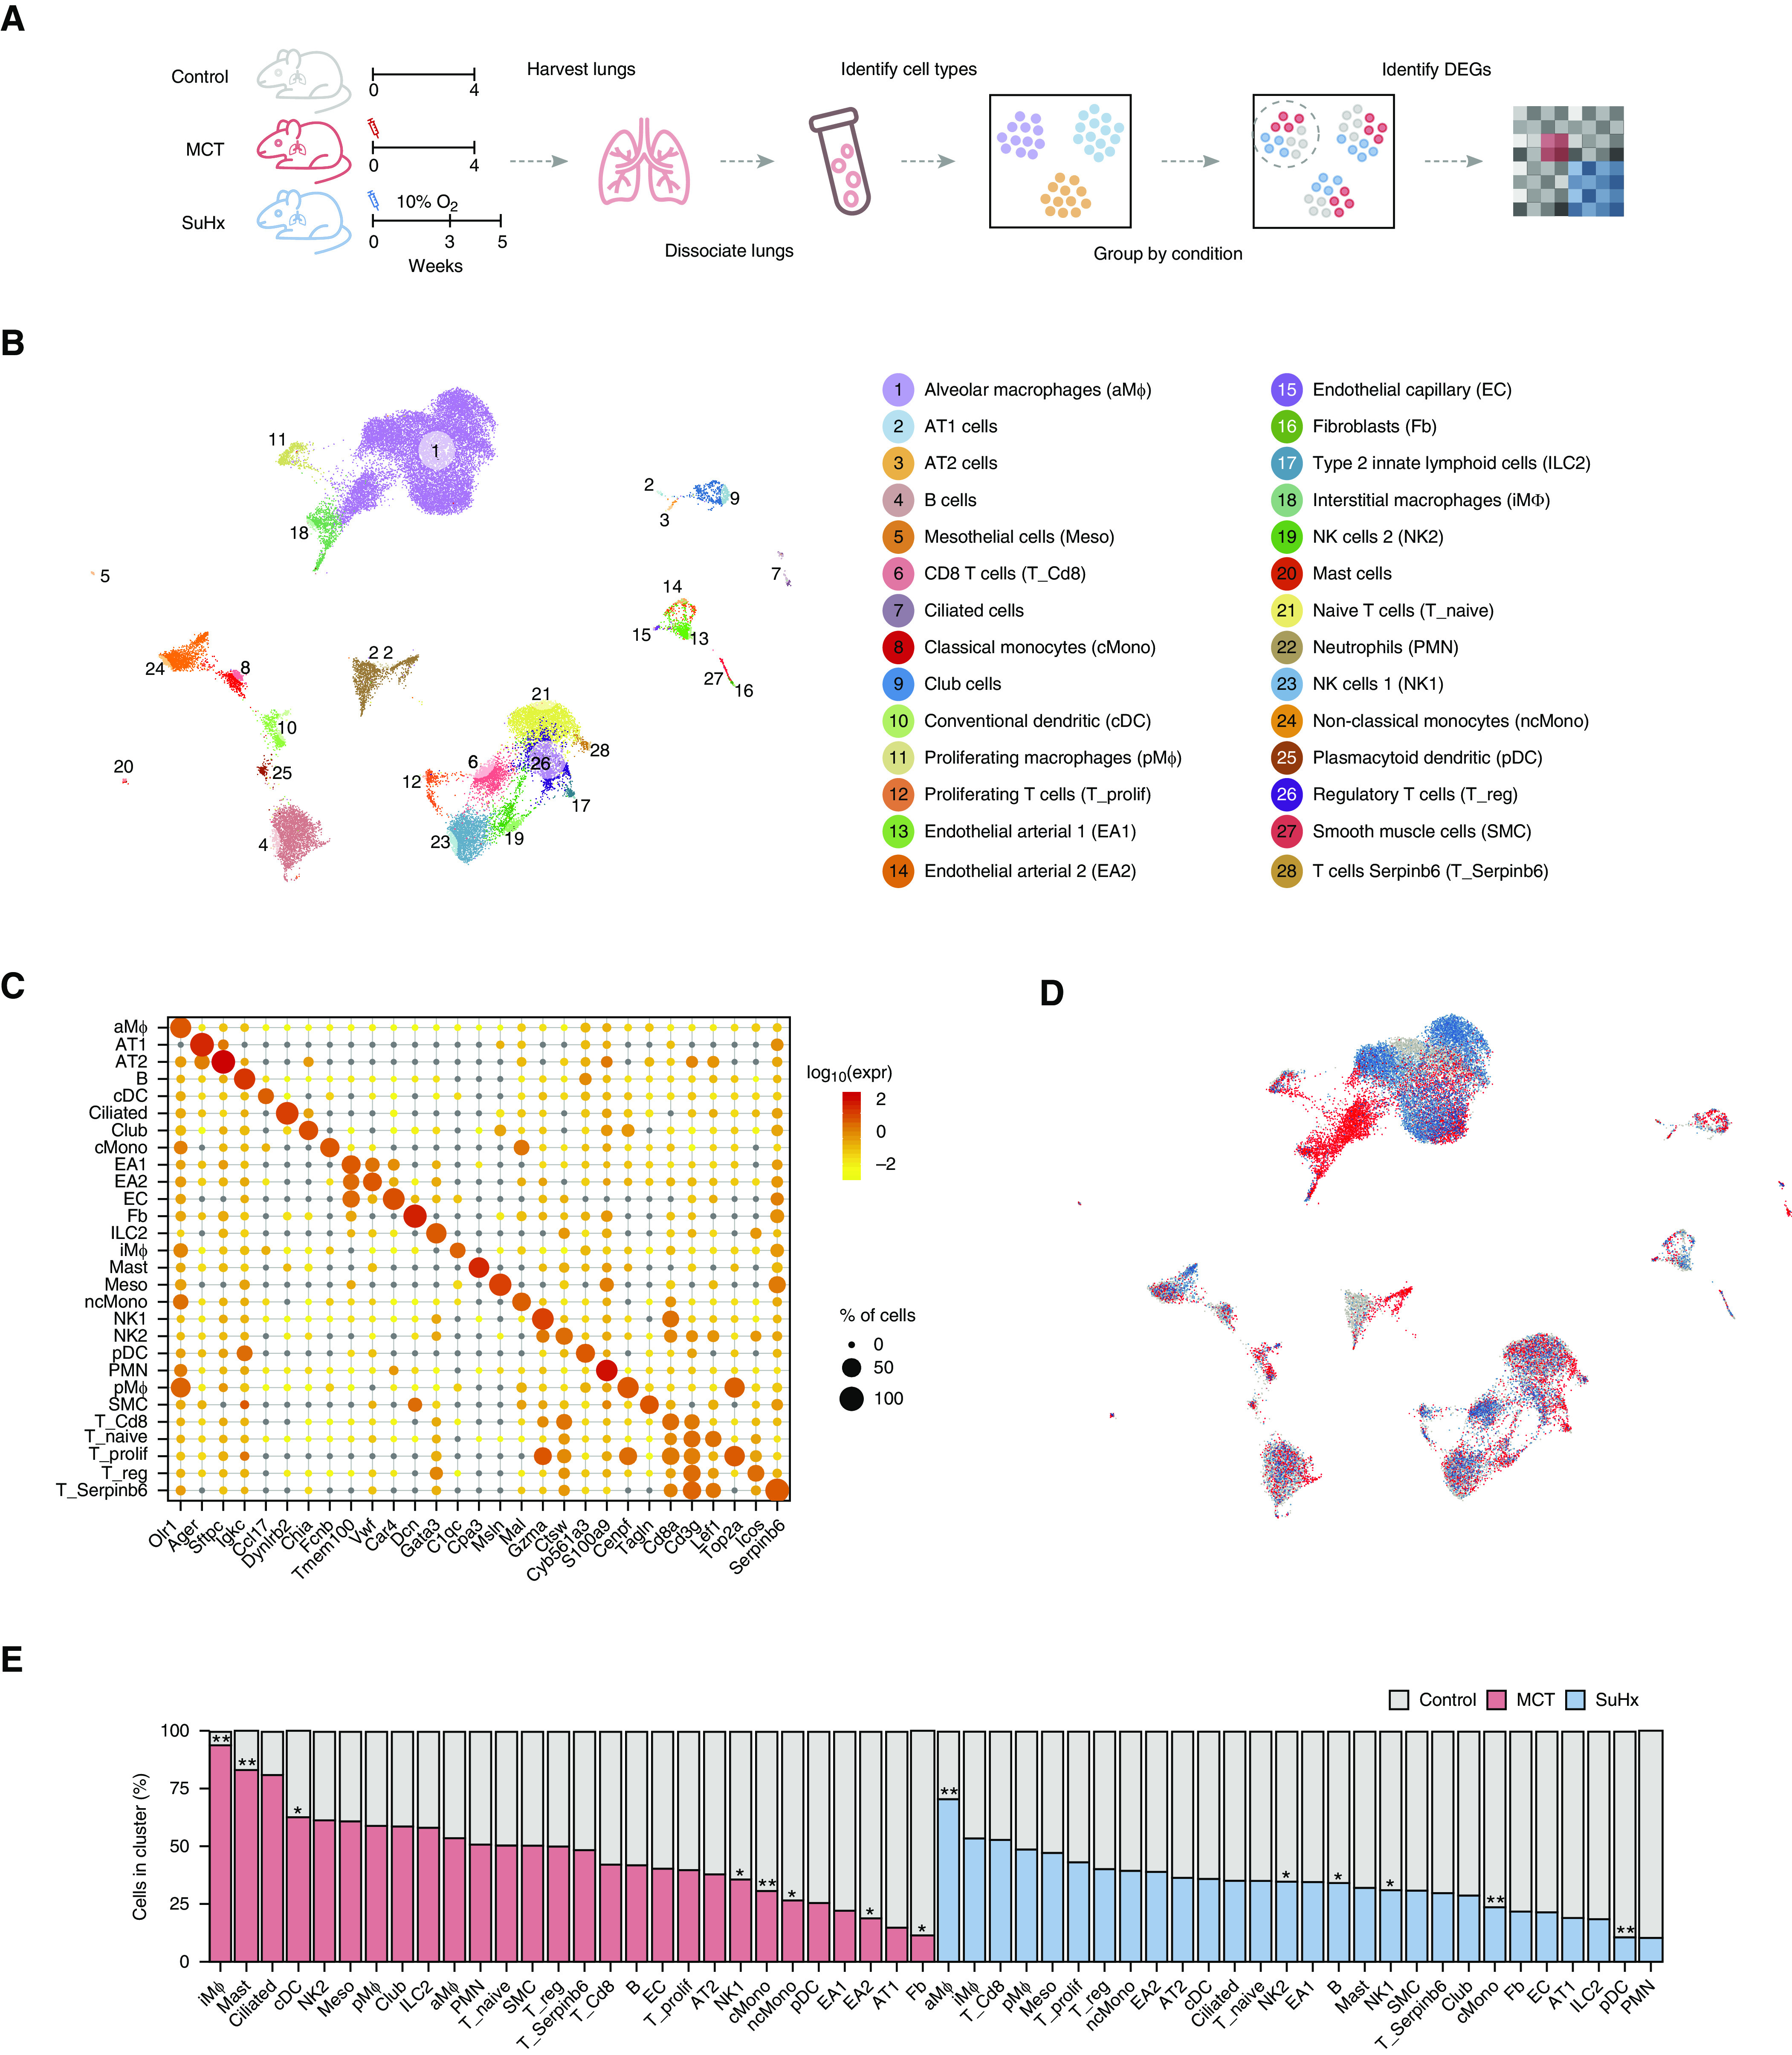
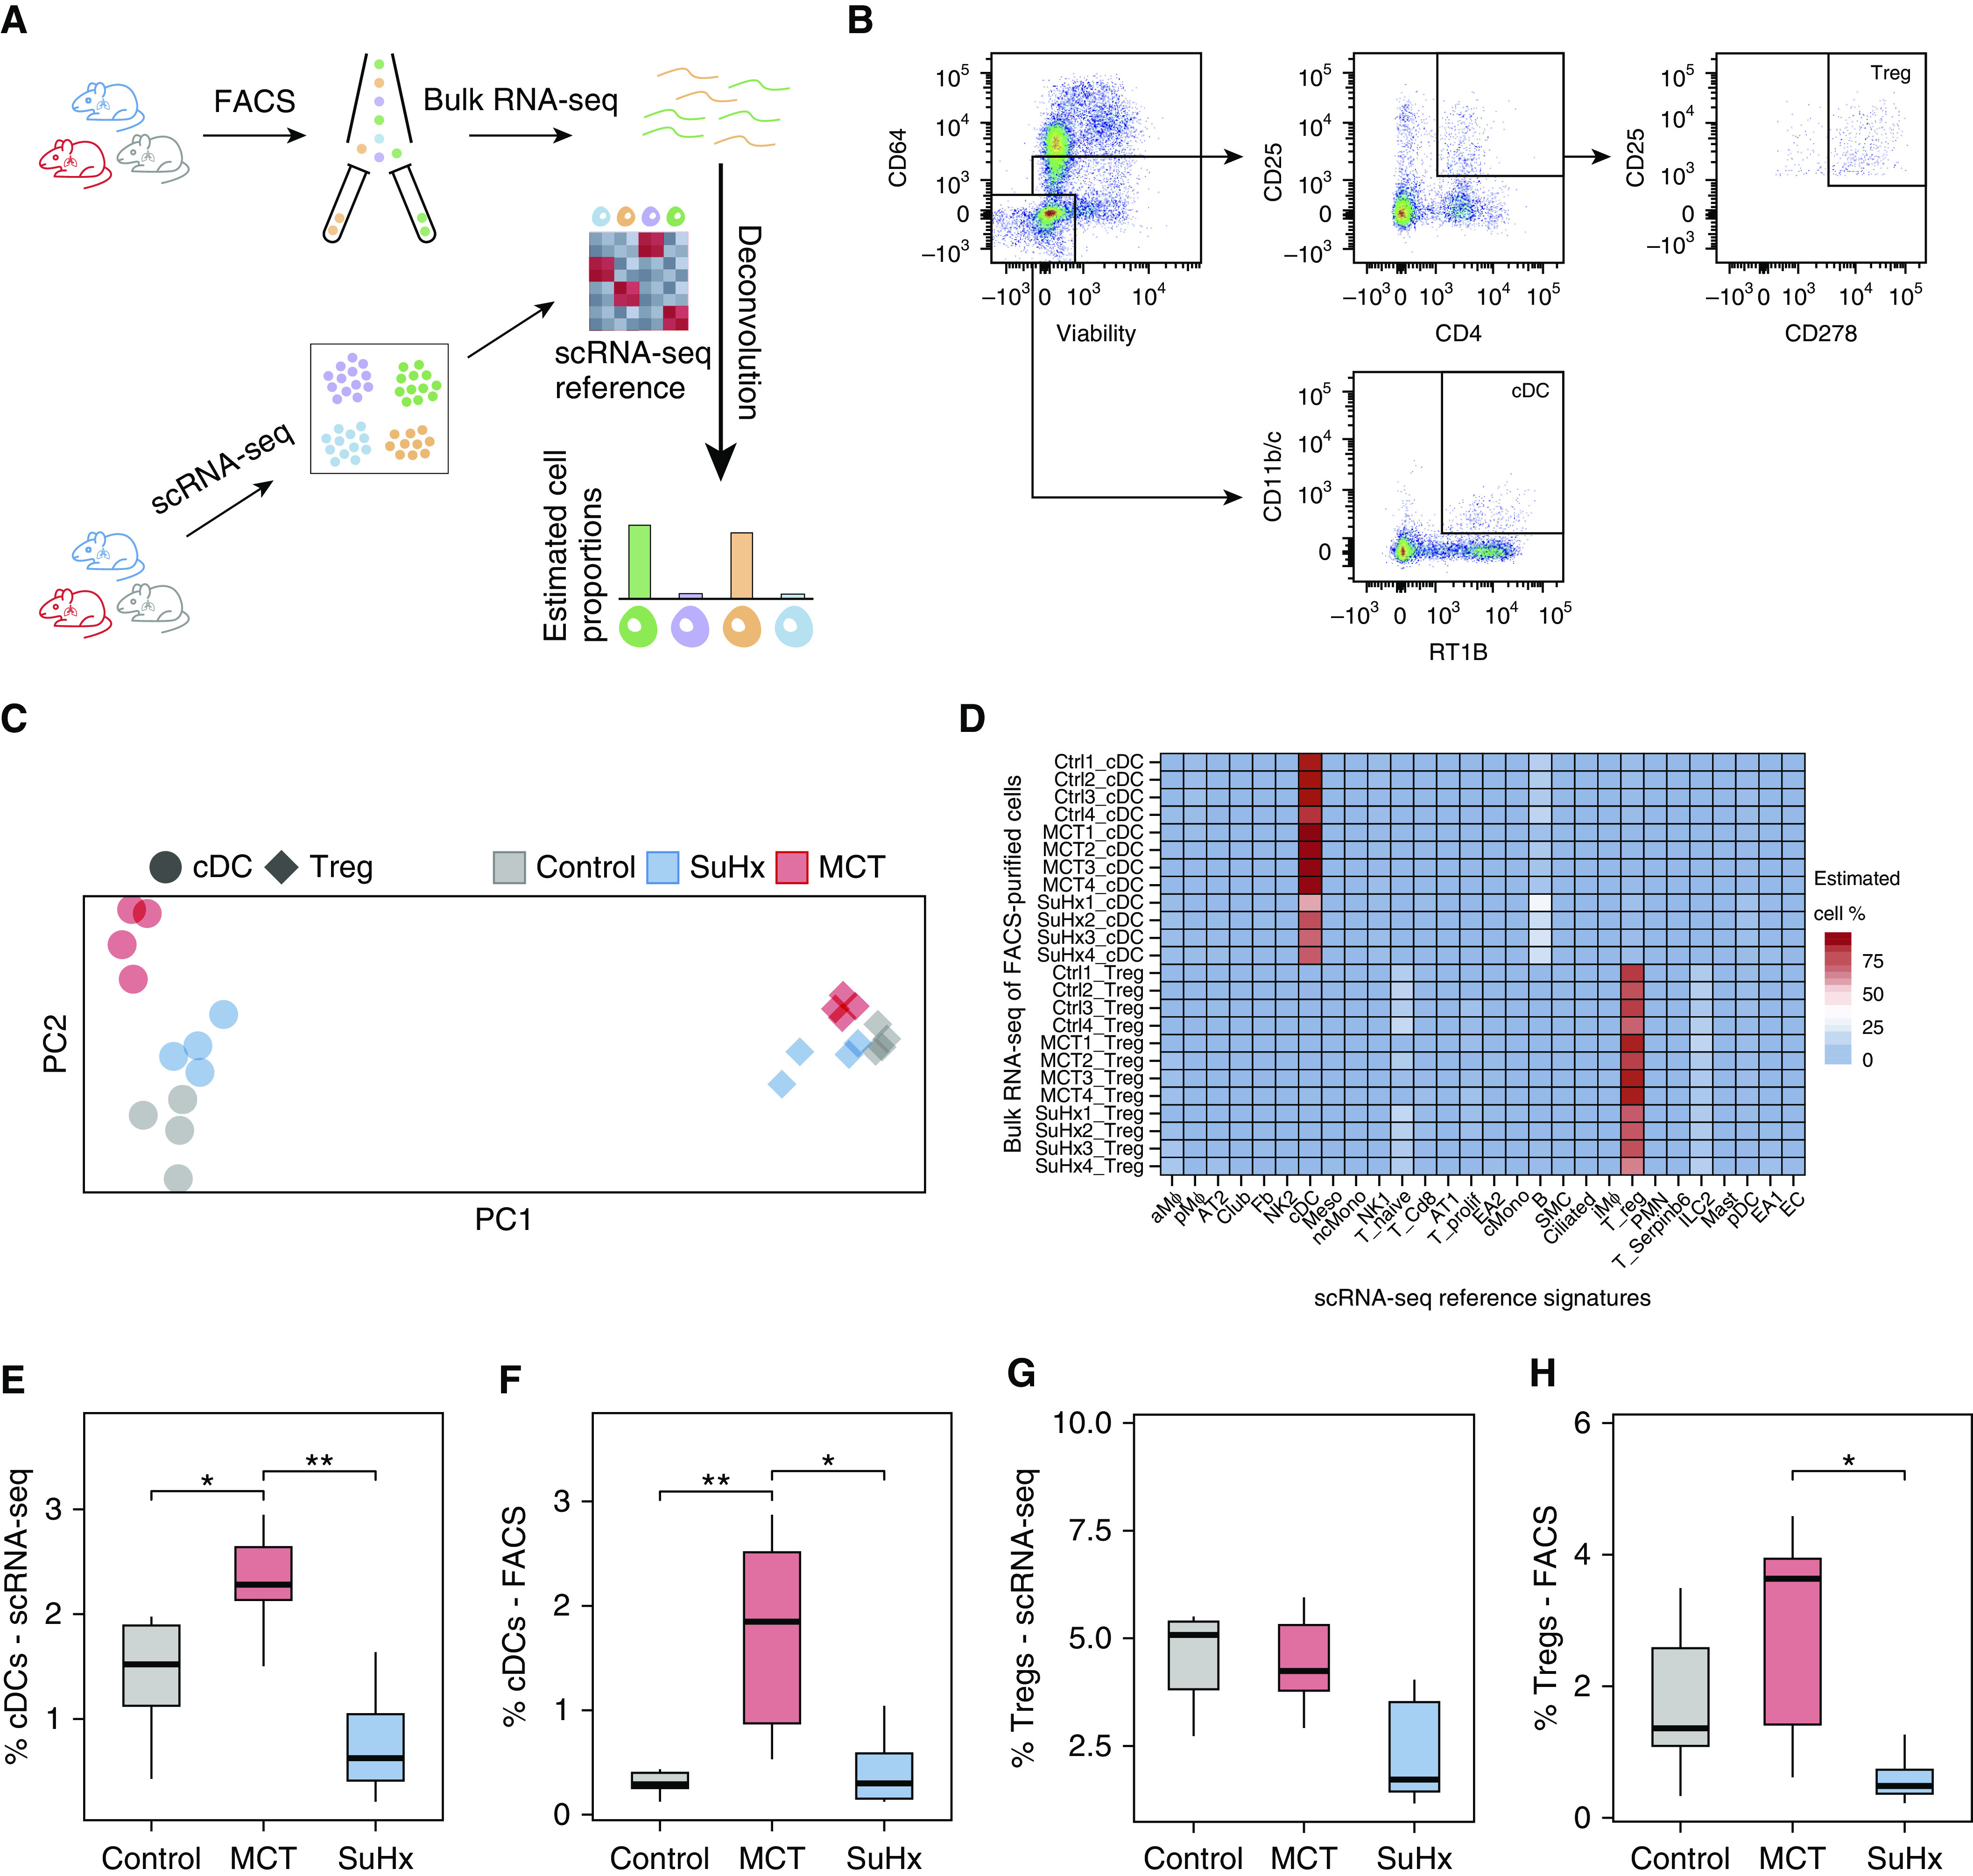
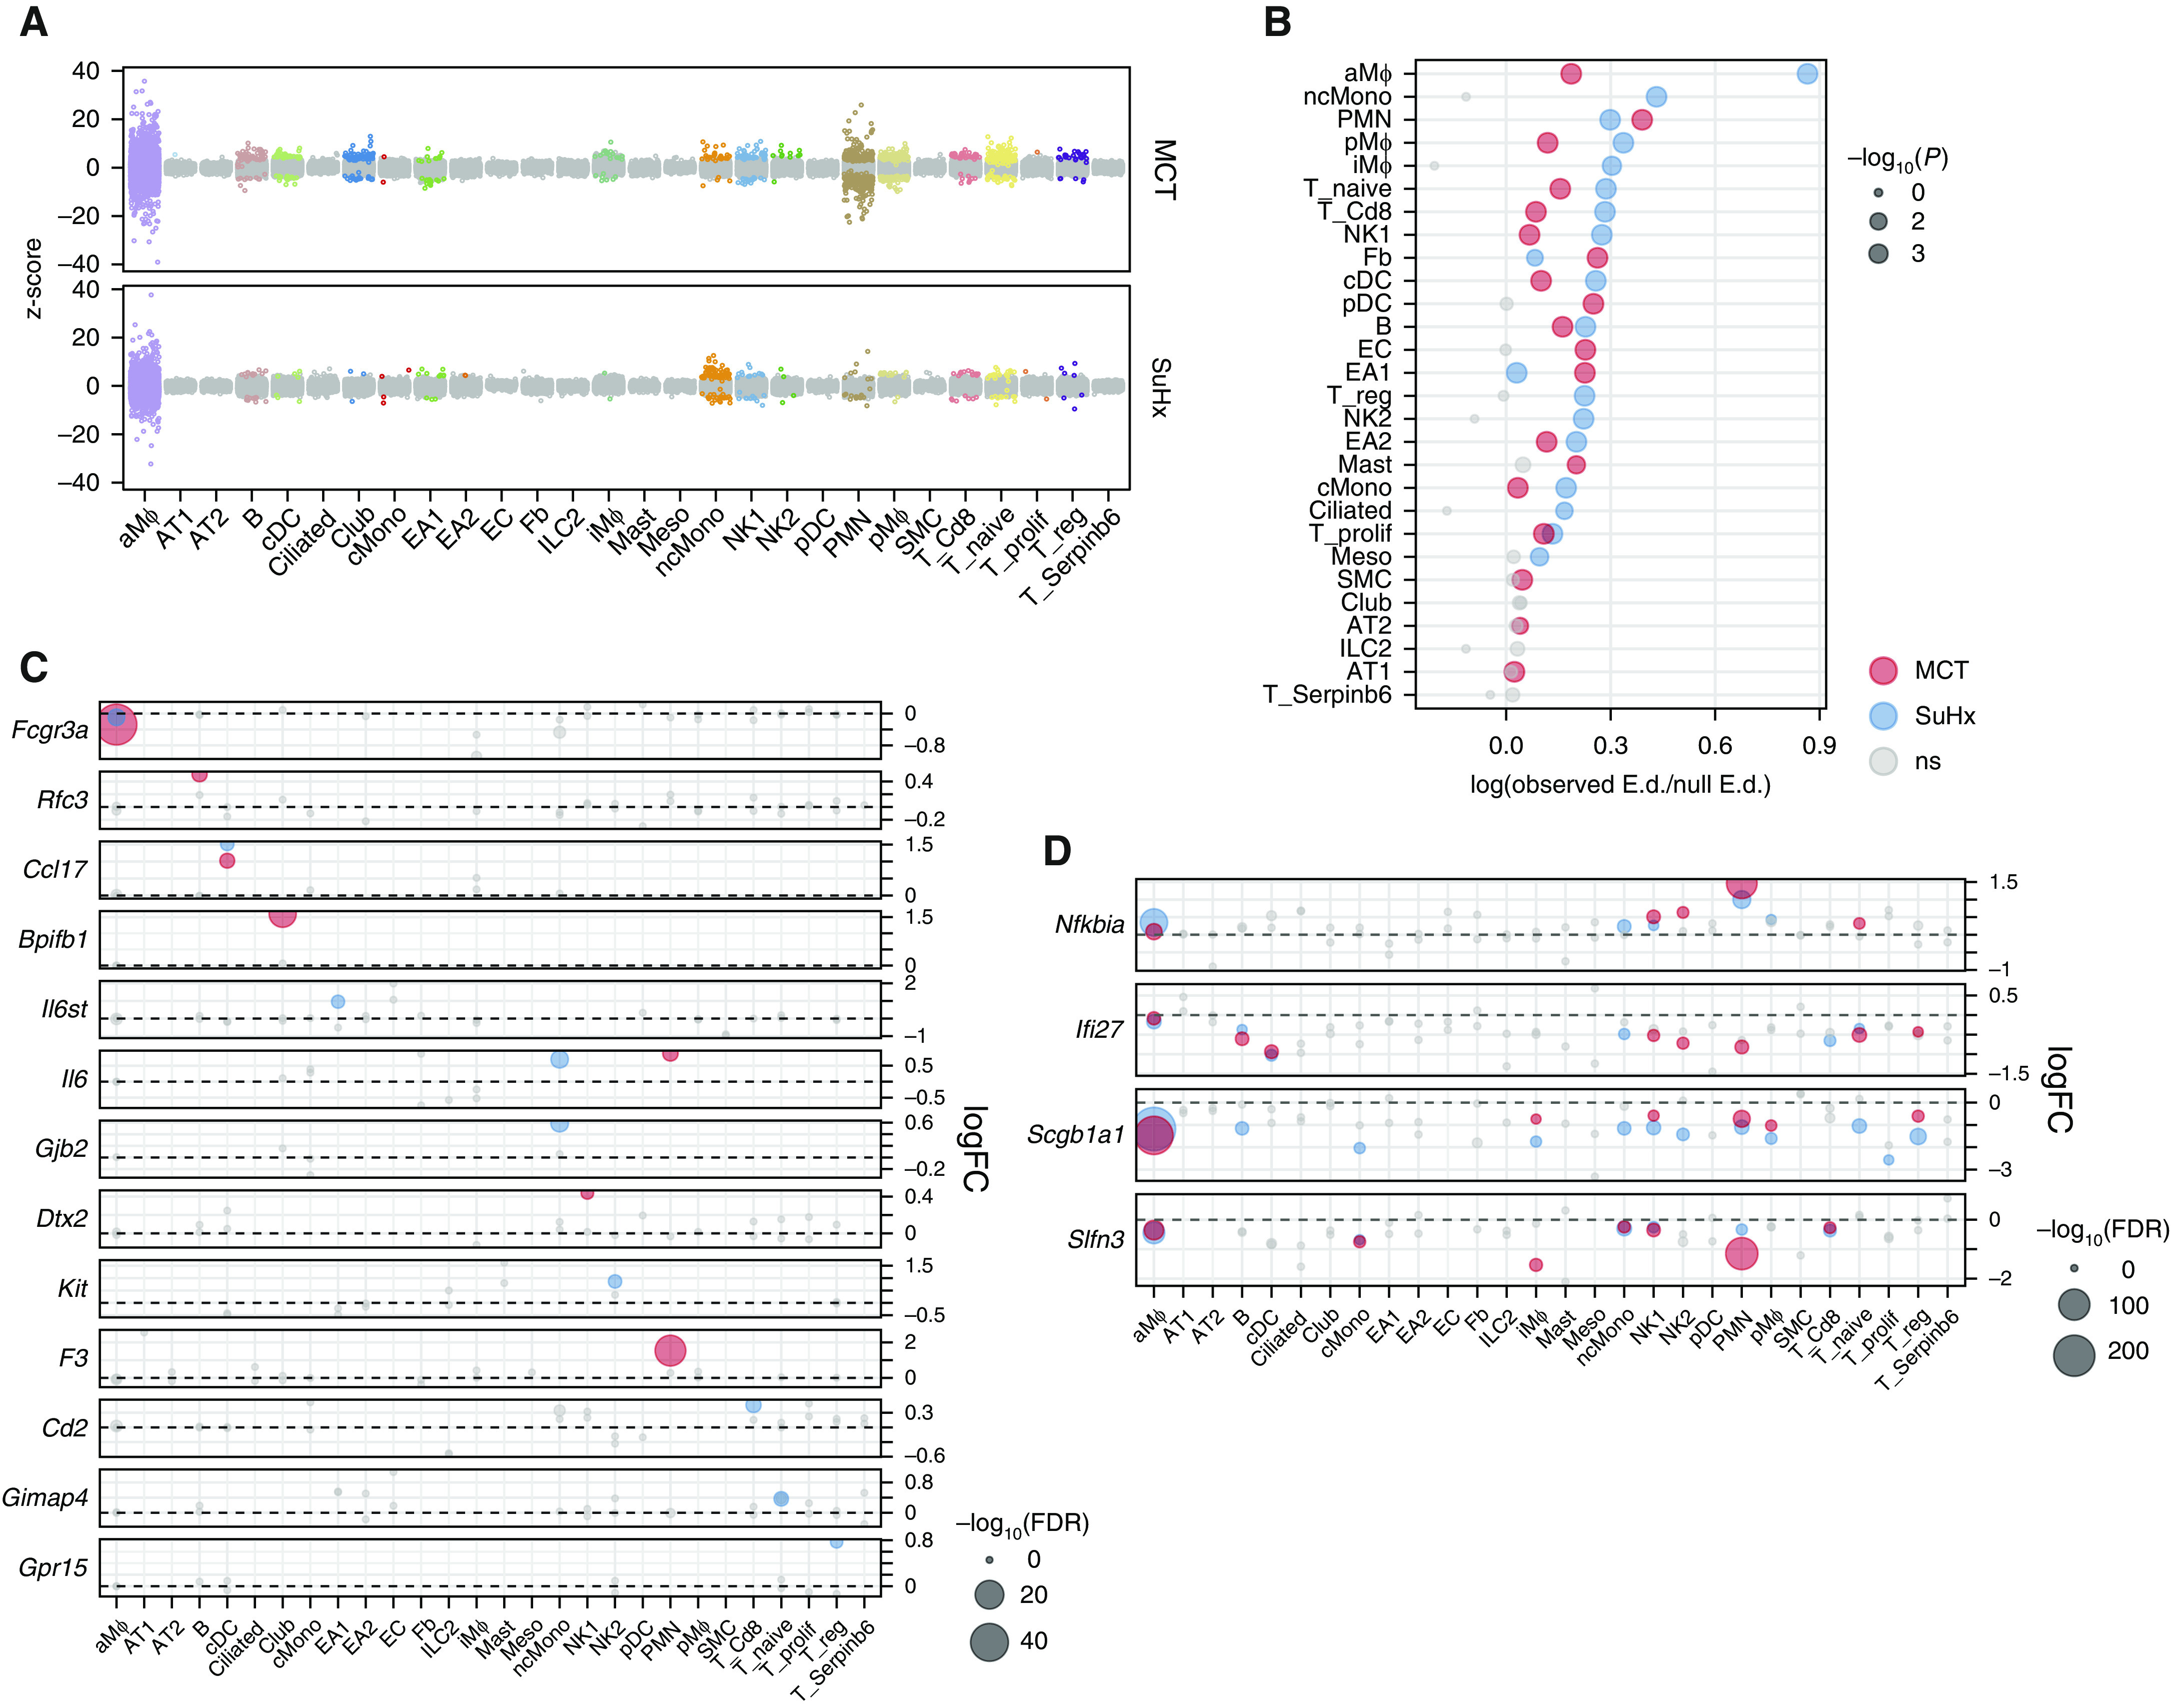
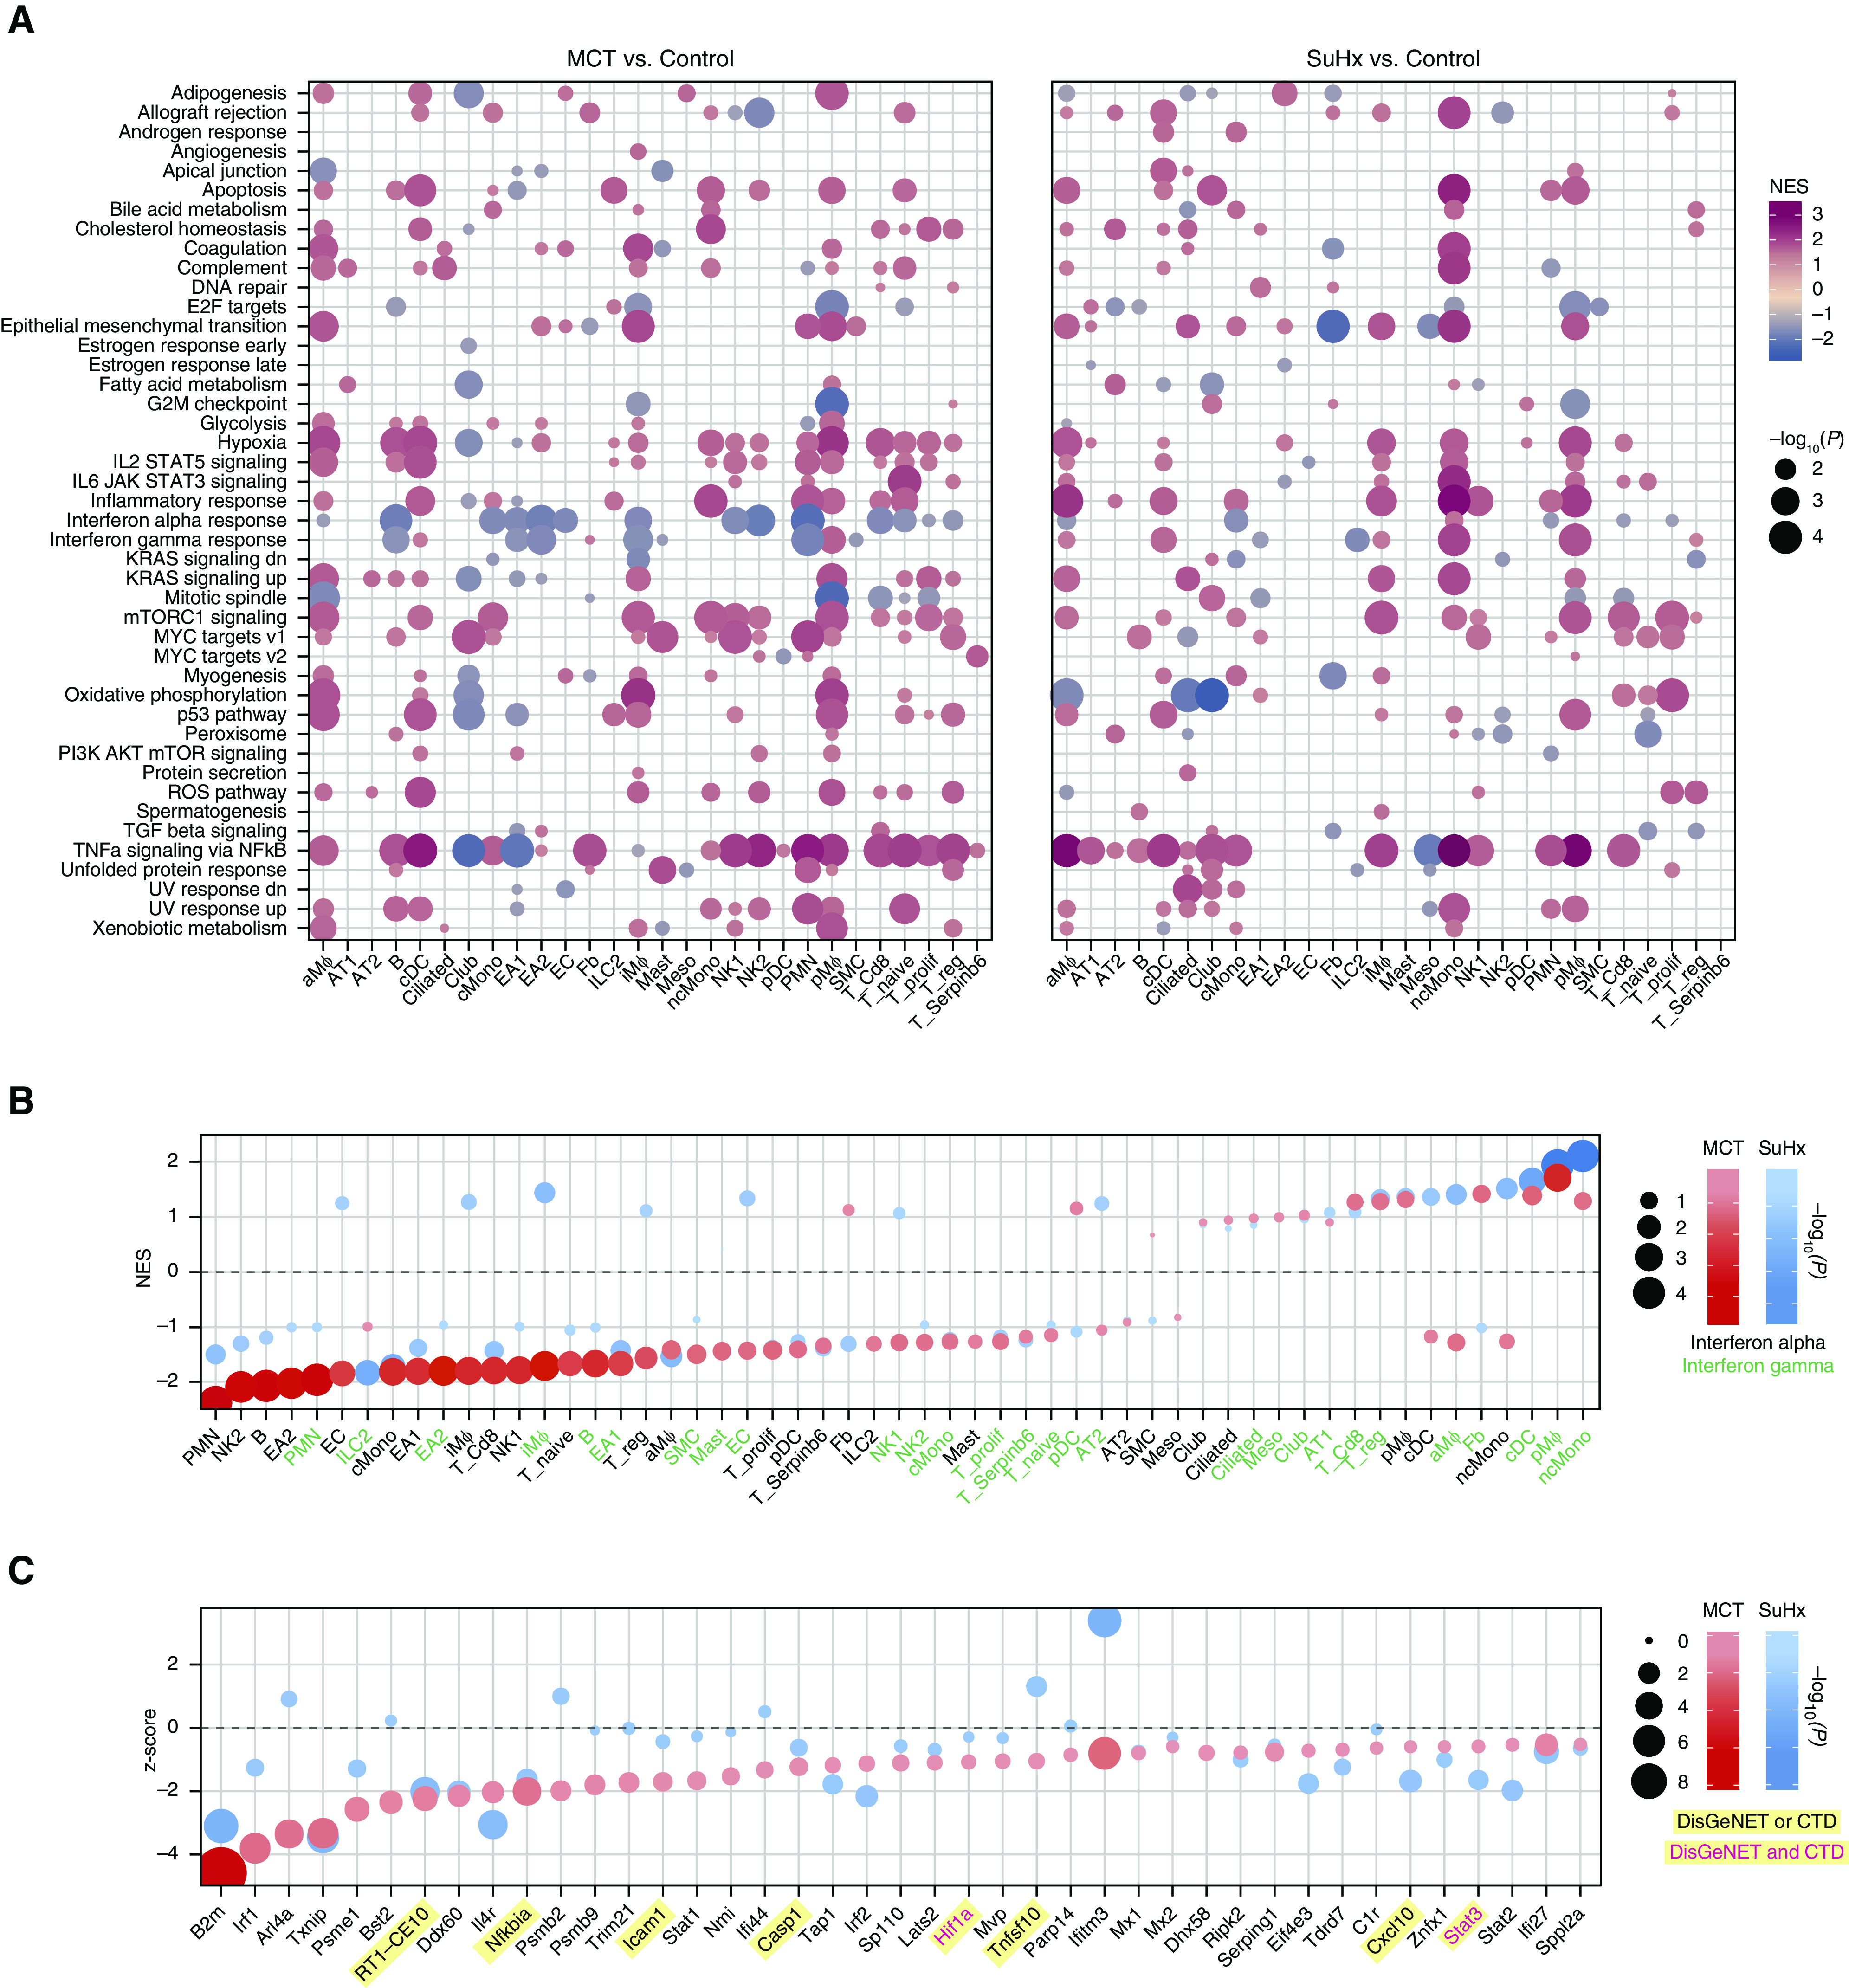
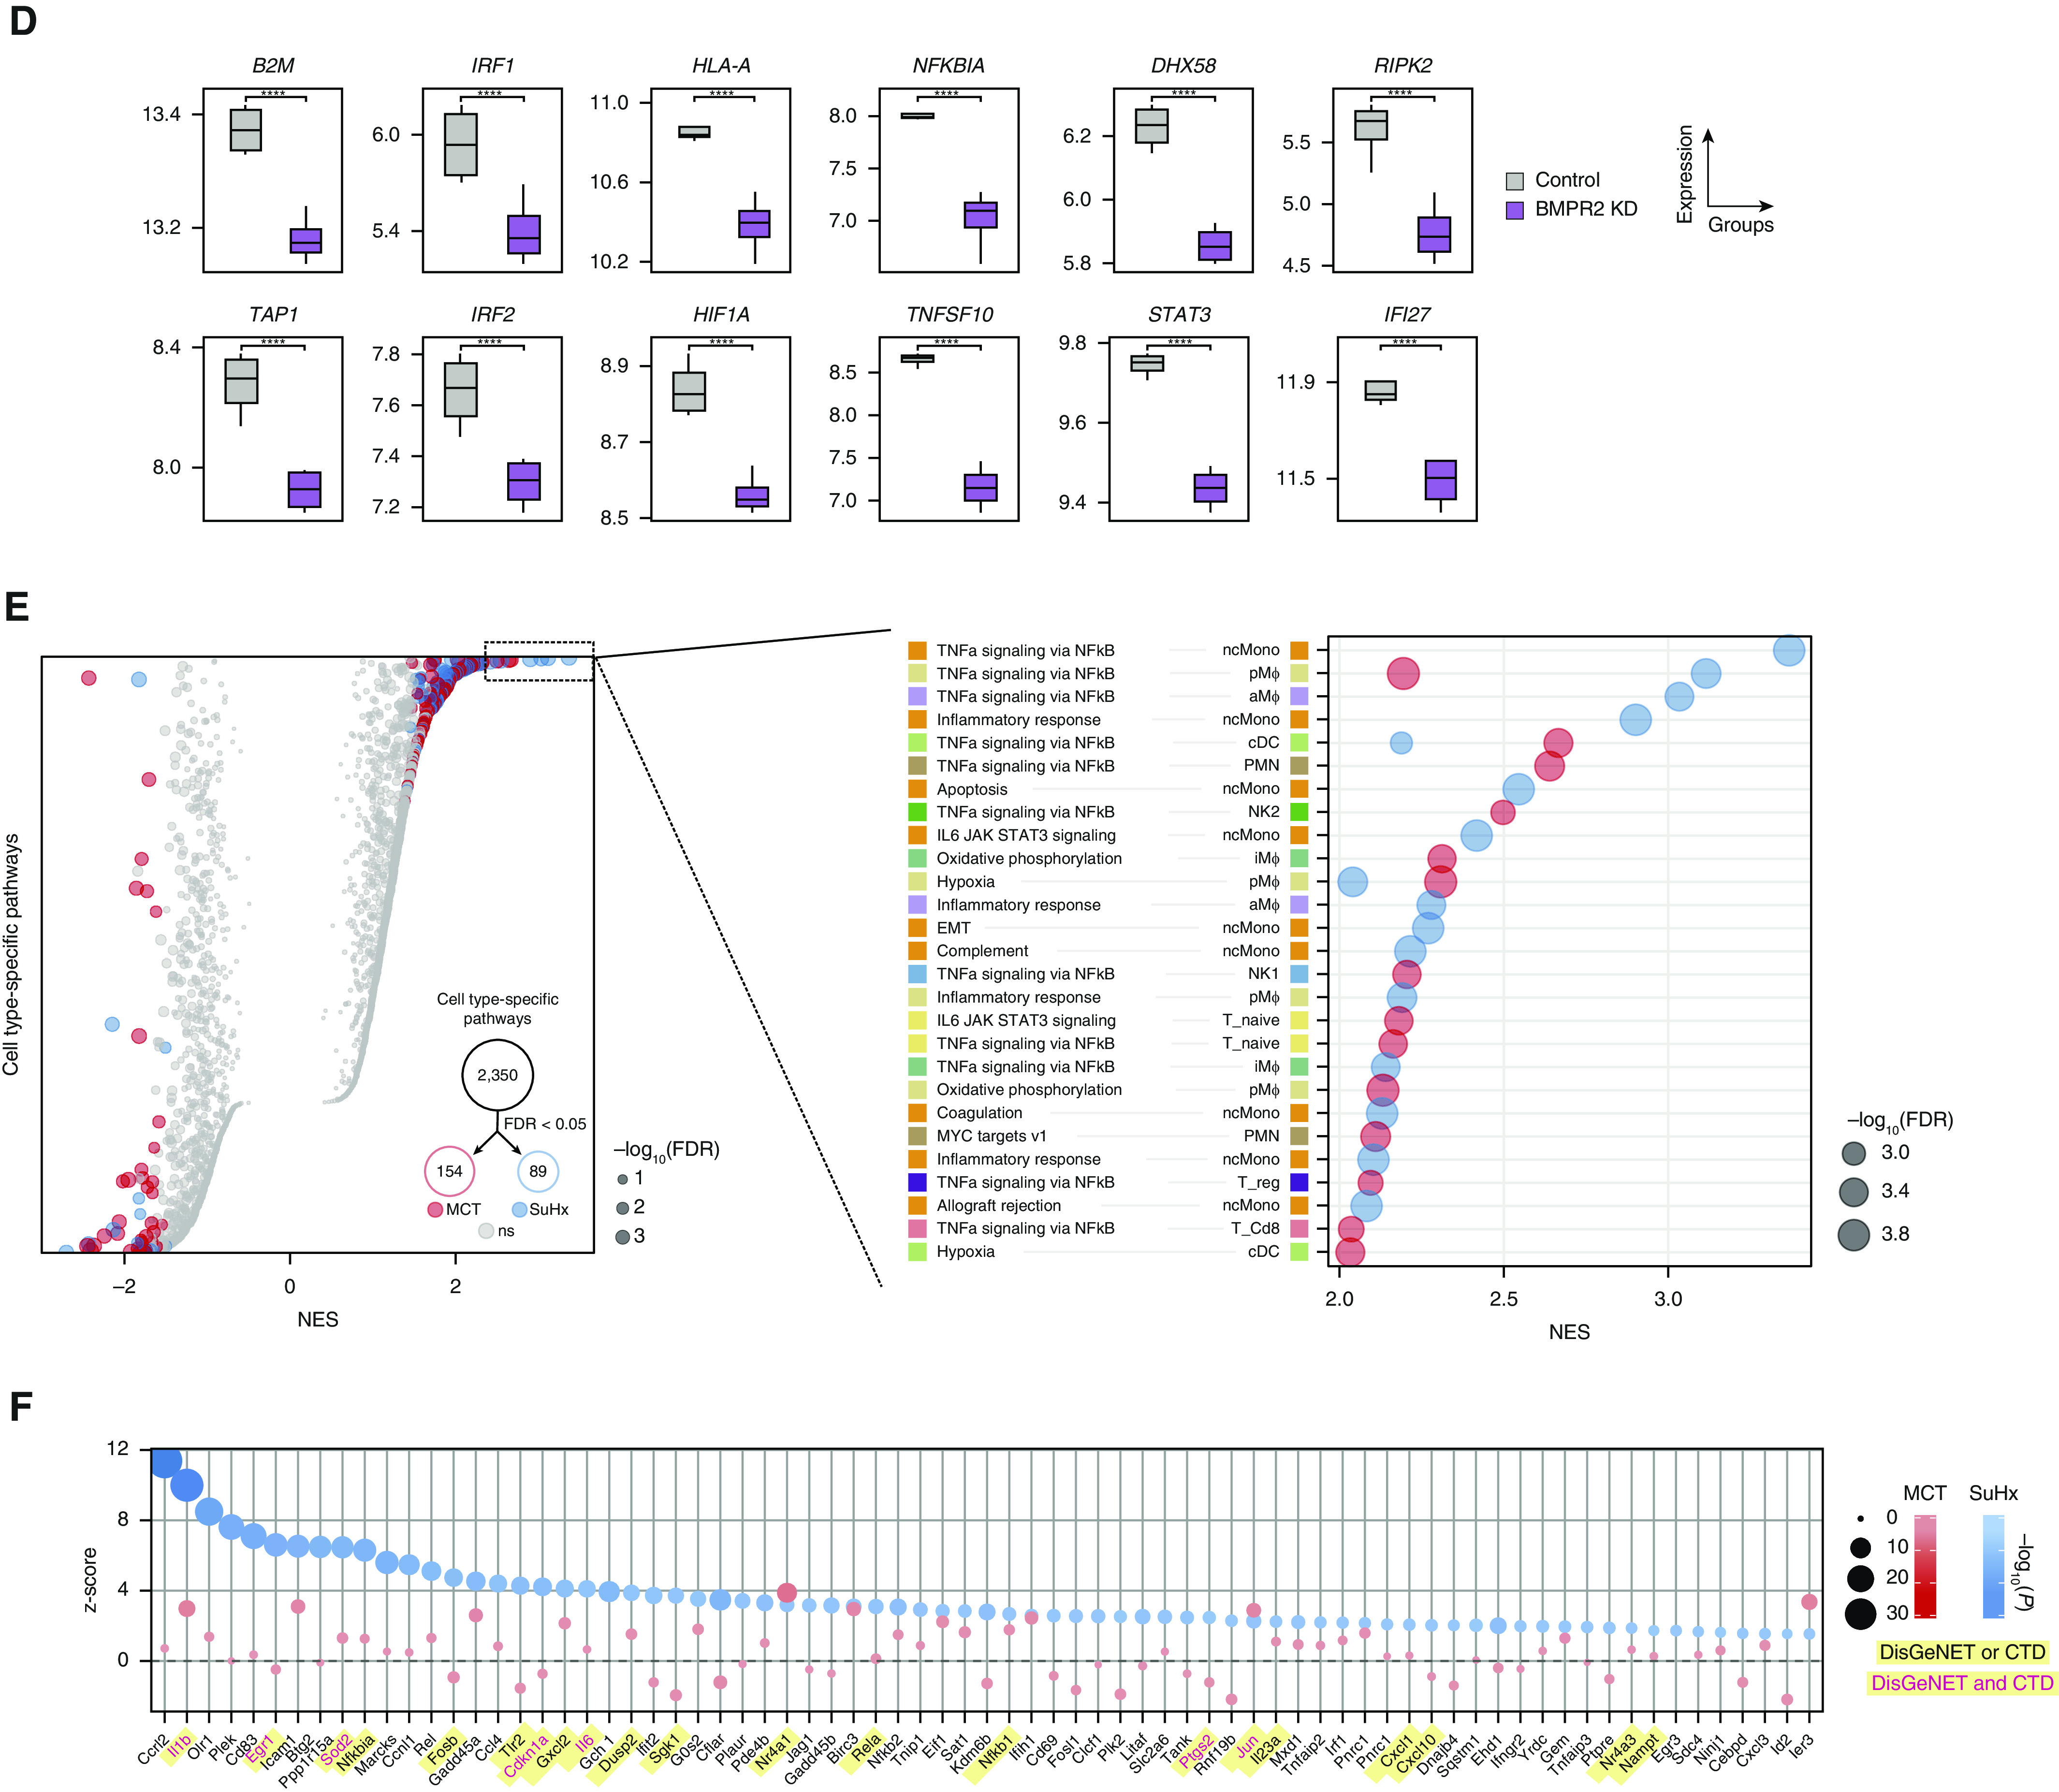
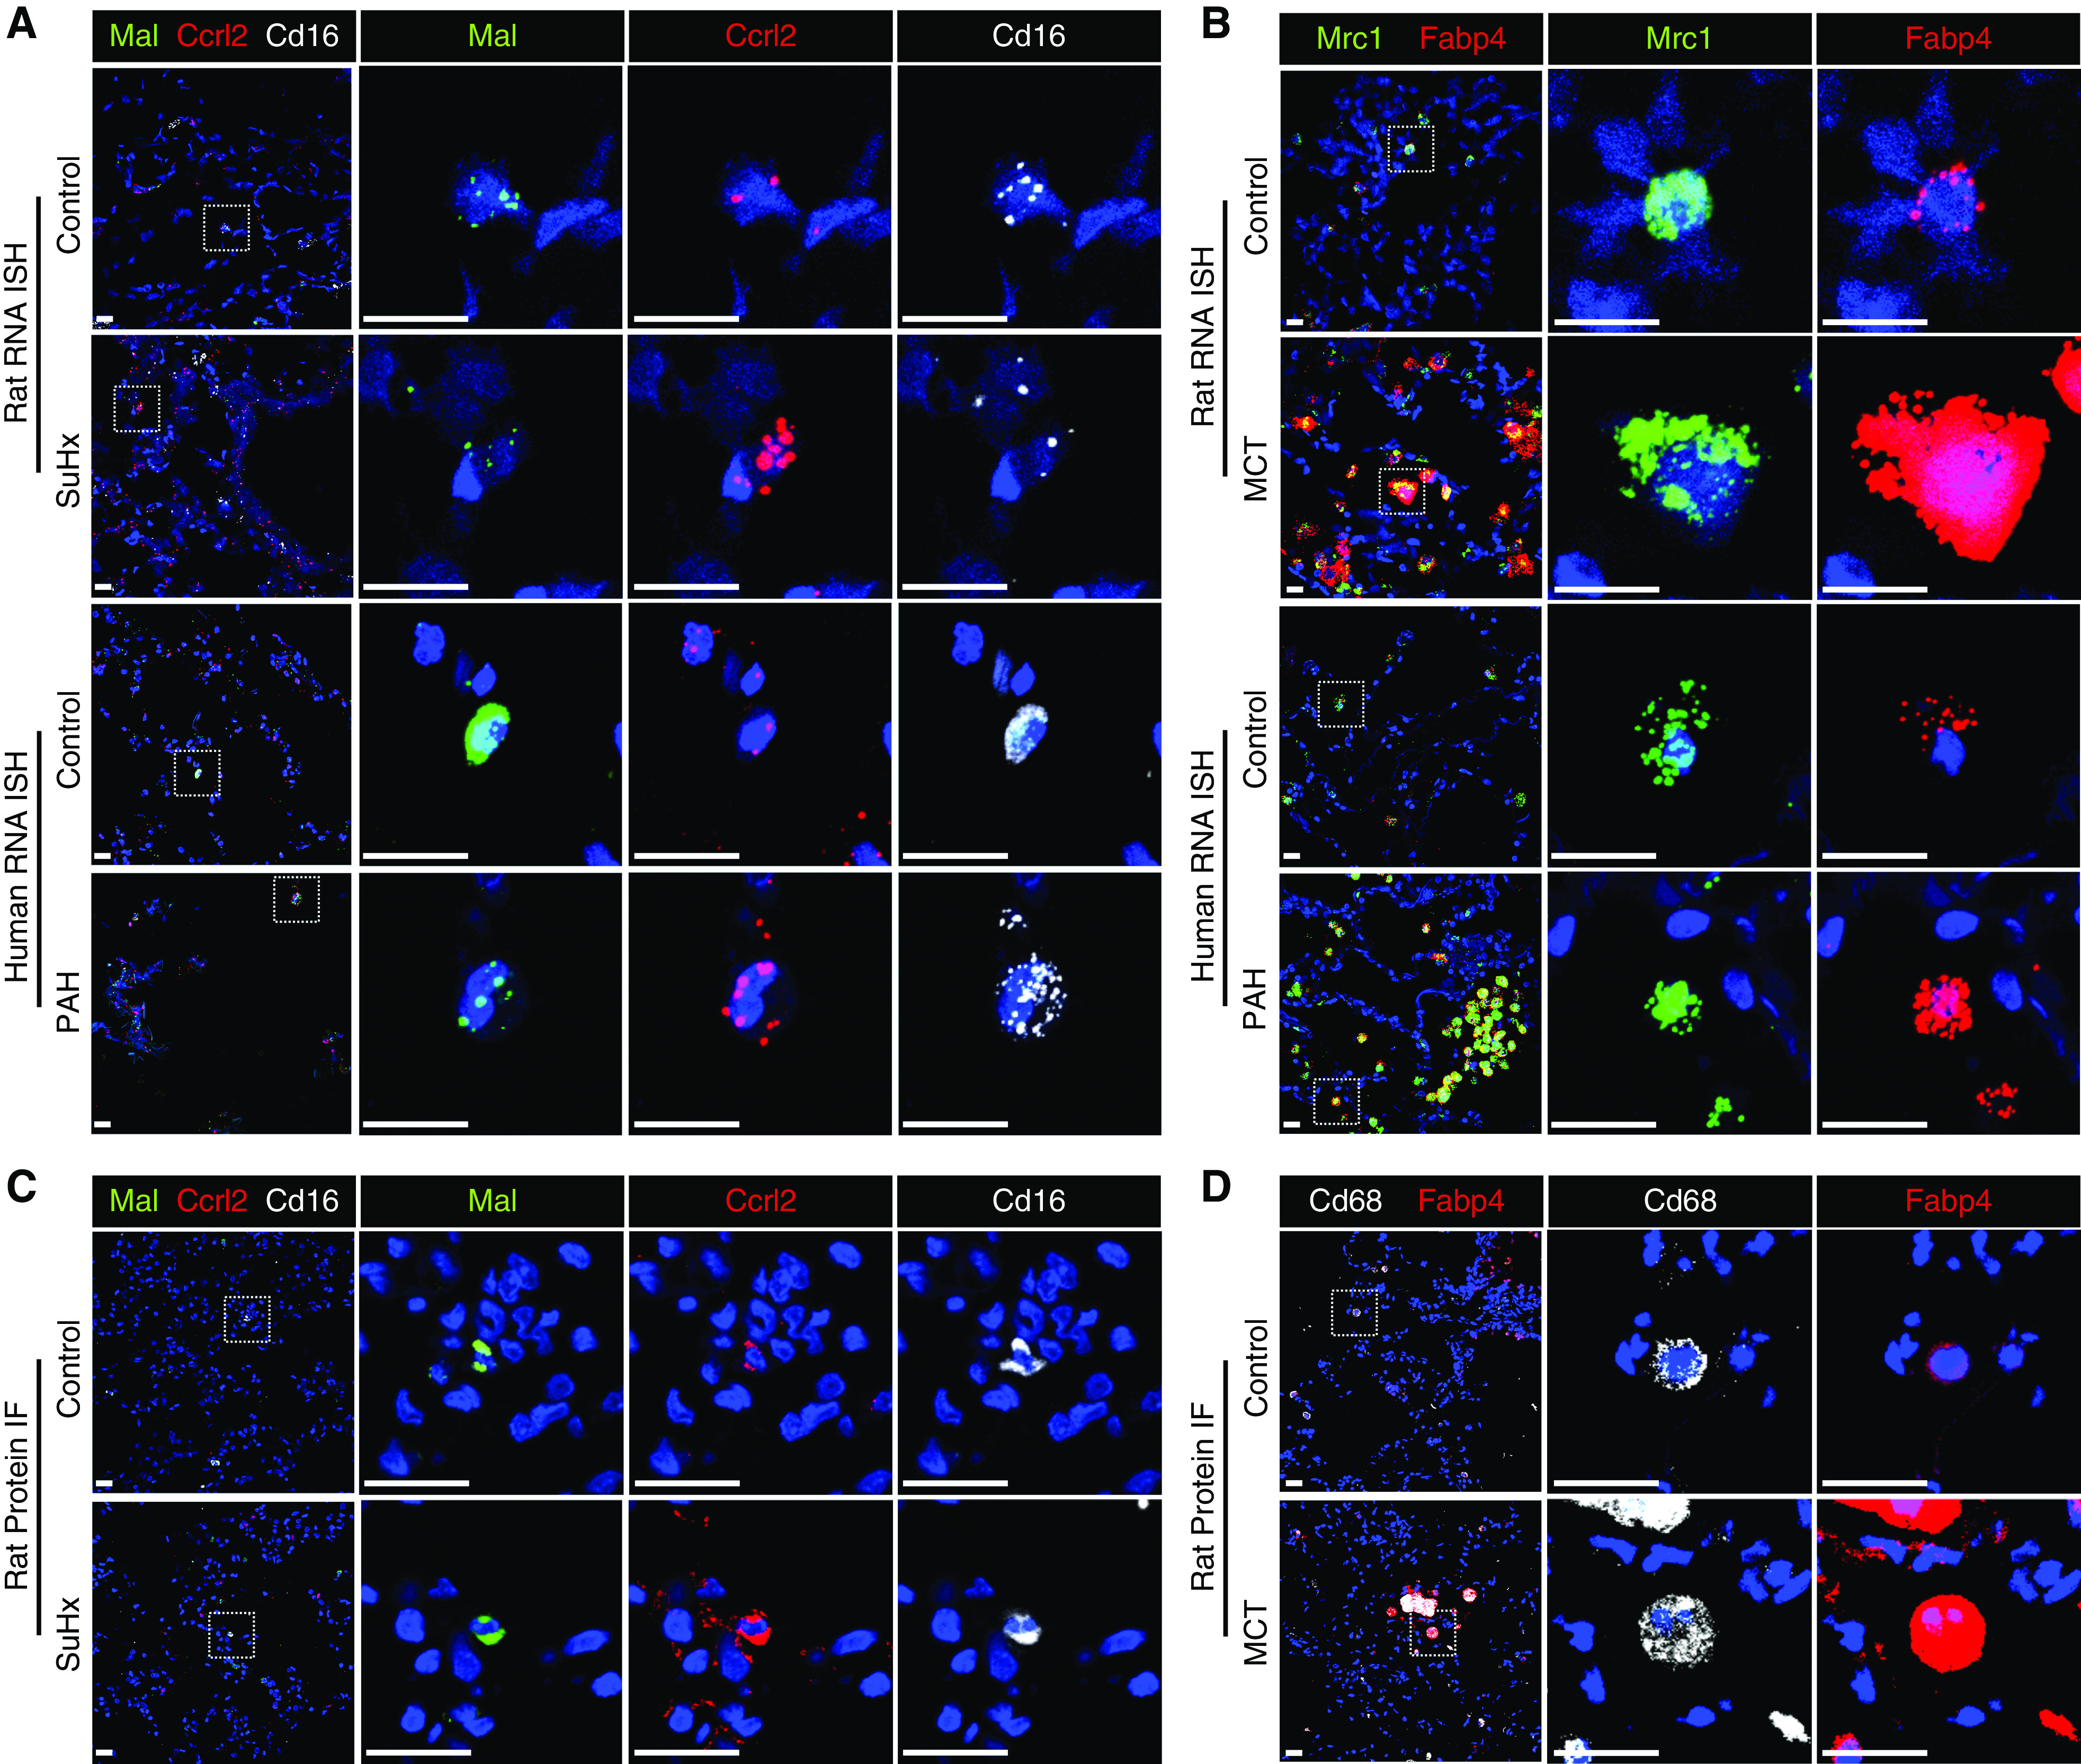
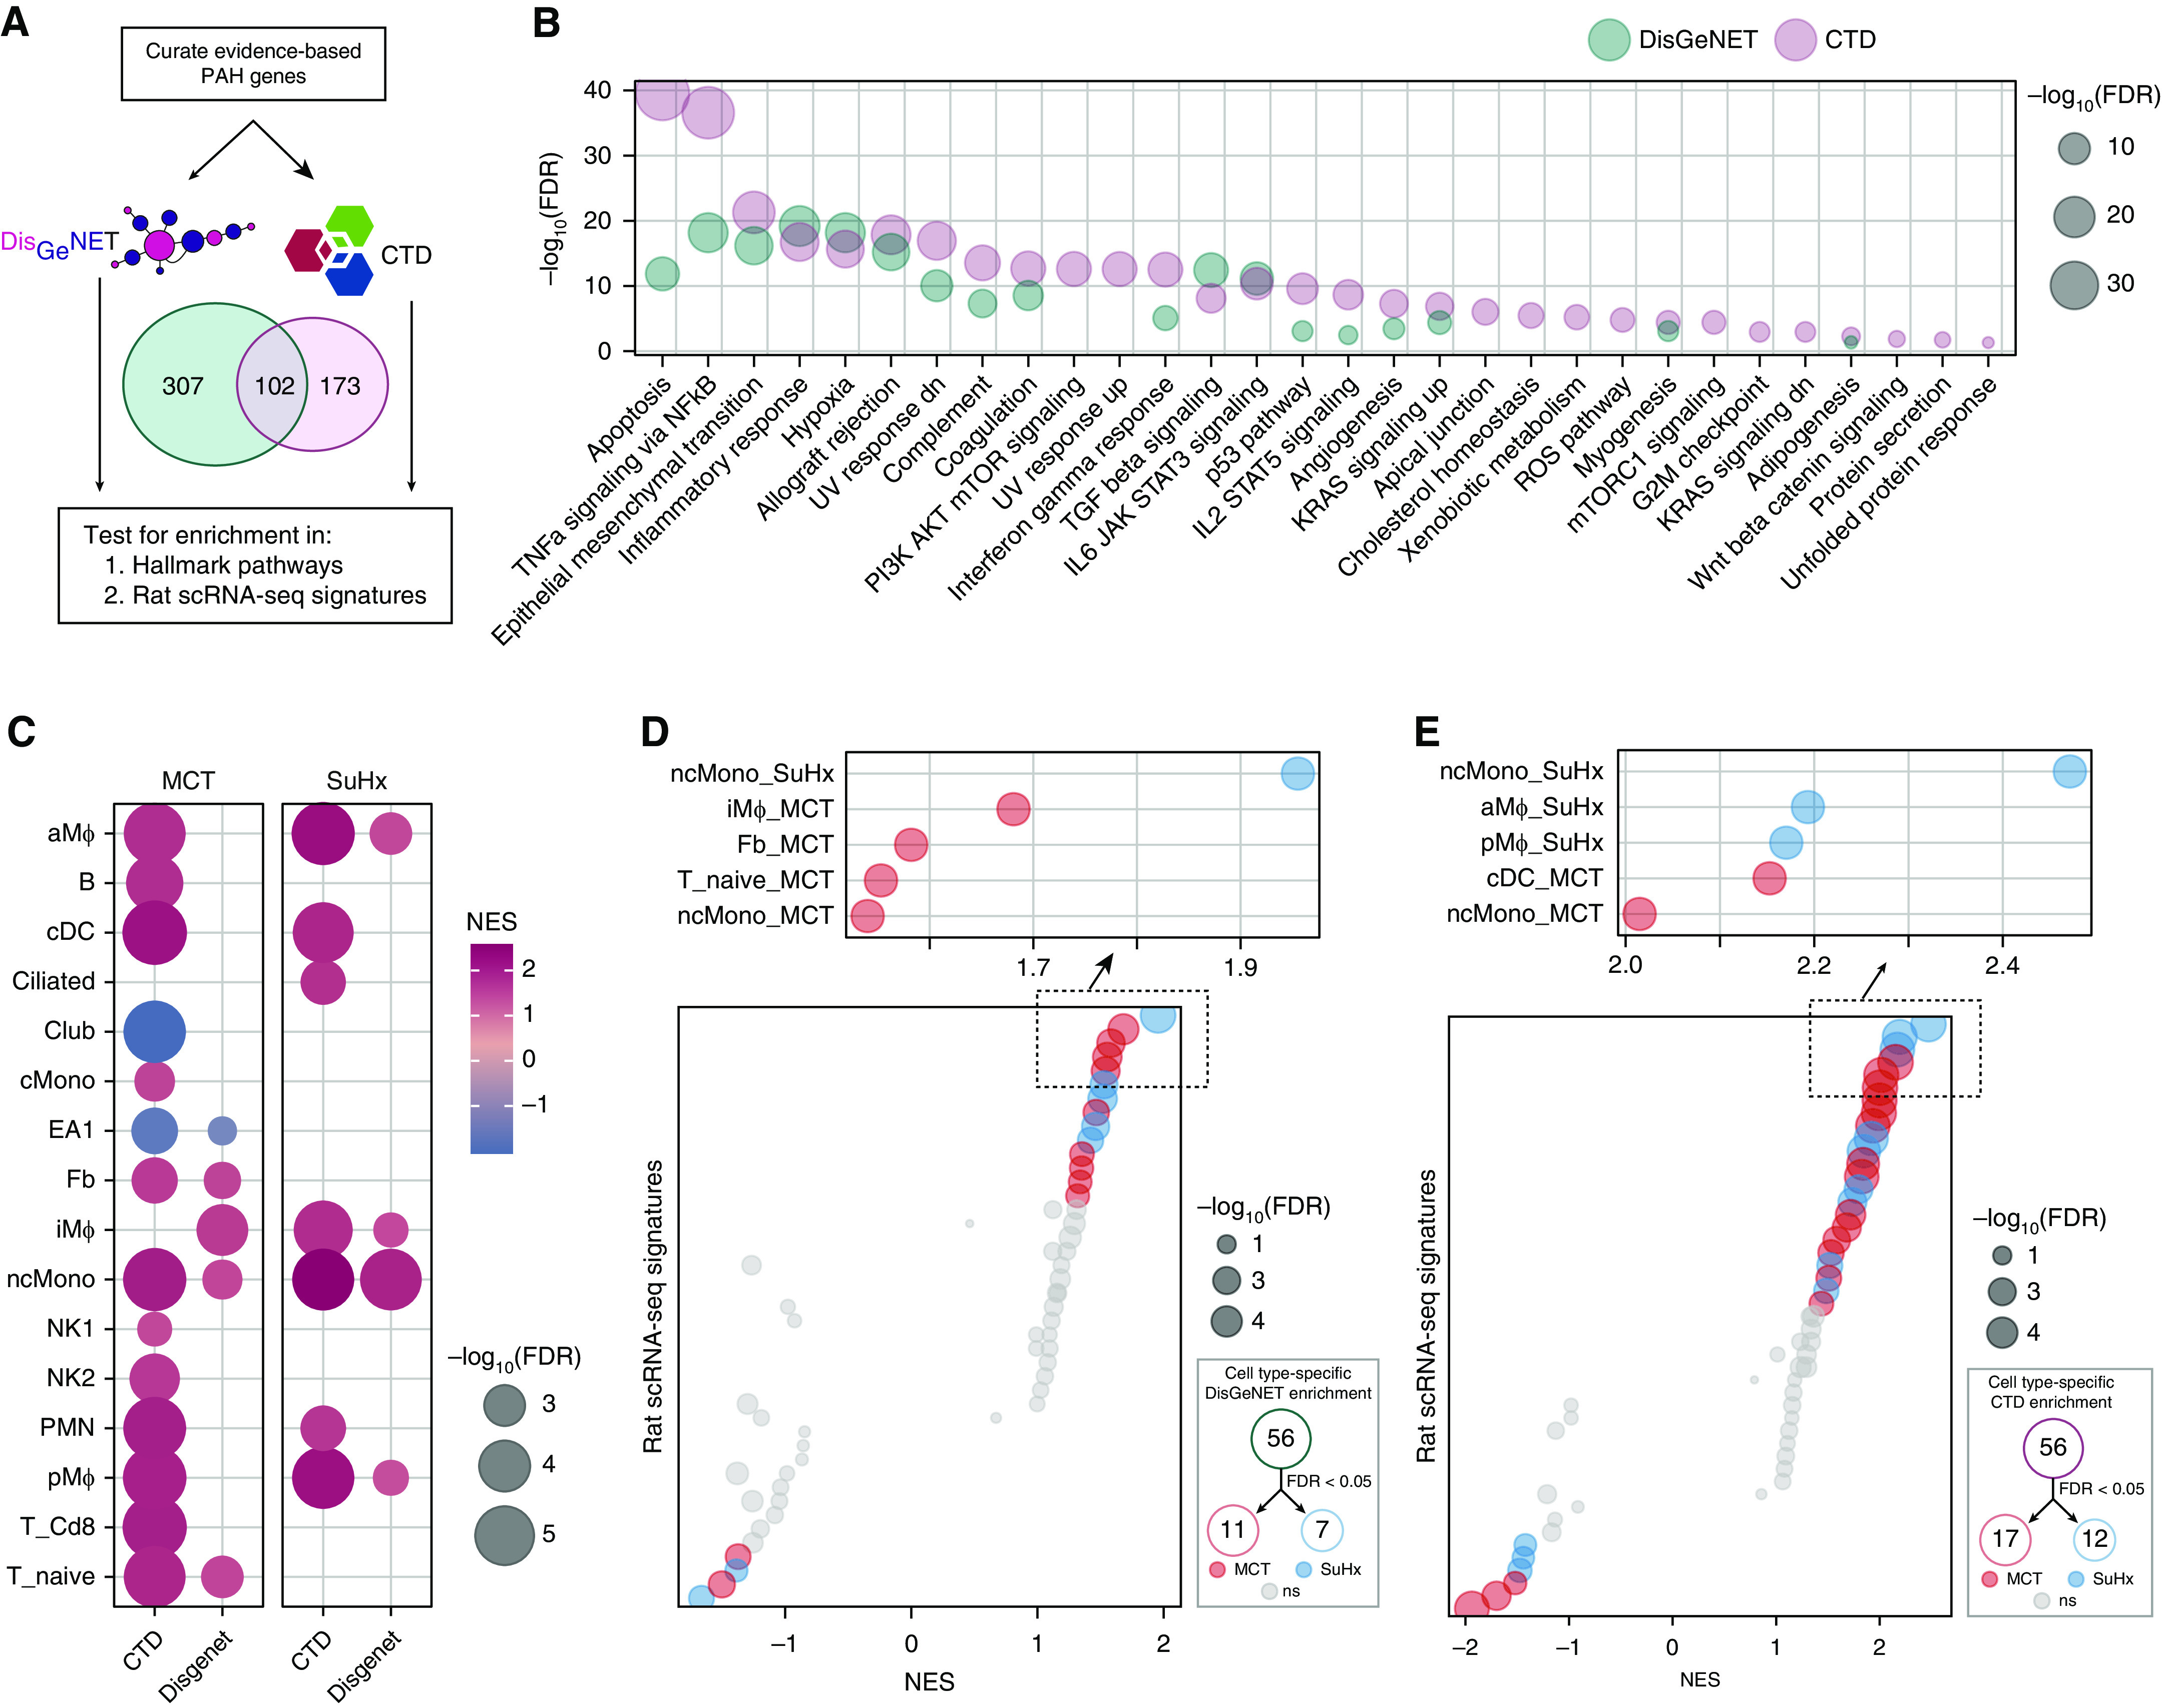
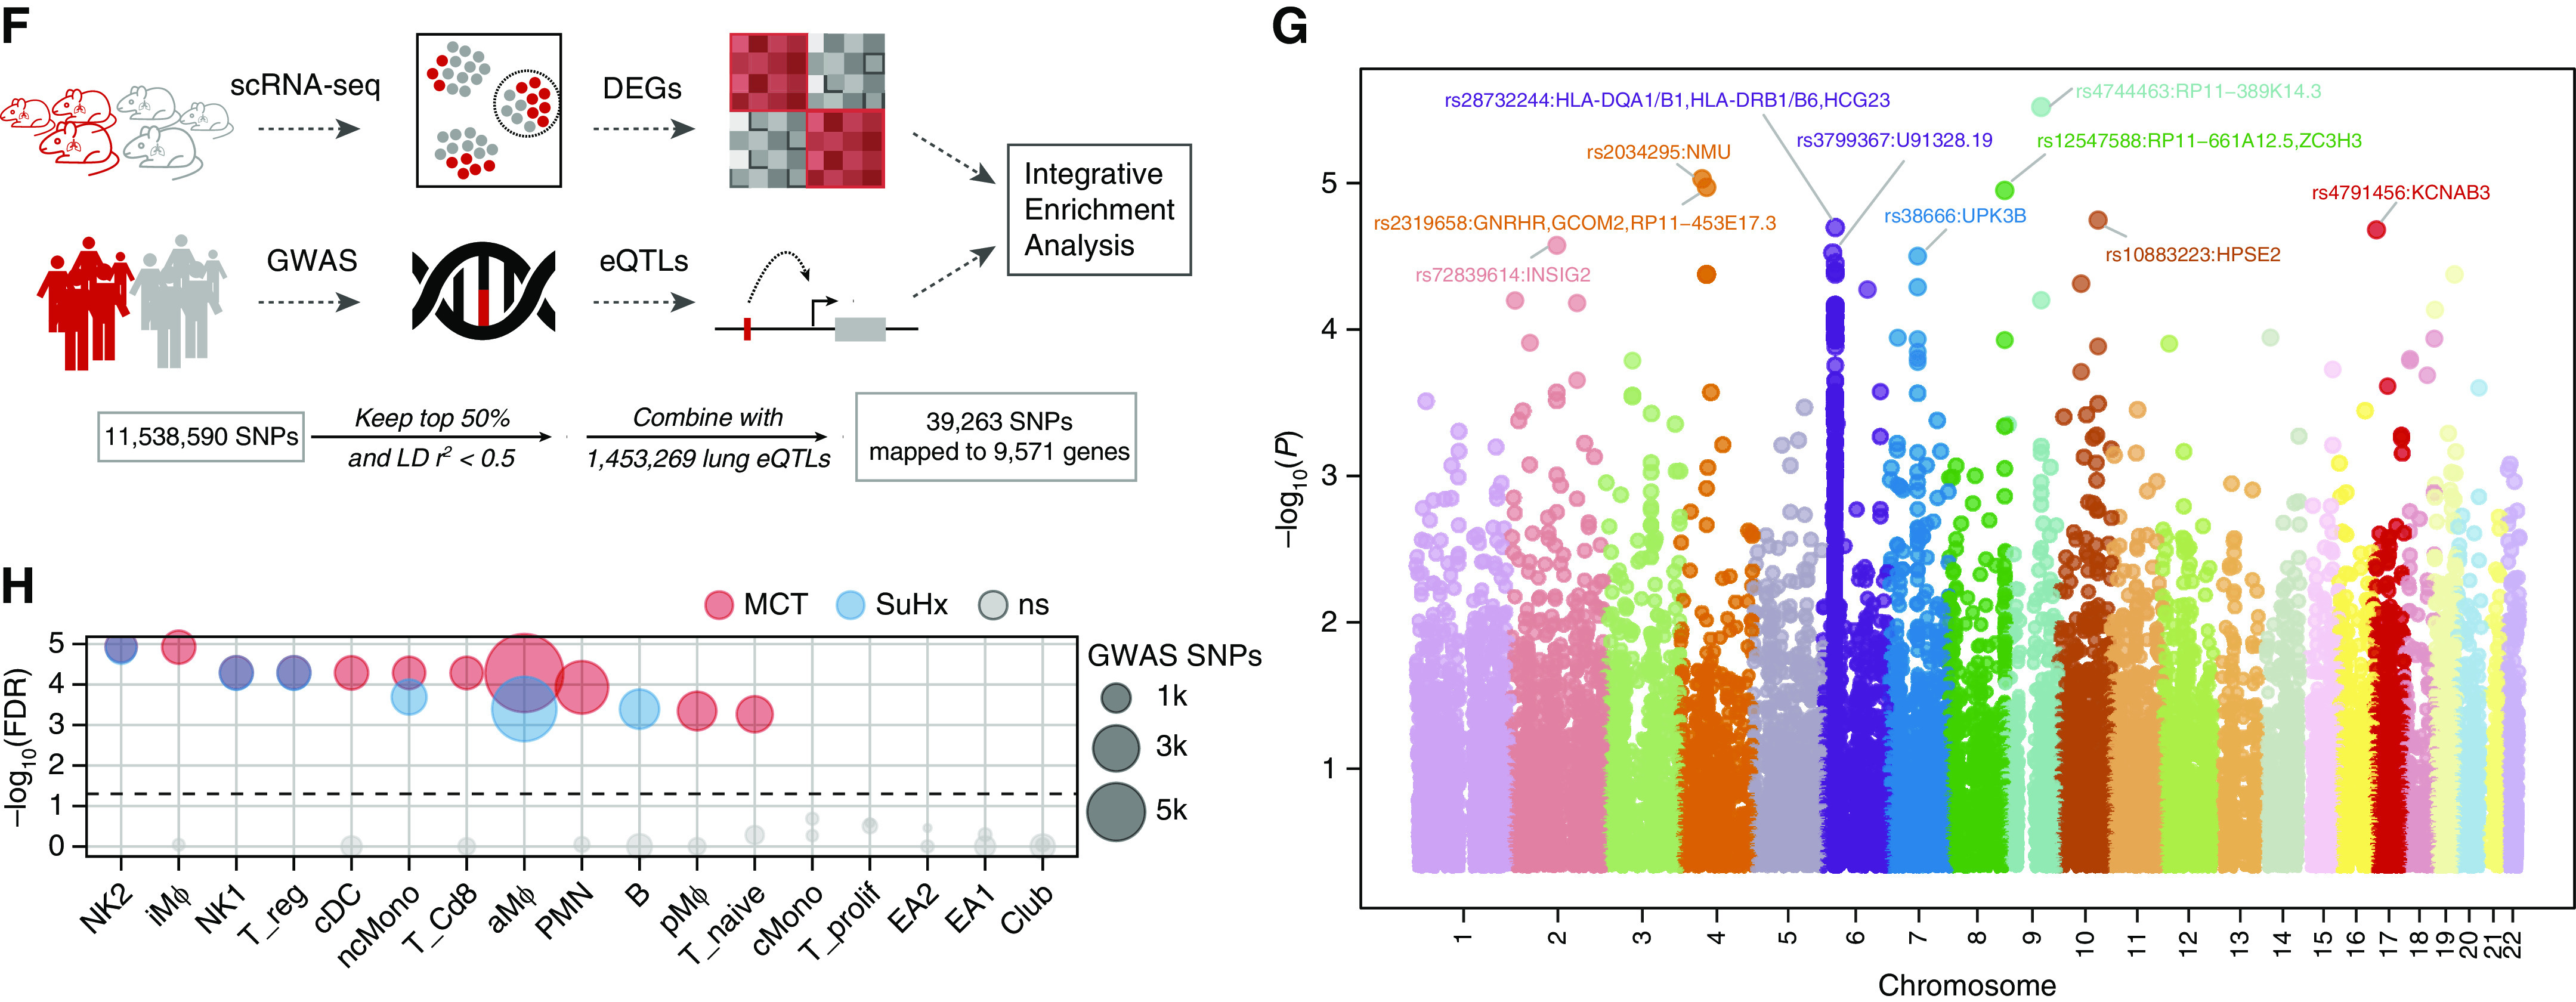
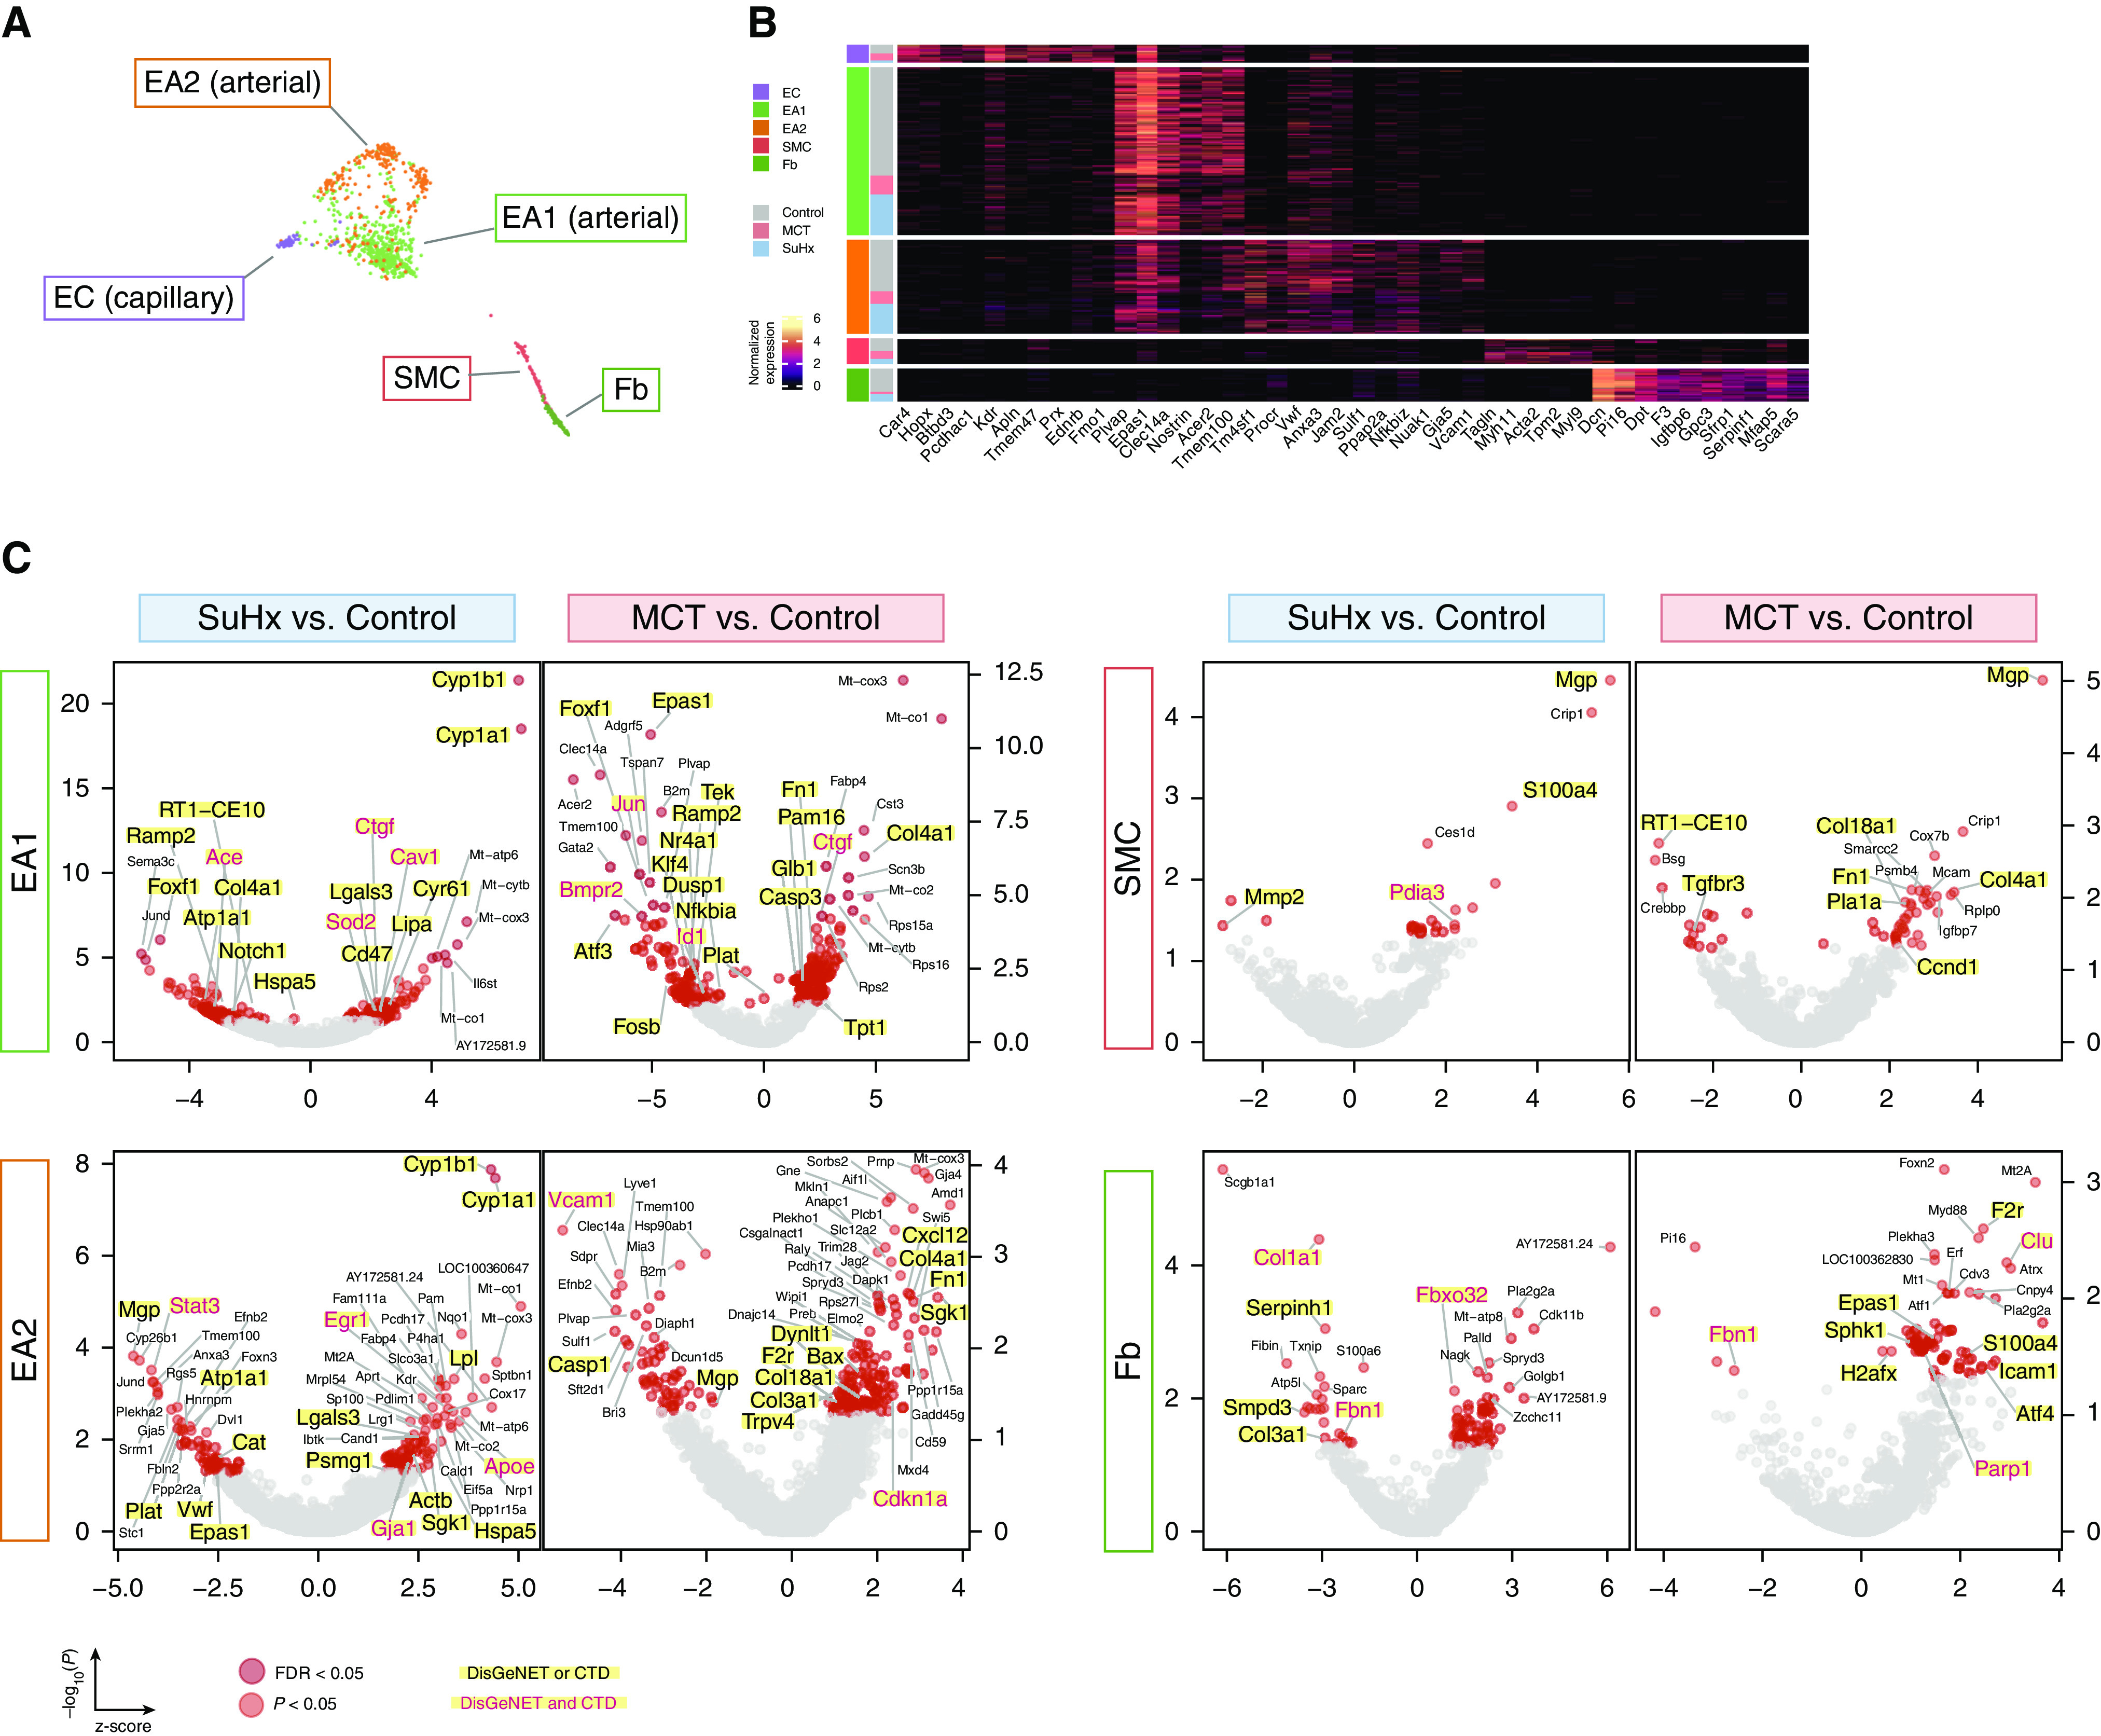
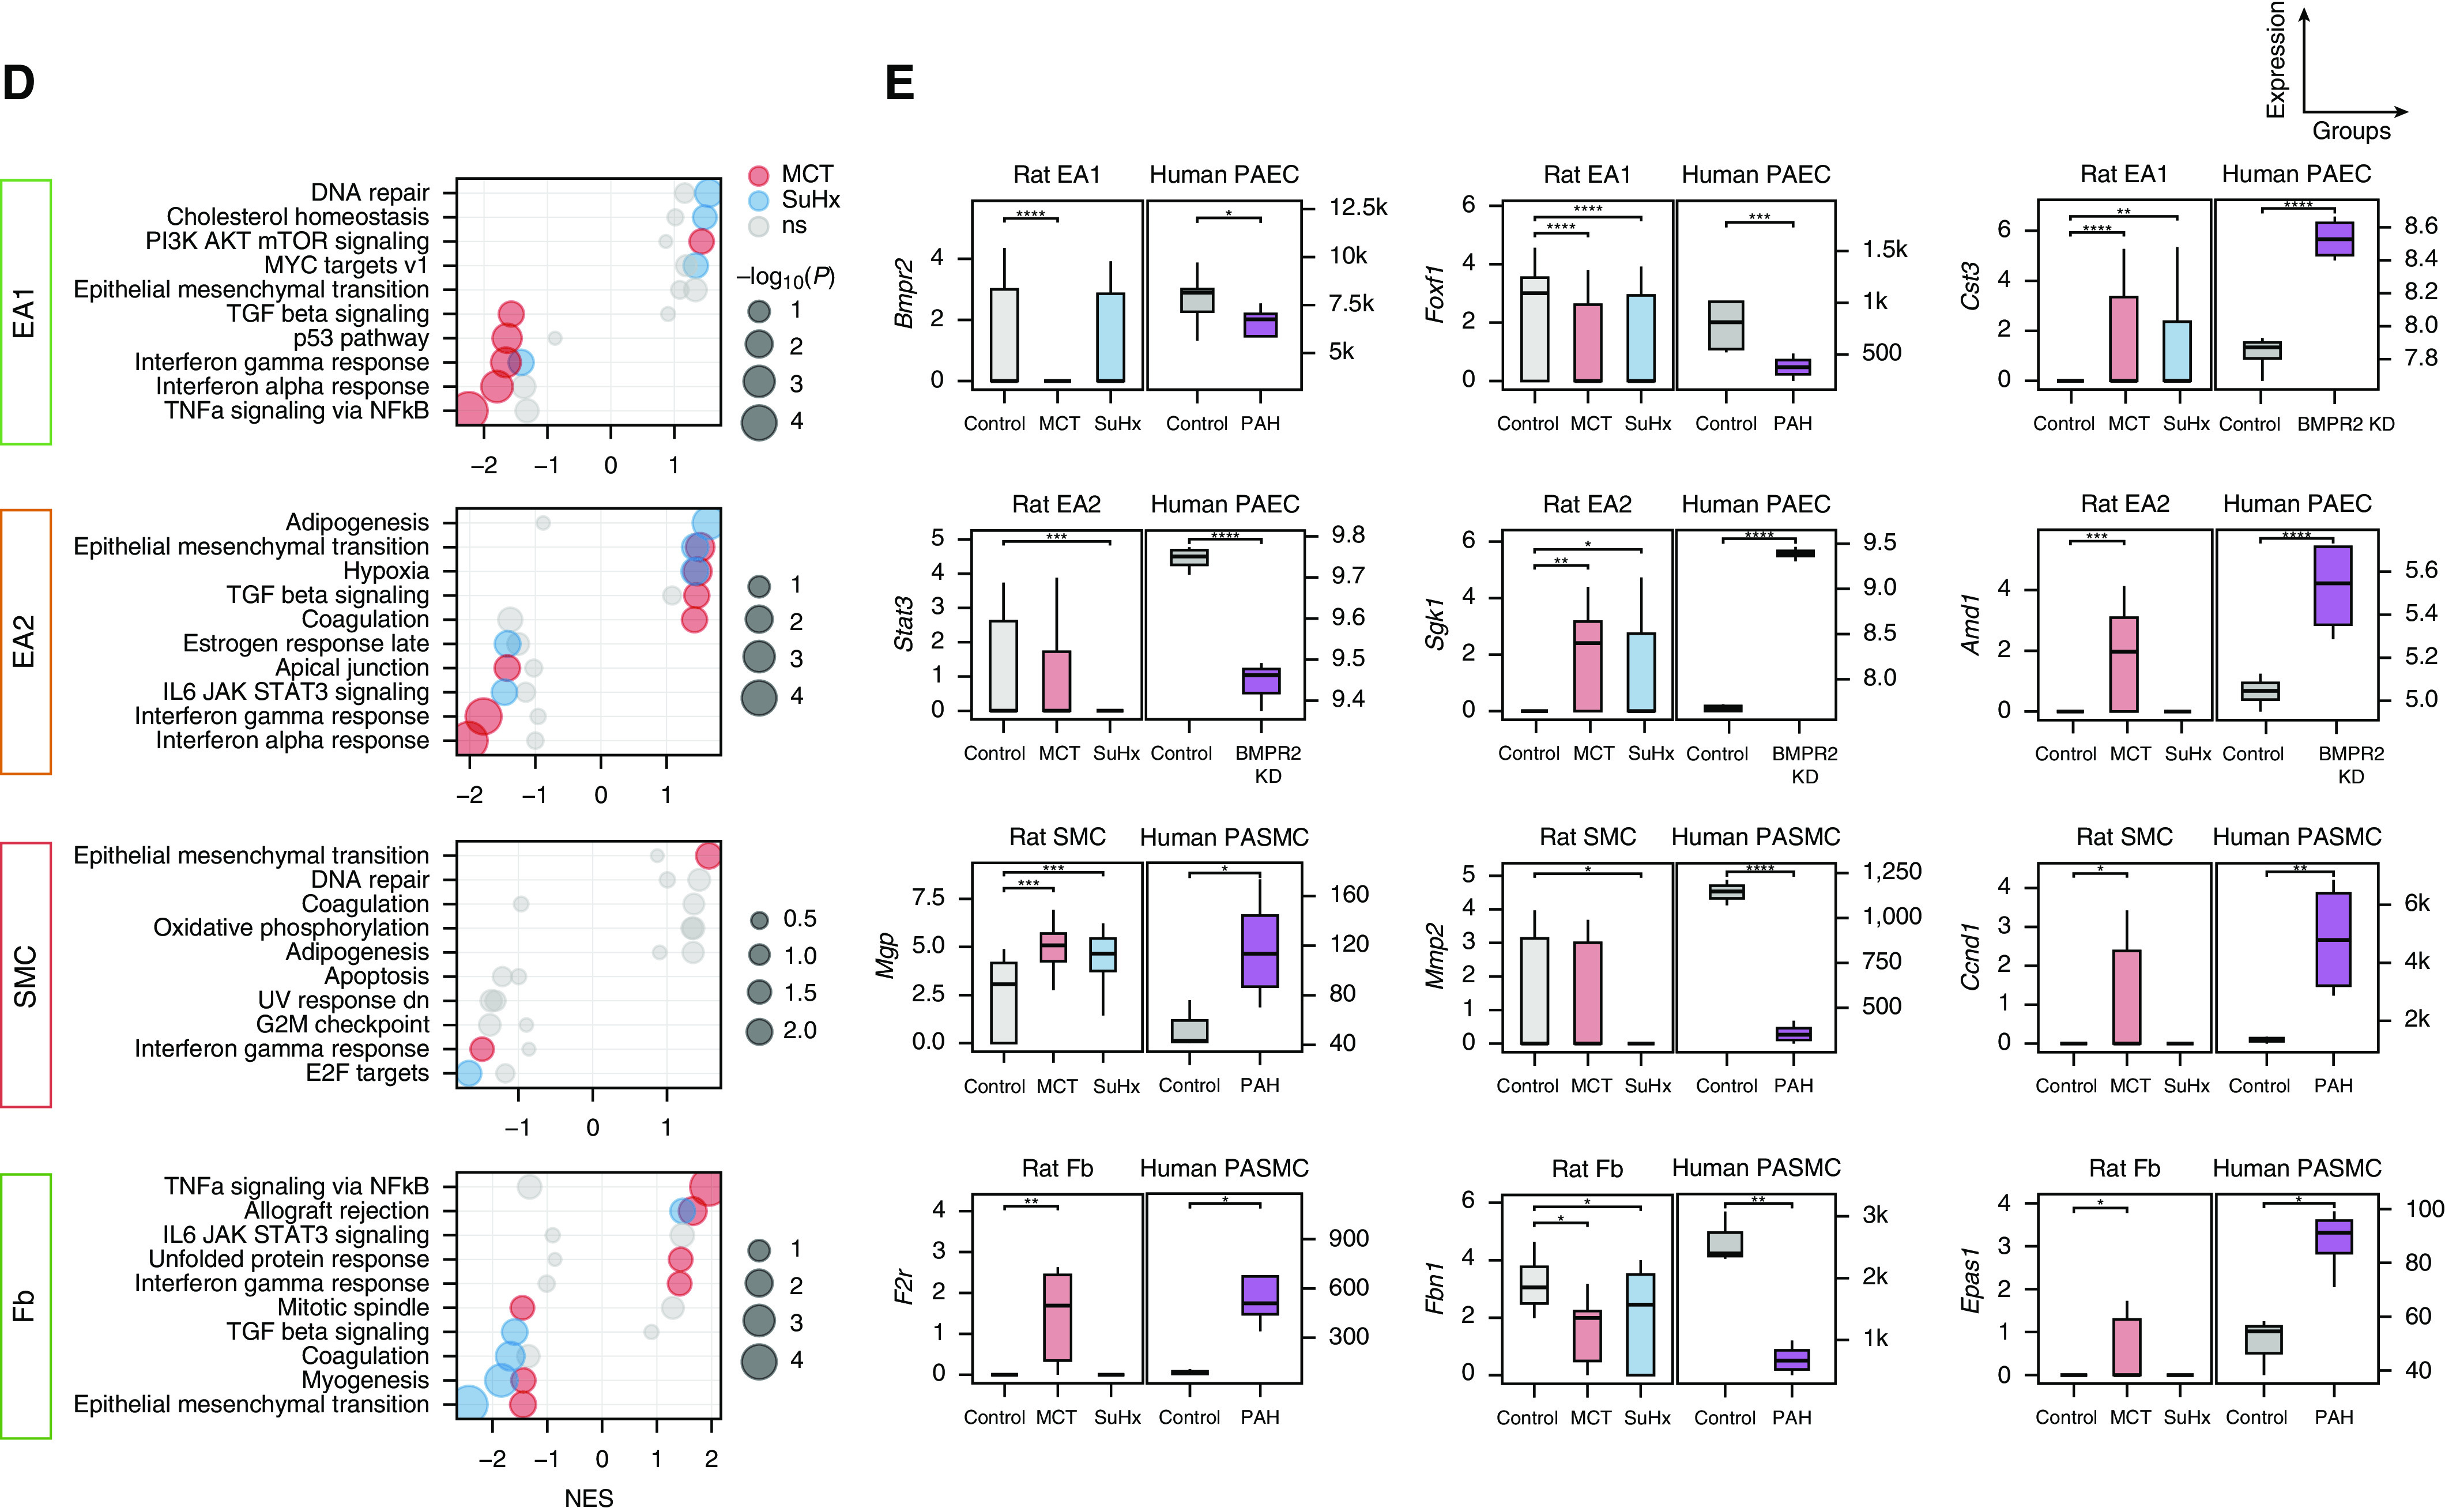
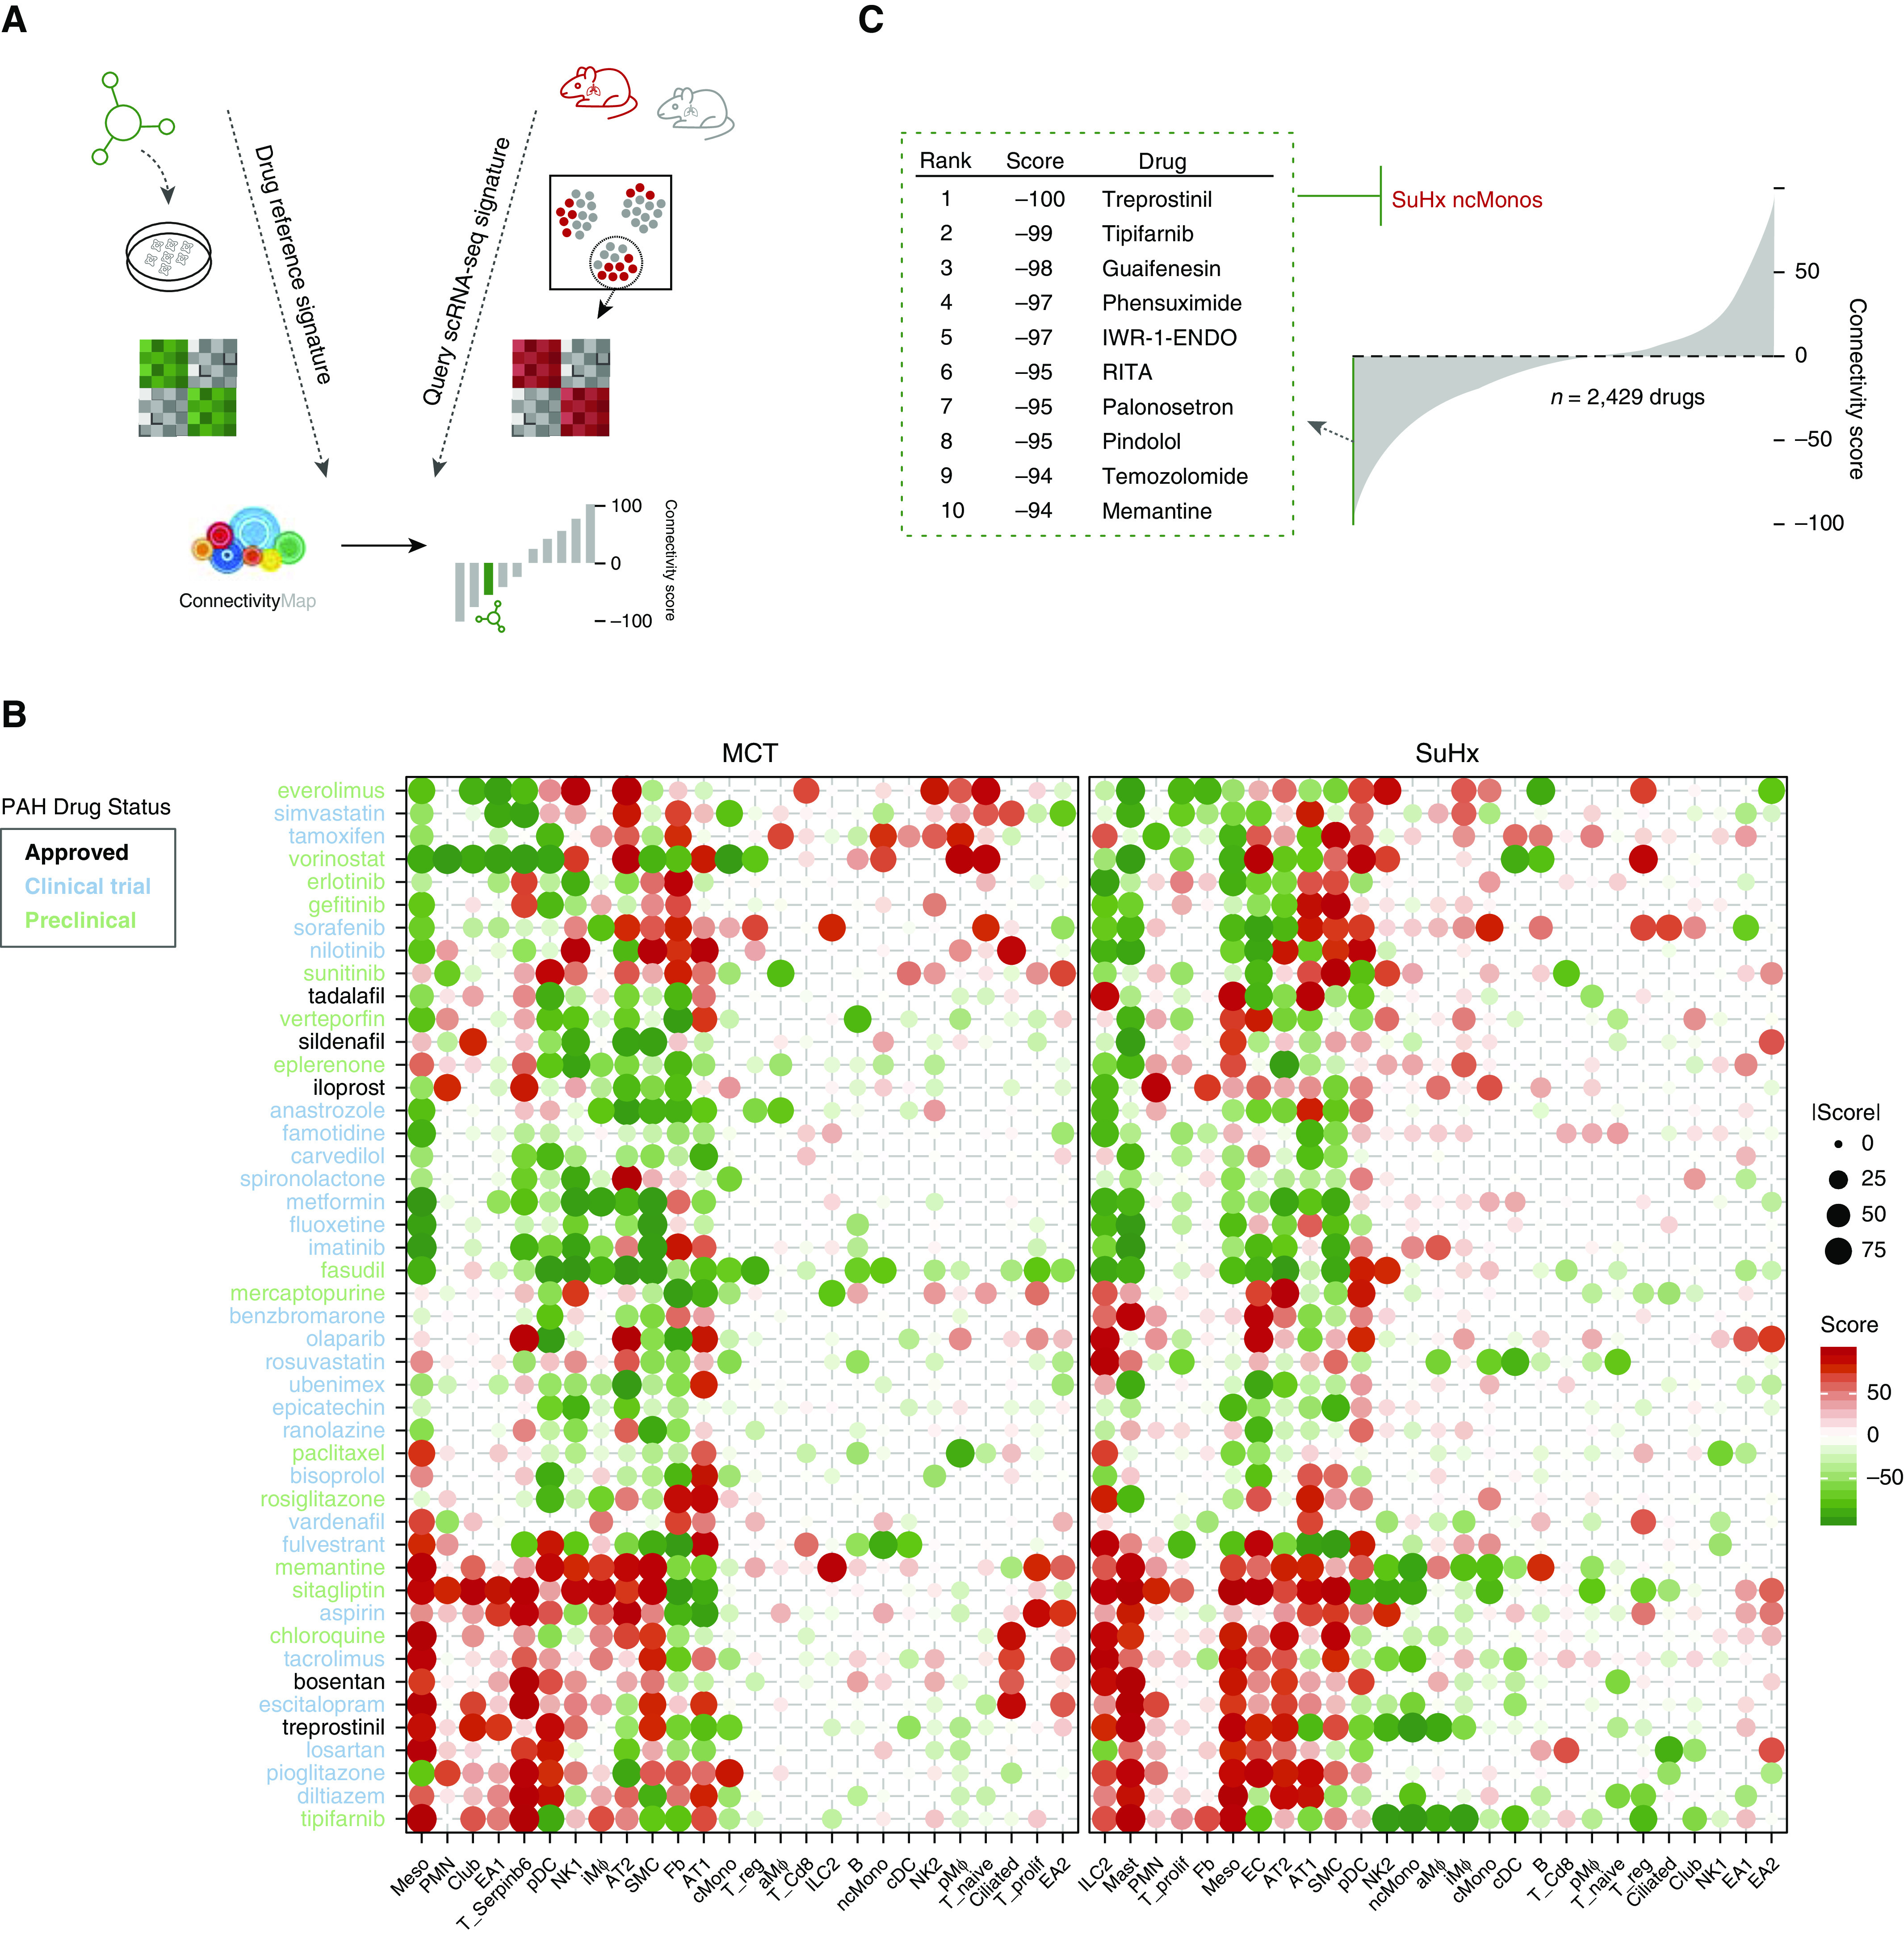
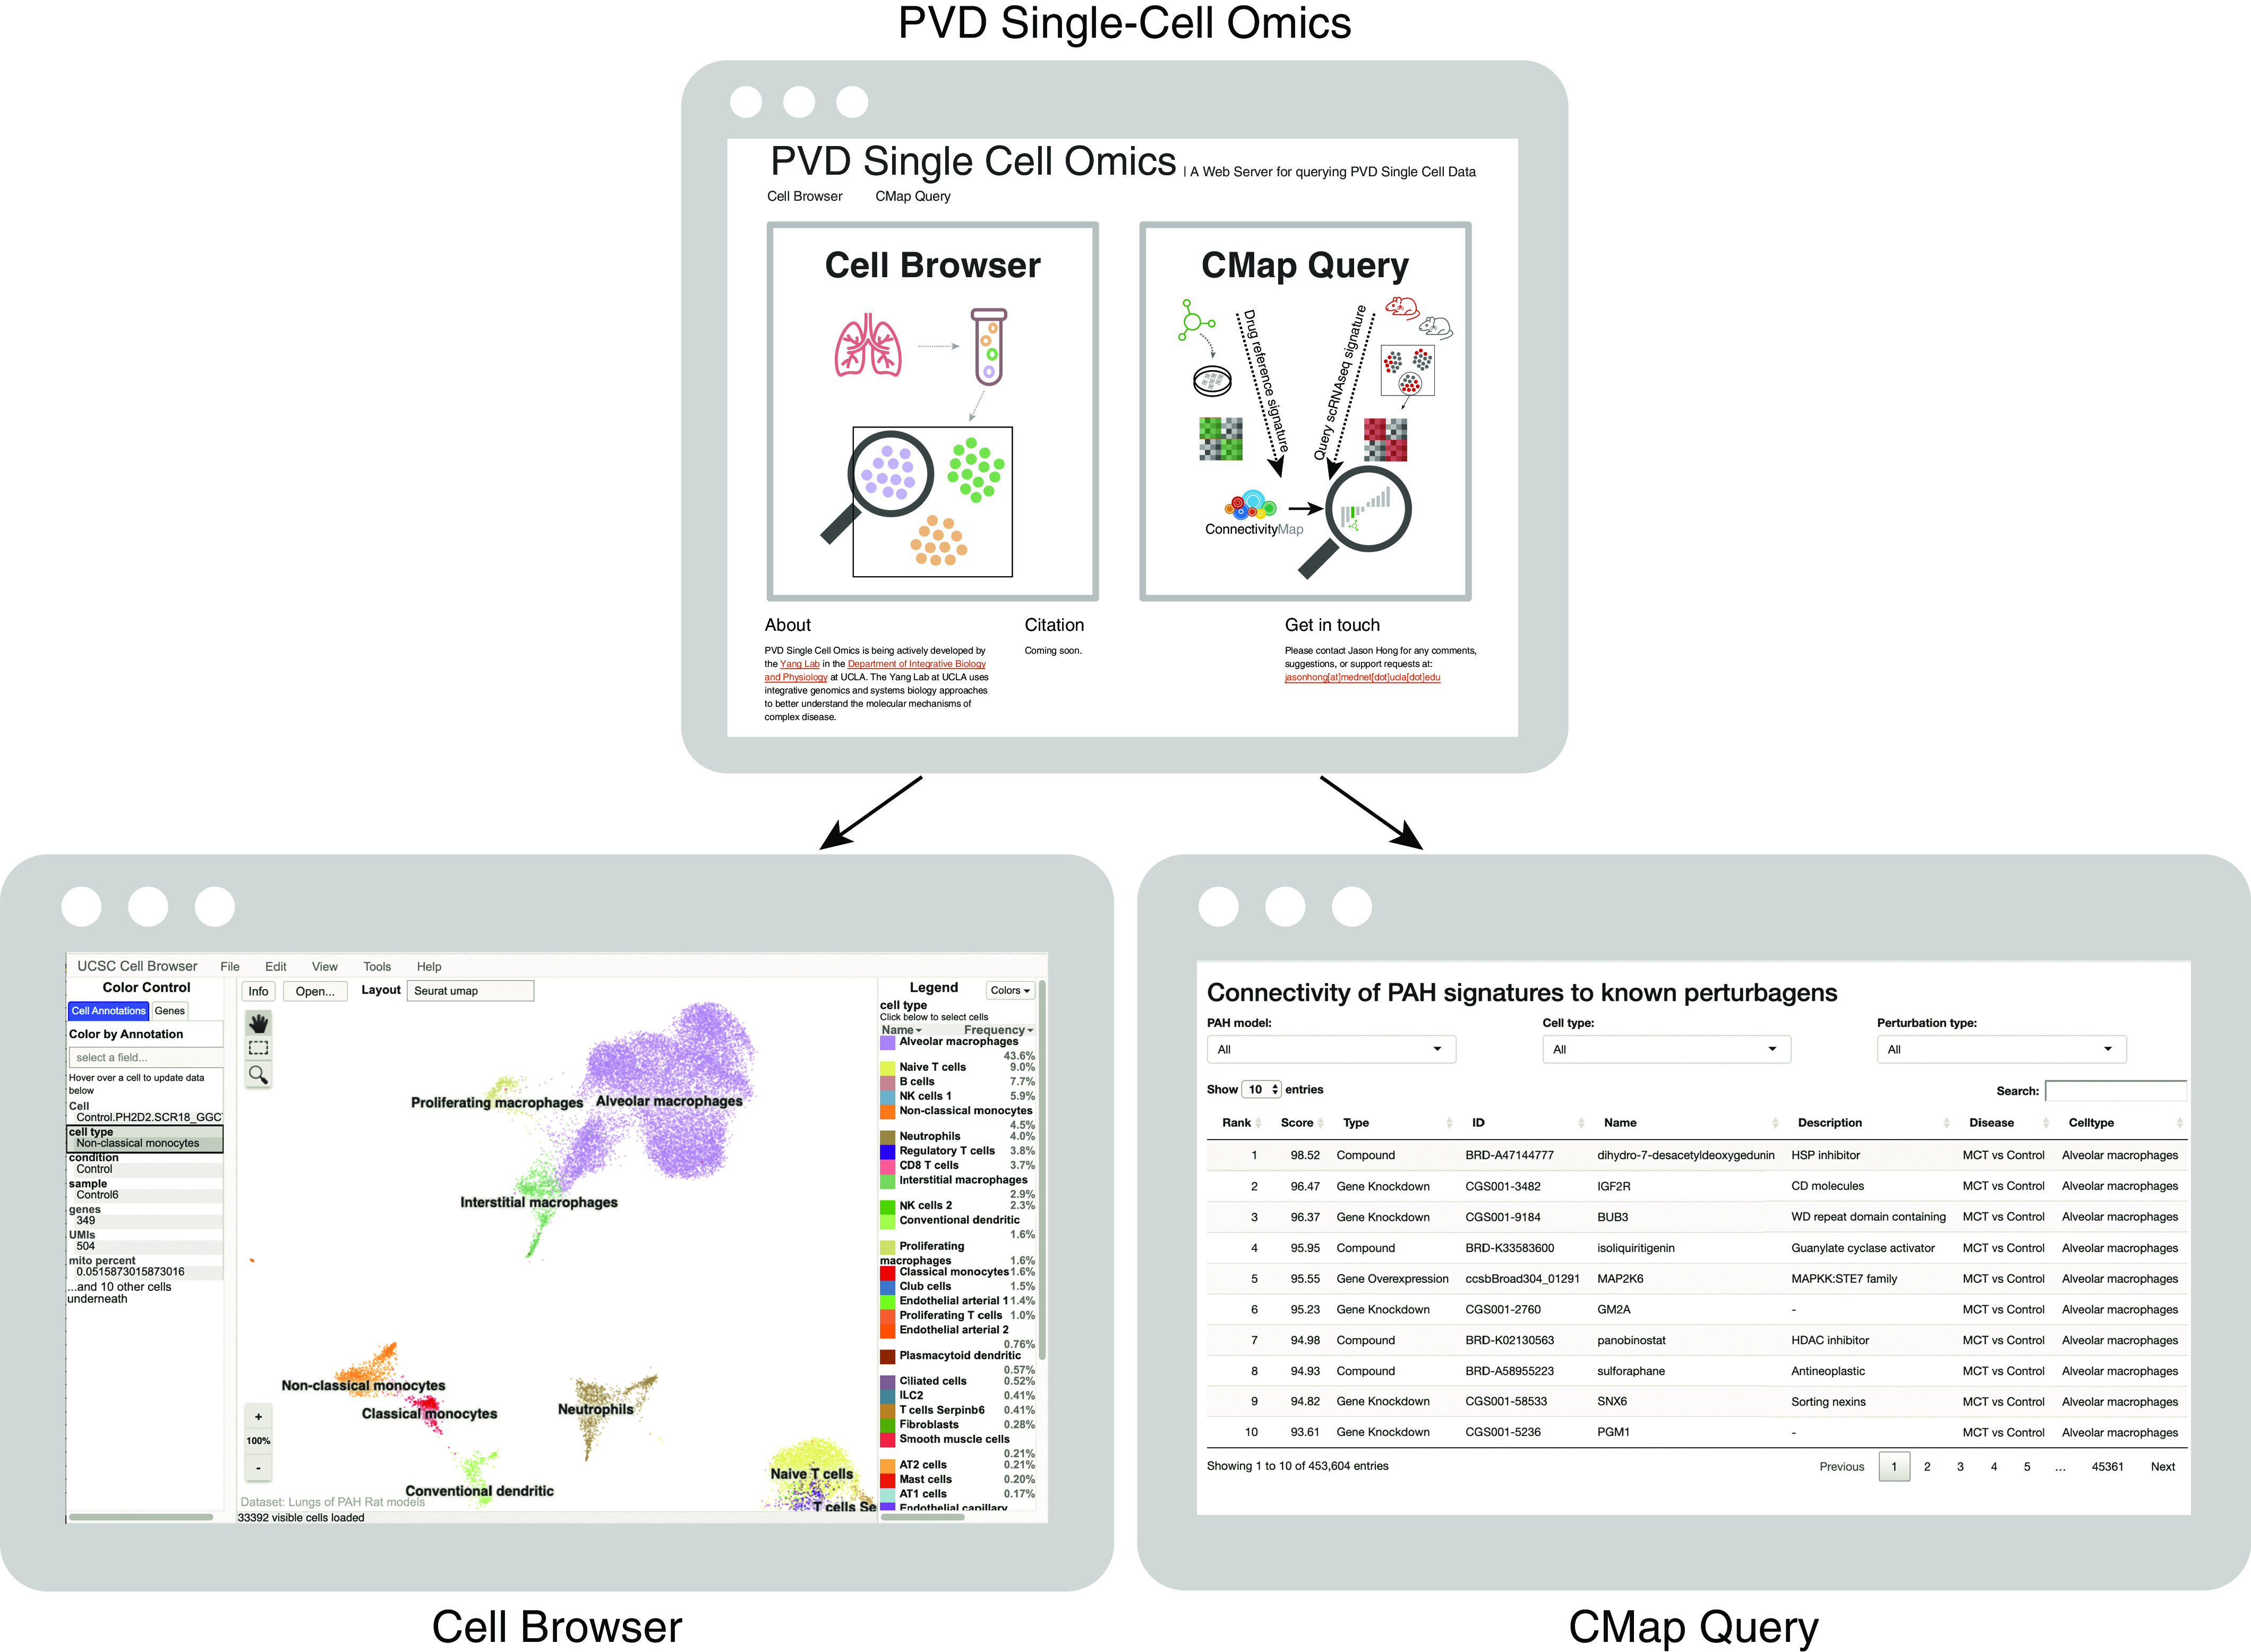
Rationale: The cellular and molecular landscape and translational value of commonly used models of pulmonary arterial hypertension (PAH) are poorly understood. Single-cell transcriptomics can enhance molecular understanding of preclinical models and facilitate their rational use and interpretation.Objectives: To determine and prioritize dysregulated genes, pathways, and cell types in lungs of PAH rat models to assess relevance to human PAH and identify drug repositioning candidates.Methods: Single-cell RNA sequencing was performed on the lungs of monocrotaline (MCT), Sugen-hypoxia (SuHx), and control rats to identify altered genes and cell types, followed by validation using flow-sorted cells, RNA in situ hybridization, and immunofluorescence. Relevance to human PAH was assessed by histology of lungs from patients and via integration with human PAH genetic loci and known disease genes. Candidate drugs were predicted using Connectivity Map.Measurements and Main Results: Distinct changes in genes and pathways in numerous cell types were identified in SuHx and MCT lungs. Widespread upregulation of NF-κB signaling and downregulation of IFN signaling was observed across cell types. SuHx nonclassical monocytes and MCT conventional dendritic cells showed particularly strong NF-κB pathway activation. Genes altered in SuHx nonclassical monocytes were significantly enriched for PAH-associated genes and genetic variants, and candidate drugs predicted to reverse the changes were identified. An open-access online platform was developed to share single-cell data and drug candidates (http://mergeomics.research.idre.ucla.edu/PVDSingleCell/).Conclusions: Our study revealed the distinct and shared dysregulation of genes and pathways in two commonly used PAH models for the first time at single-cell resolution and demonstrated their relevance to human PAH and utility for drug repositioning.

Keywords: Sugen-hypoxia; drug repurposing; monocrotaline; pulmonary hypertension; single-cell RNA sequencing.


Figures

Figure 1.
Figure 1.
Single-cell RNA sequencing identifies diverse lung cell types in rat models of pulmonary arterial hypertension. (A) Schematic of study design for single-cell RNA sequencing analysis on the lungs of monocrotaline (MCT), Sugen-hypoxia (SuHx), and control rats (n = 6/group). (B) Uniform manifold approximation and projection plot showing lung cells from 18 rats with clusters labeled by cell type. (C) Dot plot highlighting log10 average expression of select marker genes used to identify cell clusters. The dot size corresponds to the percentage of cells expressing a gene in a given cluster. (D) Uniform manifold approximation and projection plot showing lung cells colored by disease condition: MCT in red, SuHx in blue, and control in gray (n = 6/group). (E) Bar table showing relative contributions of cells from disease models (MCT in red and SuHx in blue) versus the control model (gray) within each cell-type cluster. The cell-type cluster referred to on the y-axis is defined as the total number of cells of a cell type from the control model and either the MCT or SuHx model (but not both models). A significant increase in proportions of iMΦs in MCT and aMΦs in the SuHx model were noted relative to the control model. Wilcoxon rank-sum test: *P < 0.05 and **P < 0.01. DEG = differentially expressed gene; NK = natural killer cell.
Figure 2.
Figure 2.
Fluorescence-activated cell sorting (FACS) and bulk RNA sequencing (RNA-seq) validate single-cell RNA-seq (scRNA-seq) cell-type identities and proportions. (A) Schematic showing the study design for deconvolution. The lungs from a separate set of Sugen-hypoxia (SuHx) (blue), monocrotaline (MCT) (red), and control (gray) rats (n = 4/group) underwent FACS using canonical cell-surface markers for two specific cell types, conventional dendritic cells (cDCs) and regulatory T cells (Tregs), after which bulk RNA-seq was performed on sorted cells to validate the cell-type identities in our scRNA-seq data using cell-type deconvolution of FACS-purified transcriptomes with CIBERSORTx (Stanford University). (B) Gating strategy for the isolation of CD64, CD11b/c+, and RT1B+ cDCs and CD4+, CD25+, and CD278+ Tregs after gating for singlets and live cells. (C) Principal component (PC) analysis plot showing the clustering of bulk RNA-seq transcriptomes based on cell type (cDCs as circles and Tregs as diamonds) and disease condition. The first and second PCs (PC1 and PC2) explained 82% and 3% of the variance, respectively. (D) Heatmap showing deconvolution results using CIBERSORTx, in which relative proportions of cell types were estimated in each bulk RNA-seq sample of flow-sorted cells using a gene-expression signature for each cell type derived from scRNA-seq. High specificity for the correct cell types as identified by scRNA-seq was noted (83 ± 11% for cDCs; 77 ± 6% for Tregs). (EH) FACS-determined relative cell-type proportions between disease models and the control model (F and H) showed a similar pattern to that of our scRNA-seq results (E and G). A significant increase in cDCs was noted in MCT compared with control rats. Furthermore, both methods consistently showed no significant changes in the number of cDCs in the SuHx model compared with the control model. The number of Tregs was also unchanged using either method in both disease models when compared with the control model. Wilcoxon rank-sum test: *P < 0.05 and **P < 0.01. FACS = fluorescence-activated cell sorter.
Figure 3.
Figure 3.
Single-cell RNA sequencing reveals differentially expressed genes (DEGs) in individual cell types of pulmonary arterial hypertension models. (A) Jitter plot showing changes in gene expression for each cell type due to monocrotaline (MCT) (top) or Sugen-hypoxia (SuHx) (bottom) conditions compared with the control condition. Each dot represents the differential expression MAST (Model-based Analysis of Single-Cell Transcriptomics) z-score of a gene. Dots indicating a false discovery rate (FDR) < 0.05 are in color. The gray dots indicate values that were not significant (ns). (B) Dot plot showing shifts in gene expression on a whole-transcriptome scale within each cell type for MCT (red) and SuHx (blue) models compared with the control model using a Euclidean distance (E.d.)-based statistical approach as previously described (14). The x-axis shows the log ratio of observed-to-null E.d. The alveolar macrophages and nonclassical monocytes from the SuHx model demonstrated the strongest global shifts in gene expression from the control model. (C) Dot plot comparing DEGs across cell types and disease models shows genes whose differential expression was specific to a disease model and a particular cell type. For example, Gpr15, which encodes an orphan G protein–linked receptor believed to be important in regulatory T cell (Treg) homing (22), was exclusively upregulated in Tregs from SuHx rats. (D) Dot plot showing DEGs consistent across immune-cell types. For instance, Ifi27, which encodes IFNα-inducible protein 27 and plays a role in apoptosis and vascular response to injury (23, 24), was downregulated across cell types in both models. (C and D) The horizontal dashed line for each gene represents zero logFC. (BD) Gray dots indicate values that were ns, and the size of the dots corresponds to −log10(P) values (B) and −log10(FDR) values (C and D). logFC = log fold change.
Figure 4.
Figure 4.
Single-cell RNA sequencing reveals pathways in individual cell types of pulmonary arterial hypertension models. (A) Heatmap showing cell type–specific pathway enrichment of gene signatures of monocrotaline (MCT) (left) and Sugen-hypoxia (SuHx) (right) models compared with the control model using gene-set enrichment analysis (GSEA) (P < 0.05) and hallmark pathways from the Molecular Signatures Database on the y-axis. The dot size corresponds to −log10(P), and color represents the normalized enrichment score (NES) from GSEA, indicating upregulation (red) or downregulation (blue). TNFα/NF-κB signaling was significantly upregulated across many cell types in both disease models. (B) Dot plot showing NES of IFNα (black text) and IFNγ (green text) response pathways across cell types in the MCT (red) and SuHx (blue) models, in which the size and color tint of dots represent strength of −log10(P) values. A strong downregulation of IFN pathways was seen across cell types in the MCT model. (C) Dot plot showing MAST (Model-based Analysis of Single-Cell Transcriptomics) z-scores of leading-edge genes accounting for the MCT EA1 downregulation of IFNγ response as determined by GSEA from the MCT (red) and SuHx (blue) models, in which the size and color tint of dots represent the strength of −log10(P) values. Gene labels highlighted in yellow represent human pulmonary arterial hypertension–associated genes from either (black text) or both (red text) of the Comparative Toxicogenomics Database and DisGeNET databases. (D) Boxplots showing RNA expression of human orthologs of select IFN leading-edge genes shown in C derived from a public microarray (Gene Expression Omnibus series 70456) in which primary human pulmonary arterial endothelial cells were transfected with control (gray) or BMPR2 (purple) siRNA (n = 4/group from 4 donors). P values were determined by using the limma R package: ****False discovery rate (FDR) < 0.05. (E) Dot plots showing all (left) and top 30 (right) cell type–specific pathways in descending order on the y-axis by NES in which positive scores indicate upregulation. Red (MCT) and blue (SuHx) dots met the FDR < 0.05 criterion, and gray dots were not significant (ns). The dot size indicates the strength of the FDR. The number of significant cell type–specific rat signatures by disease model is shown in the lower right (FDR < 0.05). In the left plot, dots on opposite sides of an NES of 0 for a given row represent opposite directionalities of cell type–specific enrichment of MCT and SuHx models. Many more cell type–specific pathways were significant in the MCT model compared with the SuHx model, but TNFα/NF-κB signaling in SuHx nonclassical monocytes (ncMonos) was the most prominently upregulated pathway overall (right). Cell-type colors correspond to those as labeled in Figure 1B. (F) Dot plot showing MAST z-scores of leading-edge genes accounting for the SuHx ncMono upregulation of TNFα/NF-κB signaling with figure legend as described in C. CTD = Comparative Toxicogenomics Database; KD = knockdown; NK = natural killer.
Figure 4.
Figure 4.
Single-cell RNA sequencing reveals pathways in individual cell types of pulmonary arterial hypertension models. (A) Heatmap showing cell type–specific pathway enrichment of gene signatures of monocrotaline (MCT) (left) and Sugen-hypoxia (SuHx) (right) models compared with the control model using gene-set enrichment analysis (GSEA) (P < 0.05) and hallmark pathways from the Molecular Signatures Database on the y-axis. The dot size corresponds to −log10(P), and color represents the normalized enrichment score (NES) from GSEA, indicating upregulation (red) or downregulation (blue). TNFα/NF-κB signaling was significantly upregulated across many cell types in both disease models. (B) Dot plot showing NES of IFNα (black text) and IFNγ (green text) response pathways across cell types in the MCT (red) and SuHx (blue) models, in which the size and color tint of dots represent strength of −log10(P) values. A strong downregulation of IFN pathways was seen across cell types in the MCT model. (C) Dot plot showing MAST (Model-based Analysis of Single-Cell Transcriptomics) z-scores of leading-edge genes accounting for the MCT EA1 downregulation of IFNγ response as determined by GSEA from the MCT (red) and SuHx (blue) models, in which the size and color tint of dots represent the strength of −log10(P) values. Gene labels highlighted in yellow represent human pulmonary arterial hypertension–associated genes from either (black text) or both (red text) of the Comparative Toxicogenomics Database and DisGeNET databases. (D) Boxplots showing RNA expression of human orthologs of select IFN leading-edge genes shown in C derived from a public microarray (Gene Expression Omnibus series 70456) in which primary human pulmonary arterial endothelial cells were transfected with control (gray) or BMPR2 (purple) siRNA (n = 4/group from 4 donors). P values were determined by using the limma R package: ****False discovery rate (FDR) < 0.05. (E) Dot plots showing all (left) and top 30 (right) cell type–specific pathways in descending order on the y-axis by NES in which positive scores indicate upregulation. Red (MCT) and blue (SuHx) dots met the FDR < 0.05 criterion, and gray dots were not significant (ns). The dot size indicates the strength of the FDR. The number of significant cell type–specific rat signatures by disease model is shown in the lower right (FDR < 0.05). In the left plot, dots on opposite sides of an NES of 0 for a given row represent opposite directionalities of cell type–specific enrichment of MCT and SuHx models. Many more cell type–specific pathways were significant in the MCT model compared with the SuHx model, but TNFα/NF-κB signaling in SuHx nonclassical monocytes (ncMonos) was the most prominently upregulated pathway overall (right). Cell-type colors correspond to those as labeled in Figure 1B. (F) Dot plot showing MAST z-scores of leading-edge genes accounting for the SuHx ncMono upregulation of TNFα/NF-κB signaling with figure legend as described in C. CTD = Comparative Toxicogenomics Database; KD = knockdown; NK = natural killer.
Figure 5.
Figure 5.
RNA ISH and immunofluorescence (IF) validate select differentially expressed genes. (A and B) The upregulation of Ccrl2 (red) in Sugen-hypoxia (SuHx) nonclassical monocytes (ncMonos) from single-cell RNA sequencing (scRNA-seq) was observed by RNAscope (Advanced Cell Diagnostics) in SuHx rats and patients with PAH (A) and by IF in SuHx rats (B). ncMonos were defined as cells positive for both Cd16 (white) and Mal (green). We chose Mal for double-labeling because it was the top marker gene specific for ncMonos in our data. (C and D) The upregulation of Fabp4 (red) in MCT alveolar macrophages (aMΦs) from scRNA-seq was demonstrated, in which aMΦs were defined as cells positive for Mrc1 (green) for rat and human RNAscope (C) or Cd68 (white) for rat IF (D). Both Mrc1 and Cd68 are canonical markers and were cell type–specific markers for aMΦs. The cell nuclei are labeled with DAPI (blue). Scale bars, 20 μm. ISH = in situ hybridization; MCT = monocrotaline; PAH = pulmonary arterial hypertension.
Figure 6.
Figure 6.
Integrative analysis of rat single-cell RNA sequencing (scRNA-seq) differentially expressed genes (DEGs) with human pulmonary arterial hypertension (PAH) genetics points to the relevance of the DEGs to human PAH. (A) Schematic of analytical approach whereby genes implicated in human PAH were curated from DisGeNET (409 genes) and Comparative Toxicogenomics Database (CTD) (275 genes), of which 102 genes were shared between the databases. These genes were then tested for enrichment in (B) Molecular Signatures Database hallmark pathways and (CE) rat scRNA-seq signatures. (B) Dot plot showing pathways significantly enriched for PAH genes by hypergeometric test (false discovery rate [FDR] < 0.05), whether from the DisGeNET database (green) or the CTD database (purple). The dot size represents the −log10(FDR). These gene sets were highly enriched for known or implicated PAH pathways, such as apoptosis, NF-κB signaling, and endothelial-to-mesenchymal transition and were similar overall to those altered in Sugen-hypoxia (SuHx) and monocrotaline (MCT) rat lung scRNA-seq (Figure 4). (C) Heatmap showing most highly significant (FDR < 0.01) enrichment of PAH genes in MCT (left) and SuHx (right) cell type–specific signatures using gene-set enrichment analysis, in which red indicates upregulation and blue indicates downregulation. The dot size represents −log10(FDR). Significant upregulation of PAH genes was noted in myeloid cell types in both models, and in nonclassical monocytes (ncMonos) in particular. (D and E) Dot plots showing all (left) and top 5 (upper right) cell type–specific rat signature enrichment for PAH genes from the DisGeNET (D) and CTD (E) databases. The red (MCT) and blue (SuHx) dots indicate meeting the FDR < 0.05 criterion, and gray dots indicate values that were not significant (ns). The dot size represents −log10(FDR). A number of significant cell type–specific rat signatures by disease model are shown in the lower right (FDR < 0.05). In the left-sided plots, dots on opposite sides of an NES of 0 for a given row represent opposite directionalities of cell type–specific enrichment of MCT and SuHx models. The SuHx ncMonos DEGs were most highly enriched for PAH genes comparing both models. For the MCT model, DEGs from iMΦs and cDCs demonstrated the strongest enrichment for PAH genes. (F) Schematic of analytical approach for human PAH genome-wide association study (GWAS) integration. Human orthologs of rat scRNA-seq DEGs were assessed for enrichment of genetic variants associated with PAH in human GWAS to further assess human relevance of the rat signatures. GWAS SNPs were filtered by keeping the top 50% by P value strength and LD r2 < 0.5, after which SNPs were mapped to genes by integrating with lung-specific expression quantitative loci (eQTLs) curated from public databases. DEGs within each cell type (P < 0.01 to include DEGs from rare cell types with low statistical power) were then tested for enrichment of these GWAS-integrated expression SNPs (eSNPs). The GWAS P values of each eSNP set (by cell type and disease model) were then compared against that of eSNPs generated from random gene sets to assess the significance of enrichment for stronger GWAS association P values using a modified chi-square statistic. (G) Manhattan plot showing −log10(P) values of 39,263 eSNPs used for rat DEG enrichment analysis after GWAS SNP filtering and eQTL integration as described in F. SNPs are ordered along the x-axis according to their chromosomal location; the colors represent different chromosomes. Select eSNPs are labeled with their reference SNP identifiers and the corresponding genes they regulate. (H) Dot plot showing rat cell type–specific DEGs enriched for PAH-associated genetic variants from human GWAS. Red (MCT) and blue (SuHx) dots indicate an FDR < 0.05, and gray dots indicate values that were ns. The horizontal dashed line corresponds to an FDR = 0.05. The dot size is proportional to the number of enriched GWAS SNPs in the thousands. Significant enrichment for human PAH GWAS signals among DEGs in both rat disease models was noted from a number of immune-cell types of both myeloid and lymphoid origin, supporting that the rat disease signatures are relevant to PAH pathogenesis in humans. LD = linkage disequilibrium; NES = normalized enrichment score.
Figure 6.
Figure 6.
Integrative analysis of rat single-cell RNA sequencing (scRNA-seq) differentially expressed genes (DEGs) with human pulmonary arterial hypertension (PAH) genetics points to the relevance of the DEGs to human PAH. (A) Schematic of analytical approach whereby genes implicated in human PAH were curated from DisGeNET (409 genes) and Comparative Toxicogenomics Database (CTD) (275 genes), of which 102 genes were shared between the databases. These genes were then tested for enrichment in (B) Molecular Signatures Database hallmark pathways and (CE) rat scRNA-seq signatures. (B) Dot plot showing pathways significantly enriched for PAH genes by hypergeometric test (false discovery rate [FDR] < 0.05), whether from the DisGeNET database (green) or the CTD database (purple). The dot size represents the −log10(FDR). These gene sets were highly enriched for known or implicated PAH pathways, such as apoptosis, NF-κB signaling, and endothelial-to-mesenchymal transition and were similar overall to those altered in Sugen-hypoxia (SuHx) and monocrotaline (MCT) rat lung scRNA-seq (Figure 4). (C) Heatmap showing most highly significant (FDR < 0.01) enrichment of PAH genes in MCT (left) and SuHx (right) cell type–specific signatures using gene-set enrichment analysis, in which red indicates upregulation and blue indicates downregulation. The dot size represents −log10(FDR). Significant upregulation of PAH genes was noted in myeloid cell types in both models, and in nonclassical monocytes (ncMonos) in particular. (D and E) Dot plots showing all (left) and top 5 (upper right) cell type–specific rat signature enrichment for PAH genes from the DisGeNET (D) and CTD (E) databases. The red (MCT) and blue (SuHx) dots indicate meeting the FDR < 0.05 criterion, and gray dots indicate values that were not significant (ns). The dot size represents −log10(FDR). A number of significant cell type–specific rat signatures by disease model are shown in the lower right (FDR < 0.05). In the left-sided plots, dots on opposite sides of an NES of 0 for a given row represent opposite directionalities of cell type–specific enrichment of MCT and SuHx models. The SuHx ncMonos DEGs were most highly enriched for PAH genes comparing both models. For the MCT model, DEGs from iMΦs and cDCs demonstrated the strongest enrichment for PAH genes. (F) Schematic of analytical approach for human PAH genome-wide association study (GWAS) integration. Human orthologs of rat scRNA-seq DEGs were assessed for enrichment of genetic variants associated with PAH in human GWAS to further assess human relevance of the rat signatures. GWAS SNPs were filtered by keeping the top 50% by P value strength and LD r2 < 0.5, after which SNPs were mapped to genes by integrating with lung-specific expression quantitative loci (eQTLs) curated from public databases. DEGs within each cell type (P < 0.01 to include DEGs from rare cell types with low statistical power) were then tested for enrichment of these GWAS-integrated expression SNPs (eSNPs). The GWAS P values of each eSNP set (by cell type and disease model) were then compared against that of eSNPs generated from random gene sets to assess the significance of enrichment for stronger GWAS association P values using a modified chi-square statistic. (G) Manhattan plot showing −log10(P) values of 39,263 eSNPs used for rat DEG enrichment analysis after GWAS SNP filtering and eQTL integration as described in F. SNPs are ordered along the x-axis according to their chromosomal location; the colors represent different chromosomes. Select eSNPs are labeled with their reference SNP identifiers and the corresponding genes they regulate. (H) Dot plot showing rat cell type–specific DEGs enriched for PAH-associated genetic variants from human GWAS. Red (MCT) and blue (SuHx) dots indicate an FDR < 0.05, and gray dots indicate values that were ns. The horizontal dashed line corresponds to an FDR = 0.05. The dot size is proportional to the number of enriched GWAS SNPs in the thousands. Significant enrichment for human PAH GWAS signals among DEGs in both rat disease models was noted from a number of immune-cell types of both myeloid and lymphoid origin, supporting that the rat disease signatures are relevant to PAH pathogenesis in humans. LD = linkage disequilibrium; NES = normalized enrichment score.
Figure 7.
Figure 7.
Single-cell RNA sequencing uncovers perturbations in lung vascular cell types relevant to human pulmonary arterial hypertension (PAH). (A) Uniform manifold approximation and projection plot showing vascular cells from 18 rat lungs with clusters labeled by cell type. (B) Heatmap showing normalized expression of top marker genes used to identify the vascular cell types, in which each row is an individual cell. Shown to the left are the condition and cell type to which each cell belongs. (C) Volcano plots showing differentially expressed genes (DEGs) within vascular cell types for the Sugen-hypoxia (SuHx) or monocrotaline (MCT) models versus the control model, in which the x-axis represents MAST (Model-based Analysis of Single-Cell Transcriptomics) z-scores and the y-axis indicates −log10(P). Significant upregulated (z > 0) or downregulated (z < 0) genes are shown as red (P < 0.05) or dark red (false discovery rate [FDR] < 0.05) dots. DEGs (P < 0.05) labeled and highlighted in yellow represent human PAH-associated genes from either (black text) or both (red text) of the CTD and DisGeNET databases. Otherwise, DEGs are labeled with their gene names if the FDR < 0.05 (endothelial arterial type 1 cell [EA1]) or P < 0.01 (EA2, SMC, Fb). (D) Dot plots showing the top five upregulated and top five downregulated pathways within vascular cell types as determined by gene-set enrichment analysis. Colored dots in red (MCT) or blue (SuHx) indicate significant values (P < 0.05), whereas gray dots represent values that were not significant (ns). The dot size corresponds to the −log10(P) value. (E) Box plots showing expression of select DEGs in rat lung vascular cell types with similar changes shown side by side in human orthologs from public cell type–specific expression data sets: BMPR2: Gene Expression Omnibus series (GSE) 126262, primary PAECs from two patients with PAH with BMPR2 mutations versus nine unused donor controls; FOXF1: GSE126262, primary PAECs from four male patients with PAH versus five male unused donor controls; CST3, STAT3, SGK1 and AMD1: GSE70456, four BMPR2 siRNA–transfected versus four control siRNA–transfected primary human PAECs from four donors; MGP, MMP2, CCND1, F2R, FBN1, and EPAS1: GSE2559, primary human PASMCs from two patients with PAH versus two normal subjects (n = 4 vs. 3, respectively, including BMP2-treated vs. untreated). P values from RNA sequencing (GSE126262) were determined by using DESeq2, whereas those from microarray (GSE70456 and GSE2559) were determined by using R limma: *P < 0.05, **P < 0.01, ***P < 0.001, and ****FDR < 0.05. CTD = Comparative Toxicogenomics Database; Fb = fibroblast; KD = knockdown; NES = normalized enrichment score; PAEC = pulmonary artery endothelial cell; PASMC = pulmonary arterial SMC; SMC = smooth muscle cell.
Figure 7.
Figure 7.
Single-cell RNA sequencing uncovers perturbations in lung vascular cell types relevant to human pulmonary arterial hypertension (PAH). (A) Uniform manifold approximation and projection plot showing vascular cells from 18 rat lungs with clusters labeled by cell type. (B) Heatmap showing normalized expression of top marker genes used to identify the vascular cell types, in which each row is an individual cell. Shown to the left are the condition and cell type to which each cell belongs. (C) Volcano plots showing differentially expressed genes (DEGs) within vascular cell types for the Sugen-hypoxia (SuHx) or monocrotaline (MCT) models versus the control model, in which the x-axis represents MAST (Model-based Analysis of Single-Cell Transcriptomics) z-scores and the y-axis indicates −log10(P). Significant upregulated (z > 0) or downregulated (z < 0) genes are shown as red (P < 0.05) or dark red (false discovery rate [FDR] < 0.05) dots. DEGs (P < 0.05) labeled and highlighted in yellow represent human PAH-associated genes from either (black text) or both (red text) of the CTD and DisGeNET databases. Otherwise, DEGs are labeled with their gene names if the FDR < 0.05 (endothelial arterial type 1 cell [EA1]) or P < 0.01 (EA2, SMC, Fb). (D) Dot plots showing the top five upregulated and top five downregulated pathways within vascular cell types as determined by gene-set enrichment analysis. Colored dots in red (MCT) or blue (SuHx) indicate significant values (P < 0.05), whereas gray dots represent values that were not significant (ns). The dot size corresponds to the −log10(P) value. (E) Box plots showing expression of select DEGs in rat lung vascular cell types with similar changes shown side by side in human orthologs from public cell type–specific expression data sets: BMPR2: Gene Expression Omnibus series (GSE) 126262, primary PAECs from two patients with PAH with BMPR2 mutations versus nine unused donor controls; FOXF1: GSE126262, primary PAECs from four male patients with PAH versus five male unused donor controls; CST3, STAT3, SGK1 and AMD1: GSE70456, four BMPR2 siRNA–transfected versus four control siRNA–transfected primary human PAECs from four donors; MGP, MMP2, CCND1, F2R, FBN1, and EPAS1: GSE2559, primary human PASMCs from two patients with PAH versus two normal subjects (n = 4 vs. 3, respectively, including BMP2-treated vs. untreated). P values from RNA sequencing (GSE126262) were determined by using DESeq2, whereas those from microarray (GSE70456 and GSE2559) were determined by using R limma: *P < 0.05, **P < 0.01, ***P < 0.001, and ****FDR < 0.05. CTD = Comparative Toxicogenomics Database; Fb = fibroblast; KD = knockdown; NES = normalized enrichment score; PAEC = pulmonary artery endothelial cell; PASMC = pulmonary arterial SMC; SMC = smooth muscle cell.
Figure 8.
Figure 8.
Integration of rat differentially expressed genes (DEGs) with Connectivity Map identifies potential candidate drugs for repositioning. (A) Schematic of analytical approach whereby signatures of rat DEGs (P < 0.01 to include DEGs from rare cell types with low statistical power) for each cell type for both Sugen-hypoxia (SuHx) and monocrotaline (MCT) models against the control model were queried against the full Connectivity Map database of compound and genetic perturbational expression signatures induced in human cell lines. The pattern-matching algorithms scored each reference perturbagen profile for the direction and strength of enrichment with the query single-cell RNA sequencing (scRNA-seq) DEG signature. Perturbagens with strongly positive connectivity scores have highly similar signatures to that of the query, whereas those perturbagens with strongly negative scores have signatures that strongly oppose that of the query (i.e., genes that are upregulated in the scRNA-seq DEG query are downregulated by treatment with the perturbagen or vice versa). (B) Heatmap showing connectivity scores of rat scRNA-seq DEGs to drugs approved for use in patients with pulmonary arterial hypertension (PAH) (black), drugs currently or previously in PAH clinical trials (blue), and preclinical drugs with demonstrated efficacy in PAH animal models (green). The size of dots corresponds to absolute values of the connectivity score. The PAH-related drugs showed distinct matching patterns to cell type–specific PAH rat signatures. For example, bosentan and tacrolimus had very similar connectivity profiles across cell types and disease models, although they come from different classes of drugs. (C) The top 10 drugs with the most negative connectivity scores, which are thus predicted to most strongly reverse the transcriptional signature of SuHx nonclassical monocytes (ncMonos), are shown (out of 2,429 compounds screened). The drugs predicted against SuHx ncMonos were of particular interest, given the strong upregulation of both NF-κB signaling and human PAH genes. The drug with the most negative connectivity score was treprostinil, one of the most effective PAH-targeted therapies currently in use in patients with advanced PAH.
Figure 9.
Figure 9.
The PVD Single-Cell Omics website offers an open-access online platform. The entire rat single-cell RNA sequencing gene-expression data set and lists of cell type–specific marker genes and disease differentially expressed genes are available online in the form of an interactive cell browser at http://mergeomics.research.idre.ucla.edu/PVDSingleCell/CellBrowser/. Connectivity scores of the entire panel of perturbagens from the CMap analysis are available to query at http://mergeomics.research.idre.ucla.edu/PVDSingleCell/CMap/. CMap = Connectivity Map; PAH = pulmonary arterial hypertension; PVD = pulmonary vascular disease.

Comment in

References

    1. Benza RL, Miller DP, Barst RJ, Badesch DB, Frost AE, McGoon MD. An evaluation of long-term survival from time of diagnosis in pulmonary arterial hypertension from the REVEAL registry. Chest. 2012;142:448–456. - PubMed
    1. Thenappan T, Ormiston ML, Ryan JJ, Archer SL. Pulmonary arterial hypertension: pathogenesis and clinical management. BMJ. 2018;360:j5492. - PMC - PubMed
    1. Reyfman PA, Walter JM, Joshi N, Anekalla KR, McQuattie-Pimentel AC, Chiu S, et al. Single-cell transcriptomic analysis of human lung provides insights into the pathobiology of pulmonary fibrosis. Am J Respir Crit Care Med. 2019;199:1517–1536. - PMC - PubMed
    1. Lambrechts D, Wauters E, Boeckx B, Aibar S, Nittner D, Burton O, et al. Phenotype molding of stromal cells in the lung tumor microenvironment. Nat Med. 2018;24:1277–1289. - PubMed
    1. Vieira Braga FA, Kar G, Berg M, Carpaij OA, Polanski K, Simon LM, et al. A cellular census of human lungs identifies novel cell states in health and in asthma. Nat Med. 2019;25:1153–1163. - PubMed

Publication types

MeSH terms

Substances