

A quantitative evaluation of aerosol generation during tracheal intubation and extubation
- PMID: 33022093
- PMCID: PMC7675579
- DOI: 10.1111/anae.15292
A quantitative evaluation of aerosol generation during tracheal intubation and extubation
Abstract
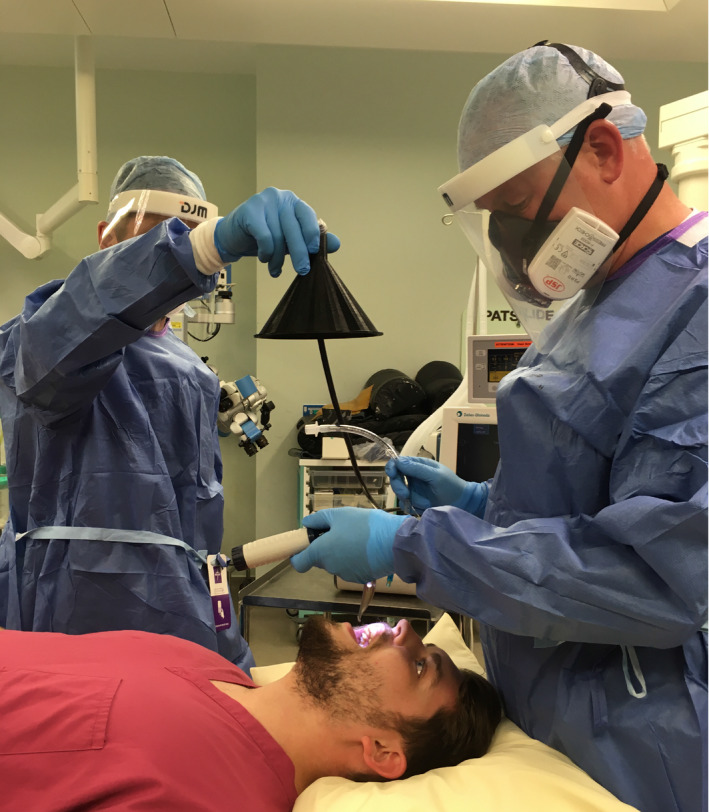
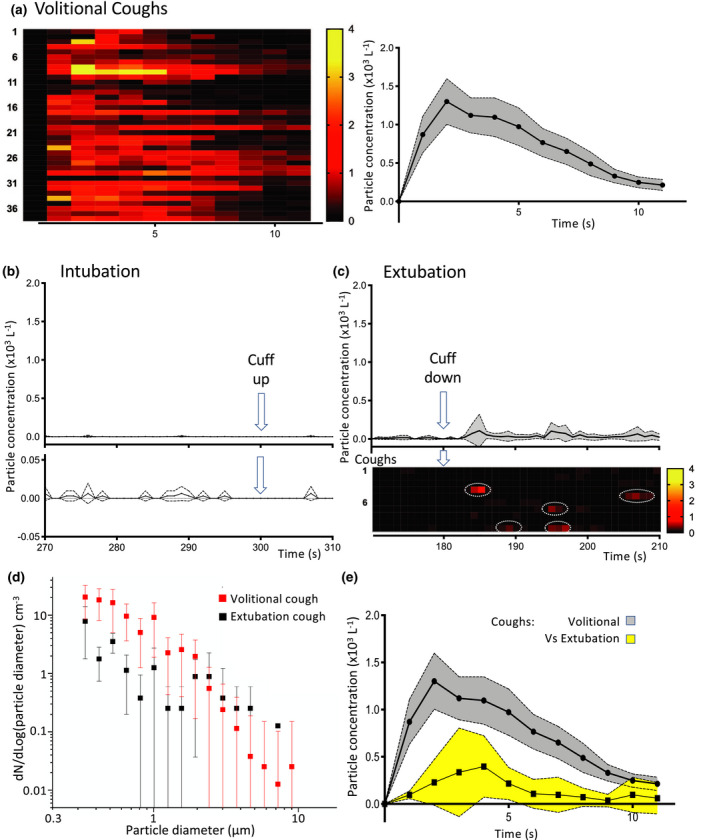
The potential aerosolised transmission of severe acute respiratory syndrome coronavirus-2 is of global concern. Airborne precaution personal protective equipment and preventative measures are universally mandated for medical procedures deemed to be aerosol generating. The implementation of these measures is having a huge impact on healthcare provision. There is currently a lack of quantitative evidence on the number and size of airborne particles produced during aerosol-generating procedures to inform risk assessments. To address this evidence gap, we conducted real-time, high-resolution environmental monitoring in ultraclean ventilation operating theatres during tracheal intubation and extubation sequences. Continuous sampling with an optical particle sizer allowed characterisation of aerosol generation within the zone between the patient and anaesthetist. Aerosol monitoring showed a very low background particle count (0.4 particles.l-1 ) allowing resolution of transient increases in airborne particles associated with airway management. As a positive reference control, we quantitated the aerosol produced in the same setting by a volitional cough (average concentration, 732 (418) particles.l-1 , n = 38). Tracheal intubation including facemask ventilation produced very low quantities of aerosolised particles (average concentration, 1.4 (1.4) particles.l-1 , n = 14, p < 0.0001 vs. cough). Tracheal extubation, particularly when the patient coughed, produced a detectable aerosol (21 (18) l-1 , n = 10) which was 15-fold greater than intubation (p = 0.0004) but 35-fold less than a volitional cough (p < 0.0001). The study does not support the designation of elective tracheal intubation as an aerosol-generating procedure. Extubation generates more detectable aerosol than intubation but falls below the current criterion for designation as a high-risk aerosol-generating procedure. These novel findings from real-time aerosol detection in a routine healthcare setting provide a quantitative methodology for risk assessment that can be extended to other airway management techniques and clinical settings. They also indicate the need for reappraisal of what constitutes an aerosol-generating procedure and the associated precautions for routine anaesthetic airway management.
Keywords: COVID-19; SARS-COV-2; aerosol-generating procedure; extubation; intubation.
© 2020 The Authors. Anaesthesia published by John Wiley & Sons Ltd on behalf of Association of Anaesthetists.
Figures
Comment in
-
Is there a role for cough suppression techniques in the COVID-19 era?Anaesthesia. 2021 Mar;76 Suppl 3:13-14. doi: 10.1111/anae.15308. Epub 2020 Nov 10. Anaesthesia. 2021. PMID: 33169833 No abstract available.
-
A quantitative evaluation of aerosol generation during tracheal intubation and extubation: a response.Anaesthesia. 2021 Mar;76 Suppl 3:14-15. doi: 10.1111/anae.15309. Epub 2020 Nov 10. Anaesthesia. 2021. PMID: 33169836 No abstract available.
-
A quantitative evaluation of aerosol generation during tracheal intubation and extubation.Anaesthesia. 2021 Mar;76 Suppl 3(Suppl 3):15-16. doi: 10.1111/anae.15326. Epub 2020 Nov 23. Anaesthesia. 2021. PMID: 33227146 Free PMC article. No abstract available.
-
Are tracheal intubation and extubation aerosol-generating procedures?Anaesthesia. 2021 Feb;76(2):151-155. doi: 10.1111/anae.15328. Epub 2020 Dec 4. Anaesthesia. 2021. PMID: 33274761 Free PMC article. No abstract available.
-
Reconciling aerosol generation data with actual rates of infection data.Anaesthesia. 2021 Mar;76 Suppl 3:27-28. doi: 10.1111/anae.15330. Epub 2020 Dec 6. Anaesthesia. 2021. PMID: 33280082 No abstract available.
References
-
- Cook TM. Personal protective equipment during the coronavirus disease (COVID) 2019 pandemic – a narrative review. Anaesthesia 2020; 75: 920–7. - PubMed
MeSH terms
Substances
Grants and funding
LinkOut - more resources
Full Text Sources
Other Literature Sources
Medical
Miscellaneous
