. 2020 Nov 17;53(5):1001-1014.e20.
doi: 10.1016/j.immuni.2020.09.003. Epub 2020 Oct 5.

T Cell Receptor Is Required for Differentiation, but Not Maintenance, of Intestinal CD4+ Intraepithelial Lymphocytes

Affiliations

T Cell Receptor Is Required for Differentiation, but Not Maintenance, of Intestinal CD4+ Intraepithelial Lymphocytes

Angelina M Bilate et al. Immunity. .

Abstract

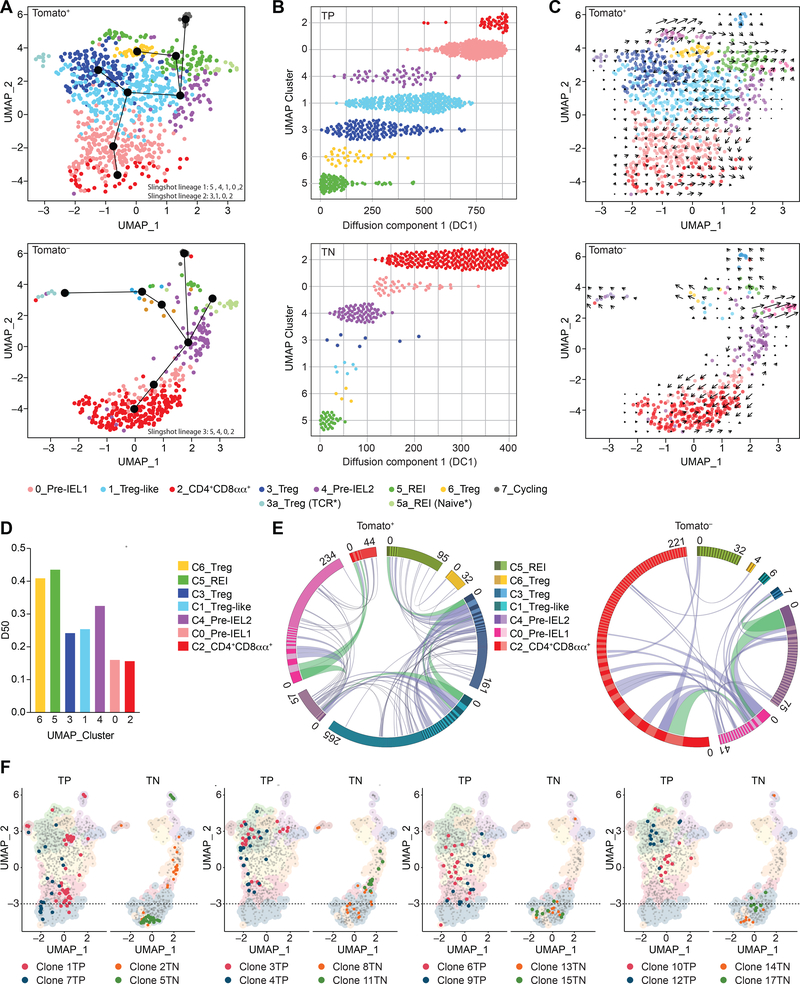
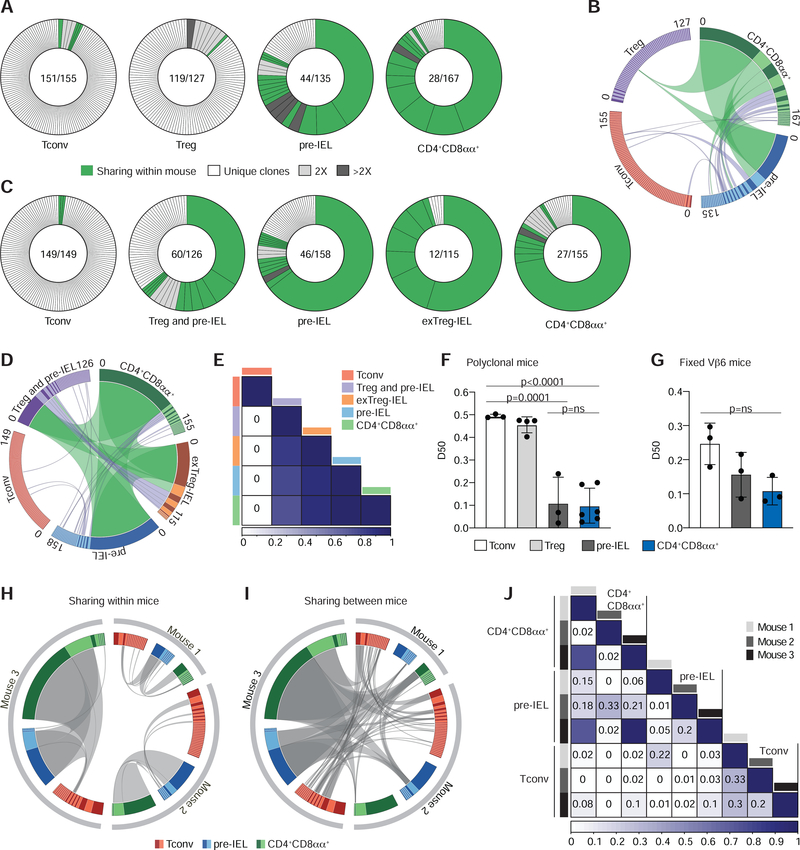
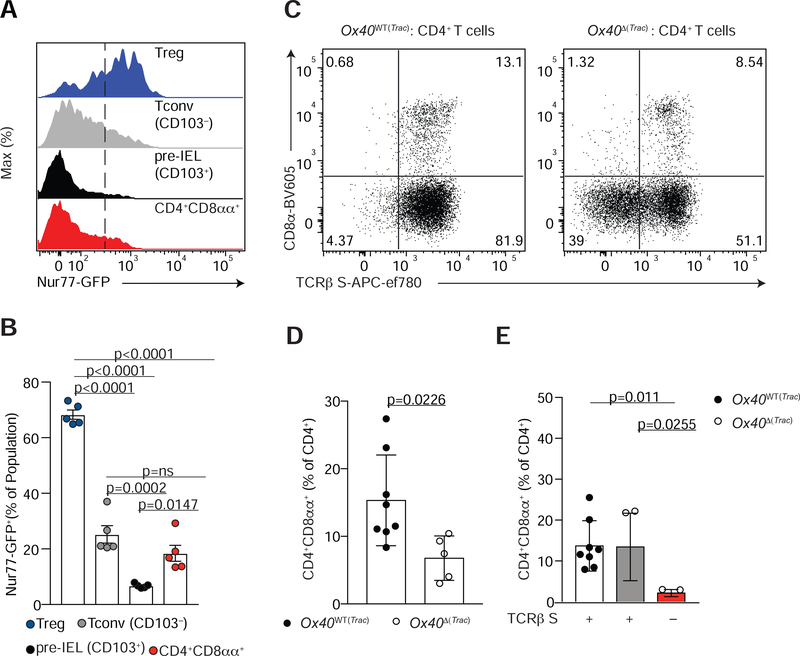
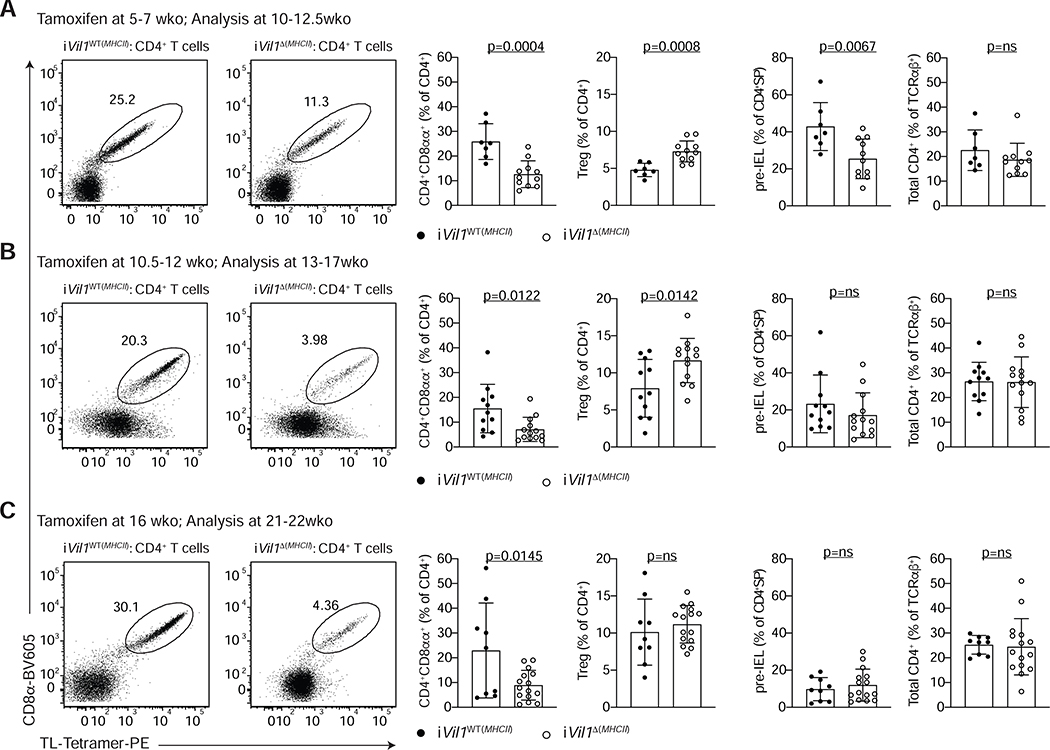
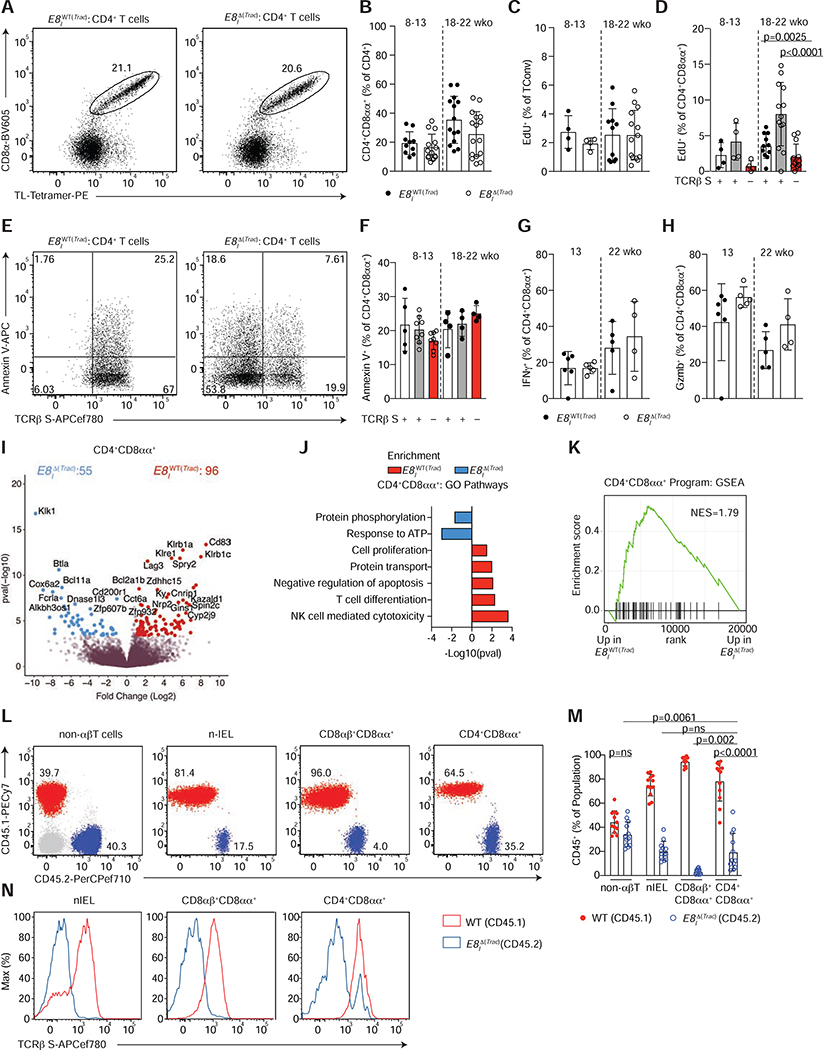
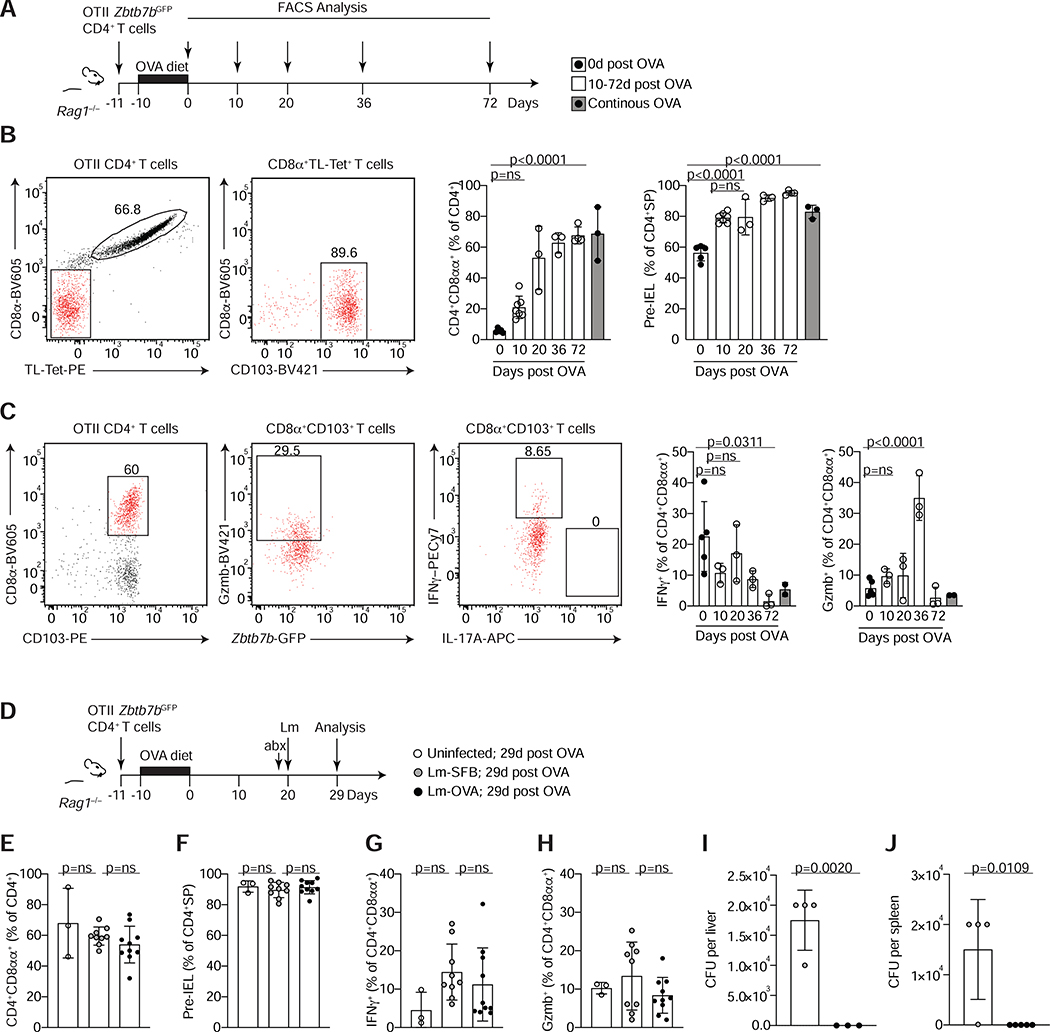
The gut epithelium is populated by intraepithelial lymphocytes (IELs), a heterogeneous T cell population with cytotoxic and regulatory properties, which can be acquired at the epithelial layer. However, the role of T cell receptor (TCR) in this process remains unclear. Single-cell transcriptomic analyses revealed distinct clonal expansions between cell states, with CD4+CD8αα+ IELs being one of the least diverse populations. Conditional deletion of TCR on differentiating CD4+ T cells or of major histocompatibility complex (MHC) class II on intestinal epithelial cells prevented CD4+CD8αα+ IEL differentiation. However, TCR ablation on differentiated CD4+CD8αα+ IELs or long-term cognate antigen withdraw did not affect their maintenance. TCR re-engagement of antigen-specific CD4+CD8αα+ IELs by Listeria monocytogenes did not alter their state but correlated with reduced bacterial invasion. Thus, local antigen recognition is an essential signal for differentiation of CD4+ T cells at the epithelium, yet differentiated IELs are able to preserve an effector program in the absence of TCR signaling.

Keywords: T cell receptor; TCR repertoire; cell plasticity; intestinal epithelium; intestinal intraepithelial lymphocytes; single-cell gene expression; tissue adaptation.


Conflict of interest statement

Declaration of Interests The authors declare no competing interests.

Figures

Figure 1.
Figure 1.. Clonal distribution of intraepithelial CD4+ T cells follows single-cell trajectories.
(A-F) Tomato+ (library 1) and Tomato (library 2) CD4+ T cells from the intestinal epithelium (IE) of a iFoxp3Tomato mouse were sorted for scRNAseq. Cells clustered into 8 (C_0–7) populations, including sub-clusters (3a, 5a) and visualized by UMAP. Cluster names correspond to colors as indicated. (A) Slingshot pseudotime trajectory of Tomato+ (top) and Tomato (bottom) cells on the UMAP. CD4+CD8αα+-specific slingshot lineages (black lines) depicted in differentiation order. White numbers indicate clusters. (B) Cells ordered along diffusion component 1, separated by clusters of Tomato+ (TP, top) and Tomato (TN, bottom) cells. (C) RNA velocity analysis vectors (arrows) of Tomato+ (top) and Tomato (bottom) cells on the UMAP. (D) Diversity 50 (D50) estimate based on paired αβTCRs. (E) Circos plot of paired αβTCR CDR3 sequences; clones ordered clockwise in decreasing size. Links denote clonal sharing between populations of adjacent clusters; clonal expansions of less than 10 cells in purple and at least 10 cells in green among Tomato+ (left) and Tomato (right) cells. (F) Top expanded clones per Tomato+ (TP, red and blue) and Tomato (TN, orange and green) cells. Dashed line marks top limit of CD4+CD8αα+ cluster 2. N=1 mouse, 1,294 sequenced cells. See also Figure S1, Table S1, S2.
Figure 2.
Figure 2.. CD4+CD8αα+ IELs are clonally expanded with decreased TCR diversity.
(A-F) TCRβ and TCRα of single intestinal epithelium (IE) CD4+ T cells were sequenced via the MiSeq platform. (A, B) CD4+ conventional (Tconv; RFPCD103CD8α), regulatory T cells (Treg; RFP+), pre-IEL (RFPCD103+CD8α) and CD4+CD8αα+ (RFPCD103+CD8α+) from Foxp3RFPNur77GFP mice were analyzed. (A) αβTCR clonal diversity from 1 of 2 sequenced mice. Each slice represents a distinct αβTCR CDR3. Shared clones within each mouse in green, unique clones in white, and grey-scale represents expanded clones. Enclosed numbers indicate number of clones (numerator) and total number of cells (denominator). (B) Circos plot of paired αβTCR CDR3 sequences, with clones ordered clockwise in decreasing size. Links indicate clonal sharing between populations from 1 of 2 sequenced mice; clonal expansions of less than 10 cells in purple, and at least 10 cells in green. (C-E) CD4+ conventional (Tconv; Tomato CD103CD8α), regulatory T cells mixed with Treg cells-derived pre-IELs (Treg and pre-IEL; Tomato+CD8α), Tconv-derived pre-IELs (pre-IEL; TomatoCD103+CD8α), Treg cells-derived IELs (exTreg-IEL; Tomato+CD103+ CD8α+) and Tconv derived IELs (CD4+CD8αα+; Tomato CD103+CD8α+) from Foxp3eGFP-cre-ERT2 x Rosa26lsl-tdTomato (iFoxp3Tom) mice were analyzed. (C) αβTCR clonal diversity from 1 of 2 sequenced mice. Label scheme as in (A). (D) Circos plot as in (B) of 1 of 2 sequenced mice. (E) Normalized Morisita-Horn index of paired αβTCR per population from 1 of 2 sequenced mice. (F) Diversity 50 (D50) estimate, pooled from all sequenced mice: Tconv (CD103CD8α), Treg cell (Foxp3RFP+ or Foxp3GFP+), pre-IEL (CD103+CD8α), and CD4+CD8αα+ (CD103+CD8α+). (G-J) TCRα of Vα2+ Vβ6+ CD4+ T cells from three fixed-Vβ6 x Foxp3GFP mice were sequenced via the MiSeq platform as follows: Tconv (CD103CD8α), pre-IEL (CD103+CD8α) and CD4+CD8αα+ (CD103+CD8α). (G) D50 per population and mouse. (H, I) Circos plots as in (B) and (D) show clonal distribution and overlap of TCRα CDR3 sequences between populations within each mouse (private clones) (H) and sharing between mice (public clones) (I). Grey links denote clonal overlap. (J) Normalized Morisita-Horn index of TCRα per population and mouse. N=2 (A, B; C-E; F), N=3 (G-J). Significant p values as indicated [one-way ANOVA and Bonferroni (F, G)]. See also Figure S2 and Table S3.
Figure 3.
Figure 3.. TCR signaling is required for CD4+CD8αα+ IEL differentiation.
(A, B) Nur77 as measured by GFP fluorescence (A) and frequency (B) among Foxp3+ regulatory T cells (Treg, RFP+; blue), conventional CD4+ T cells (Tconv, RFPCD8α; grey), pre-IELs (RFPCD103+CD8α; black) and CD4+CD8αα+ IELs (RFP CD8α+TL-Tetramer+; red) in the intestinal epithelium (IE) of Nur77GFPFoxp3RFP mice. (C-E) Flow cytometry analysis of CD4+ T cells in the IE of Ox40WT(Trac) (Trac+/+ OX40cre+/− or Tracf/f Ox40cre−/−) or OX40Δ(Trac) (Tracf/f Ox40cre+/−) mice. (C) Dot plots of surface CD8α and TCRβ of CD4+ T cells. Data are expressed as mean +/− SEM of individual mice (n=5 of two independent experiments) (D, E) Frequency of CD4+CD8αα+IELs (CD8α+TL-Tetramer+) among total CD4+ T cells (D) and within TCRβ-sufficient cells from Ox40WT(Trac) (white bar) or Ox40 ΔTrac) (grey bar) mice, or TCRβ-deficient cells from Ox40 Δ (Trac) (red bar) mice (E). Data are expressed as mean +/− SEM of individual mice (n=5–8 of two independent experiments). Significant p values as indicated [student’s t test (D) or one-way ANOVA and Bonferroni (B, E)]. See also Figure S3.
Figure 4.
Figure 4.. MHCII expression by epithelial cells is required for CD4+CD8αα+ IEL differentiation.
(A-C) Flow cytometry analysis of the intestinal epithelium (IE) of iVil1WT(MHCII) (H2-Ab1+/+ Vil1creERT2+/− or H2-Ab1f/f Vil1creERT2−/−) and iVil1 Δ(MHCII) (H2-Ab1f/f Vil1creERT2+/+) mice after tamoxifen administration to mice of different ages as indicated. Dot plots of surface CD8α and TL-Tetramer expression among CD4+ T cells (left). Frequencies of CD4+CD8αα+ IELs (CD4+CD8α+TL-Tetramer+) or Foxp3+ regulatory cells (Treg) among CD4+ T cells (middle). Frequencies of pre-IELs (CD4+CD103+) among CD4+SP (CD4+CD8αFoxp3) cells and frequencies of total CD4+ cells among TCRαβ+ cells (right). Data are expressed as mean +/− SEM of individual mice (n=7–15, 3–6 independent experiments per timepoint). Significant p values as indicated [student’s t test (A-C)]. See also Figure S4.
Figure 5.
Figure 5.. TCR signaling is not essential for CD4+CD8αα+ IEL maintenance.
(A-H) Flow cytometry analysis of intestinal epithelium (IE) of 8–22 week-old E8IWT(Trac) (Trac+/+ E8Icre+ or Trac+/+ E8Icre− or Tracf/f E8Icre−) or E8I Δ(Trac) (Tracf/f E8Icre+) mice, grouped by age. (A) Dot plots of surface CD8α and TL-Tetramer expression among CD4+ T cells in E8IWT(Trac) (left) or E8IΔ(Trac) (right) mice. (B) Frequency of CD4+CD8αα+ (CD8α+TL-Tetramer+) among CD4+ T cells in E8IWT(Trac) and E8IΔ(Trac) mice. (C, D) Proliferation frequency (measured by EdU incorporation) of CD4+CD8αFoxp3 cells (C) among cells with or without surface TCRβ expression (D). (E, F) Annexin V expression among TCRβ sufficient and deficient CD4+CD8αα+ IELs. (E) Dot plots of Annexin V and surface TCRβ among CD4+CD8αα+ IELs in E8IWT(Trac) (left) or E8IΔ(Trac) (right) mice. (F) Frequencies of Annexin V+ cells among TCR sufficient and deficient CD4+CD8αα+IELs. (G, H) Frequencies of IFNγ (G) and granzyme B (Gzmb) (H) production upon PMA and ionomycin ex-vivo stimulation among CD4+CD8αα+s. (I-K) Bulk RNA-sequencing of TCRβ+ CD4+CD8αα+ IELs from E8IWT(Trac) and TCRβ CD4+CD8αα+ IELs from E8IΔ(Trac) mice (n=3 per group). Volcano plot of differentially expressed genes between indicated populations (p<0.05, in color) (I), selected differentially-enriched gene ontology (GO) pathways between groups (J), and gene set enrichment analysis (GSEA) of CD4+CD8αα+ IEL program, defined by the top differentially-expressed genes in the CD4+CD8αα+ cluster in our single cell RNA-Sequencing from Figure 1 (K). (L-N) Flow cytometry analysis of bone marrow chimeras in sub-lethally irradiated Rag1−/− hosts reconstituted with 1:1 ratio of WT CD45.1+ and E8IΔ(Trac) CD45.2+ cells. Dot plots (L) and frequency (M) of WT CD45.1+ (red) and E8IΔ(Trac) CD45.2+ (blue) cells among non-αβT cells (γδT cells and non-T cells), natural IELs (nIEL, CD4CD8αα+CD8βTL-Tetramer+), CD8αβ+CD8αα+ cells (CD4CD8αα+CD8β+TL-Tetramer+), and CD4+CD8αα+ IELs in the epithelium. (N) Histograms of surface TCRβ expression in WT CD45.1+ (red line) and E8IΔ(Trac) CD45.2+ (blue line) cells of indicated populations. Frequency data are expressed as mean +/− SEM (B-F). Significant p values as indicated [student’s t test (B, C, G, H) or one-way ANOVA and Bonferroni (D, F)]. n=10–16, 6 experiments in total (B), n=4–14, 2 experiments (C, D), n=5–8, 2 experiments (F) n=4–6, 2 experiments (G, H) and n=12, 3 independent experiments (M). See also Figure S5 and Tables S4–S6.
Figure 6.
Figure 6.. Cognate ligand interaction is dispensable for the maintenance of CD4+CD8αα+ IELs under steady state or after Listeria monocytogenes infection.
(A-C) Total splenocytes and lymph node cells from OTII Zbtb7bGFP Rag1−/− mice were transferred to Rag1−/− animals prior to ovalbumin (OVA) diet treatment and analyzed at different time points after OVA withdrawal as indicated. (A) Experimental layout. (B) Dot plots of surface CD8α and TL-Tetramer expression among total OTII CD4+ T cells (left) and of CD8α and CD103 expression among CD8β CD4+ T cells (middle) 36 days after OVA removal. Graphs show frequencies of CD4+CD8αα+IELs among total OTII (Vα2+) CD4+ T cells (middle) and of pre-IELs (CD8α CD103+) among CD4 single positive (CD4+SP) cells (OTII CD4+ CD8α) (right) at indicated times after OVA removal in white and after continuous OVA diet for 30 or 82 days in grey bars. (C) Dot plots of surface CD8α and CD103 expression among total OTII CD4+ T cells (left), granzyme B (Gzmb) and Zbtb7b-GFP among CD4+CD8αα+ (CD103+CD8α+, middle) and IFNγ and IL-17A among CD4+CD8αα+ (right) 36 days after OVA removal and ex-vivo stimulation with PMA and ionomycin. Graphs represent frequencies of IFNγ and Gzmb production among CD4+CD8αα+ (CD8α+ CD103+) as in (B). (D-J) Rag1−/− animals were treated as in (A) and 20 days after OVA removal, animals were infected with Listeria monocytogenes expressing full length SFB protein 3340 or OVA (Lm-SFB or Lm-OVA, respectively) or were left uninfected. All mice were treated with streptomycin 24h prior to infection and analyzed 9 days after infection. (D) Experimental layout. (E) Frequencies of CD4+CD8αα+ among total OTII CD4+ T cells. (F) Frequencies of pre-IELs among CD4+SP cells. (G, H) Frequencies of IFNγ (G) and Gzmb (H) among ex-vivo PMA and ionomycin stimulated CD4+CD8αα+IELs. (I, J) Colony forming units (CFU) per liver (I) or spleen (J) 9 days post infection. Data are expressed as mean +/− SEM of individual mice (n=3–5, 2 experiments (A-C) and n= 3–9, 2 experiments (D-J)). Significant p values as indicated [student’s t test (I, J) or one-way ANOVA and Bonferroni (B, C, E-H)]. See also Figure S6.

References

    1. Alexa A, and Rahnenfuhrer J (2019). topGO: Enrichment Analysis for Gene Ontology. R package version 2.24.0.
    1. Angerer P, Haghverdi L, Buttner M, Theis FJ, Marr C, and Buettner F (2016). destiny: diffusion maps for large-scale single cell data in R. Bioinformatics 32, 1241–1243. - PubMed
    1. Atarashi K, Tanoue T, Oshima K, Suda W, Nagano Y, Nishikawa H, Fukuda S, Saito T, Narushima S, Hase K, et al. (2013). Treg induction by a rationally selected mixture of Clostridia strains from the human microbiota. Nature 500, 232–236. - PubMed
    1. Beura LK, Fares-Frederickson NJ, Steinert EM, Scott MC, Thompson EA, Fraser KA, Schenkel JM, Vezys V, and Masopust D (2019). CD4(+) resident memory T cells dominate immunosurveillance and orchestrate local recall responses. J Exp Med 216, 1214–1229. - PMC - PubMed
    1. Bilate AM, Bousbaine D, Mesin L, Agudelo M, Leube J, Kratzert A, Dougan SK, Victora GD, and Ploegh HL (2016). Tissue-specific emergence of regulatory and intraepithelial T cells from a clonal T cell precursor. Sci Immunol 1, eaaf7471. - PMC - PubMed

Publication types

MeSH terms

Substances