. 2020 Oct 15;80(2):263-278.e7.
doi: 10.1016/j.molcel.2020.09.018. Epub 2020 Oct 5.

Phosphorylation of PDHA by AMPK Drives TCA Cycle to Promote Cancer Metastasis

Affiliations

Phosphorylation of PDHA by AMPK Drives TCA Cycle to Promote Cancer Metastasis

Zhen Cai et al. Mol Cell. .

Abstract

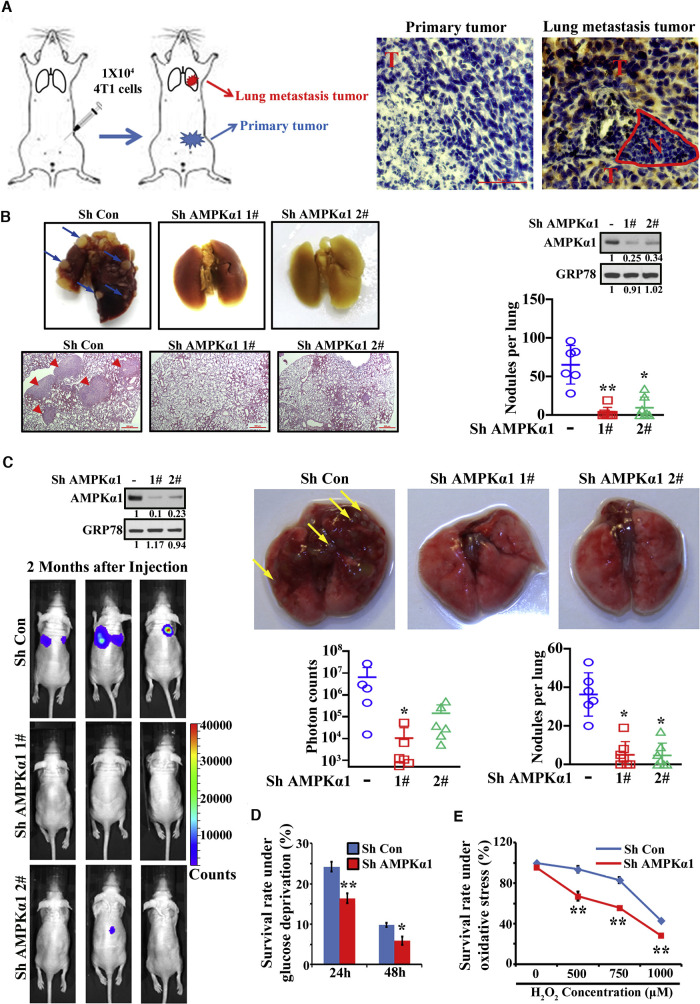
Cancer metastasis accounts for the major cause of cancer-related deaths. How disseminated cancer cells cope with hostile microenvironments in secondary site for full-blown metastasis is largely unknown. Here, we show that AMPK (AMP-activated protein kinase), activated in mouse metastasis models, drives pyruvate dehydrogenase complex (PDHc) activation to maintain TCA cycle (tricarboxylic acid cycle) and promotes cancer metastasis by adapting cancer cells to metabolic and oxidative stresses. This AMPK-PDHc axis is activated in advanced breast cancer and predicts poor metastasis-free survival. Mechanistically, AMPK localizes in the mitochondrial matrix and phosphorylates the catalytic alpha subunit of PDHc (PDHA) on two residues S295 and S314, which activates the enzymatic activity of PDHc and alleviates an inhibitory phosphorylation by PDHKs, respectively. Importantly, these phosphorylation events mediate PDHc function in cancer metastasis. Our study reveals that AMPK-mediated PDHA phosphorylation drives PDHc activation and TCA cycle to empower cancer cells adaptation to metastatic microenvironments for metastasis.

Keywords: AMPK; PDHA; TCA cycle; breast cancer; cancer metastasis; metabolic stress.


Conflict of interest statement

Declaration of Interests The authors declare no competing interests.

Figures

None
Graphical abstract
Figure 1
Figure 1
AMPKα1 Is Essential for Tumor Metastasis (A) AMPK activity by immunostaining of p-AMPKα(T172) in primary tumor and lung metastatic tumor was shown. N, normal; T, tumor. Scale bars indicate 50 μm. (B) Orthotopic metastasis model from AMPKα1 knockdown 4T1 cells was performed. Representative lung tissues, H&E images, and average number of nodules per lung were shown. Arrows indicate metastatic nodules. Scale bars indicate 500 μm. (C) Tail vein injection metastasis model from AMPKα1 knockdown 231 cells was performed. Representative bioluminescence images, lung tissues, and average photon counts and number of nodules per lung were shown. Arrows indicate metastatic nodules. (D) Survival rate of control and AMPKα1 knockdown cells upon glucose deprivation was determined. (E) Survival rate of control and AMPKα1 knockdown cells treated with H2O2 was determined. Data are means ± SEM from 5–7 mice for metastasis assays and means ± SD from 3 independent experiments for other assays. p < 0.05 and ∗∗p < 0.01. See also Figure S1.
Figure 2
Figure 2
TCA Cycle Is Critically Regulated by AMPKα1 (A) Metabolomics analysis in control and AMPKα1 knockdown Hep3B cells was performed. Relative expression levels of three representative TCA intermediates were shown. (B) Relative α-KG level in AMPKα1 knockdown cells and AMPKα1−/−α2−/− MEFs was shown. (C) Relative ATP level in AMPKα1 knockdown cells and AMPKα1−/−α2−/− MEFs was shown. (D) Basal and maximal oxygen consumption rate (OCR) was determined in control and AMPKα1 knockdown cells. (E) The enrichment of isotope derived from 13C3-labeled pyruvate or 13C5-labeled glutamine in TCA intermediates and derivative (glutamate) from TCA cycle was determined by mass spectrometry analysis. Green circle: 13C-labeled carbon atom derived from 13C3-labeled pyruvate; yellow circle: 13C-labeled carbon atom derived from 13C3-labeled glutamine; blank circle: no isotope labeled carbon atom. Data are means ± SD from 3 independent experiments. p < 0.05 and ∗∗p < 0.01. See also Figure S2.
Figure 3
Figure 3
Disruption of PDHc Activity by PDHA Depletion Abolishes Tumor Metastasis (A) PDHc activity (kinetic curve and quantification based on time-dependent absorption change) in control and AMPKα1 knockdown cells and AMPKα1−/−α2−/− MEFs was shown. (B) Relative whole cell and mitochondria Ac-CoA level in control and AMPKα1 knockdown cells was shown. (C) Orthotopic metastasis model from PDHA knockdown 4T1 cells was performed. Representative lung tissues, H&E images, and average number of nodules per lung were shown. Arrows indicate metastatic nodules. (D) Tail vein injection metastasis model from PDHA knockdown MDA-MB-231 cells was performed. Representative lung tissues, H&E images, and average number of nodules per lung were shown. Arrows indicate metastatic nodules. Data are means ± SEM from 5–7 mice for metastasis assays and means ± SD from 3 independent experiments for other assays. p < 0.05 and ∗∗p < 0.01. Scale bars indicate 500 μm. See also Figure S3.
Figure 4
Figure 4
Maintenance of PDHc Activity and TCA Cycle by AMPKα1 Regulates Cell Survival under Diverse Stresses and Tumor Metastasis (A) Relative PDHc activity, ATP, and α-KG level in AMPKα1 knockdown 4T1 cells with restoration of WT or constitutively active PDHA (S293A) were shown. (B) Orthotopic metastasis model from AMPKα1 knockdown 4T1 cells with restoration of WT or PDHA (S293A) was performed. Representative lung tissues, H&E images, and average number of nodules per lung were shown. Arrows indicate metastatic nodules. (C) Tail vein injection metastasis model from AMPKα1 knockdown 231 cells with restoration of WT or PDHA (S293A) was performed. Representative bioluminescence images and average photon counts per lung were shown. (D) Survival rate of control cells and PDHA knockdown cells supplied with vehicle, pyruvate (5 mM), or α-KG (10 mM) under glucose deprivation condition was shown. (E) Survival rate of control cells, AMPKα1 knockdown cells, and AMPKα1 knockdown cells with restoration of PDHA (S293A) supplied with vehicle, pyruvate (5 mM), or α-KG (10 mM) under glucose deprivation was shown. (F) Survival rate upon H2O2 treatment in AMPKα1 knockdown cells with restoration of PDHA (S293A) was shown. Data are means ± SEM from 5–7 mice for metastasis assays and means ± SD from 3 independent experiments for other assays. p < 0.05 and ∗∗p < 0.01. Scale bars indicate 500 μm. See also Figure S3.
Figure 5
Figure 5
AMPK-PDHc Axis Is Activated in Advanced Breast Cancer Patients, and Its Activation Predicts Poor Metastasis-free Survival (A) PDHA S293 phosphorylation was determined in AMPKα1 knockdown cells. (B) PDHA S293 phosphorylation was determined in control and AMPKα1 knockdown cells with or without A-769662 (100 μM) treatment. (C) The interaction between PDHA and PDHK1 was determined in control and AMPKα1 knockdown cells. (D) The interaction between endogenous PDHA and PDHK1 was determined in control and AMPKα1 knockdown cells upon A-769662 treatment. (E) Immunostaining of p-AMPK (T172) and p-PDHA (S293) in breast cancer tissues with different stages were shown. (F) Scatterplot of pAMPK expression versus pPDHA expression in breast cancer tissues was shown. (G) Kaplan-Meier plots showed high expression of pAMPK and low expression of pPDHA significantly predicted metastasis-free survival. Scale bars indicate 100 μm. See also Figure S4 and Tables S1–S3.
Figure 6
Figure 6
PDHA Phosphorylation by AMPK Maintains PDHc Activity (A) Mitochondrial isolation and sub-fractionation were performed, and AMPK and PDHA expression in mitochondrial matrix was determined. Tomm20 is marker for mitochondrial outer membrane, COX4 is marker for mitochondrial inner membrane, and CS is marker for mitochondrial matrix. Mito, mitochondria; WCL, whole cell lysis. (B) p-AMPK (T172) and PDHA co-localization was determined by immunofluorescence in cells upon A-769662 treatment. (C) Phosphorylation level on PDHA or Mff was determined by anti-phosphor-Ser/Thr antibody after in vitro kinase assay. L.E., long exposure; S.E., short exposure. (D) In vitro γ-32P ATP incorporation was determined by incubating recombinant PDHA and active AMPK complex with γ-32P ATP. (E) Phosphorylation level on PDHA was determined by anti-phosphor-Ser/Thr antibody after in vitro kinase assay (left). All the samples were subjected to SDS-PAGE, and PDHA bands were cut for mass spectrometry analysis. Phosphorylation statuses on each sample were shown (right). Relative phosphorylation intensity was indicated by the number of P. (F) Venn diagram was used to integrate phosphorylation site detected by mass spectrometry and phosphorylation site predicted by GPS 3.0 (group-based prediction system; http://gps.biocuckoo.org/). (G) S295 and S314 phosphorylation on WT PDHA and mutant PDHA after in vitro kinase assay was determined by PDHA-specific phospho-antibodies. (H) p-PDHA (S295) and p-PDHA (S314) were determined in control and AMPKα1 knockdown cells treated with glucose deprivation (left) or A-769662 (right). (I) Relative PDHc activity in control and AMPKα1 knockdown cells with or without A-769662 treatment was shown. (J) Relative PDHc activity was determined in purified PDHc with or without in vitro kinase reaction with active AMPK complex. (K) Relative PDHc activity in AMPK knockdown cells with restoration of PDHA WT and mutants was shown. (L) The interaction between PDHK1 and PDHA WT or PDHA mutants was determined. (M) S293 phosphorylation levels of PDHA WT or PDHA mutants were determined. (N) Relative level of pyruvate trapped in purified PDHc with PDHA WT, S295D, or S295A was shown. (O) PDHc was purified from control, AMPK knockdown cells, and AMPK knockdown cells with PDHA S295D or S295A restoration. Relative pyruvate trapped in PDHc was shown. Data are means ± SD from 3 independent experiments. ∗∗p < 0.01. Scale bars indicate 20 μm. See also Figures S5 and S6.
Figure 7
Figure 7
PDHA Phosphorylation by AMPK Is Essential for TCA Cycle and Cancer Metastasis (A) Relative ATP and α-KG level in control, AMPKα1 knockdown alone, and AMPKα1 knockdown cells with restoration of WT PDHA or mutants were shown. (B and C) Orthotopic metastasis model from PDHA knockdown 4T1 cells with WT PDHA or mutants knockin was performed (B). Orthotopic metastasis model from AMPKα1 knockdown 4T1 cells with restoration of WT PDHA or mutants was performed (C). Representative lung tissues, H&E staining, and average number of nodules per lung were shown. Arrows indicate metastatic nodules. (D) Tail vein injection metastasis model from AMPKα1 knockdown 231 cells with restoration of WT PDHA or mutants was performed. Average photon counts per lung were shown. (E) A schematic model is presented to dissect the role of AMPK-PDHc axis in cancer metastasis. Data are means ± SEM from 5–7 mice for metastasis assays and means ± SD from 3 independent experiments for other assays. p < 0.05 and ∗∗p < 0.01. Scale bars indicate 500 μm. See also Figure S7.

Comment in

References

    1. Anderson N.M., Mucka P., Kern J.G., Feng H. The emerging role and targetability of the TCA cycle in cancer metabolism. Protein Cell. 2018;9:216–237. - PMC - PubMed
    1. Appleyard M.V., Murray K.E., Coates P.J., Wullschleger S., Bray S.E., Kernohan N.M., Fleming S., Alessi D.R., Thompson A.M. Phenformin as prophylaxis and therapy in breast cancer xenografts. Br. J. Cancer. 2012;106:1117–1122. - PMC - PubMed
    1. Brown G. Pyruvate dehydrogenase deficiency and the brain. Dev. Med. Child Neurol. 2012;54:395–396. - PubMed
    1. Bungard D., Fuerth B.J., Zeng P.Y., Faubert B., Maas N.L., Viollet B., Carling D., Thompson C.B., Jones R.G., Berger S.L. Signaling kinase AMPK activates stress-promoted transcription via histone H2B phosphorylation. Science. 2010;329:1201–1205. - PMC - PubMed
    1. Burkewitz K., Zhang Y., Mair W.B. AMPK at the nexus of energetics and aging. Cell Metab. 2014;20:10–25. - PMC - PubMed

Publication types

MeSH terms

Substances

LinkOut - more resources