Review
. 2021 May:82:100906.
doi: 10.1016/j.preteyeres.2020.100906. Epub 2020 Oct 3.

Incomplete response to Anti-VEGF therapy in neovascular AMD: Exploring disease mechanisms and therapeutic opportunities

Affiliations
Review

Incomplete response to Anti-VEGF therapy in neovascular AMD: Exploring disease mechanisms and therapeutic opportunities

Priyatham S Mettu et al. Prog Retin Eye Res. 2021 May.

Abstract

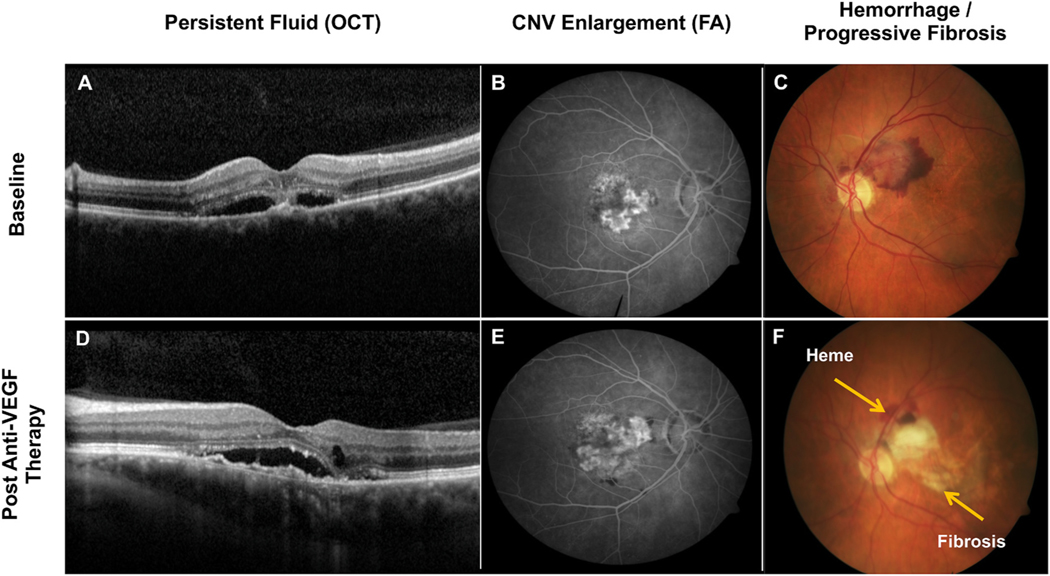
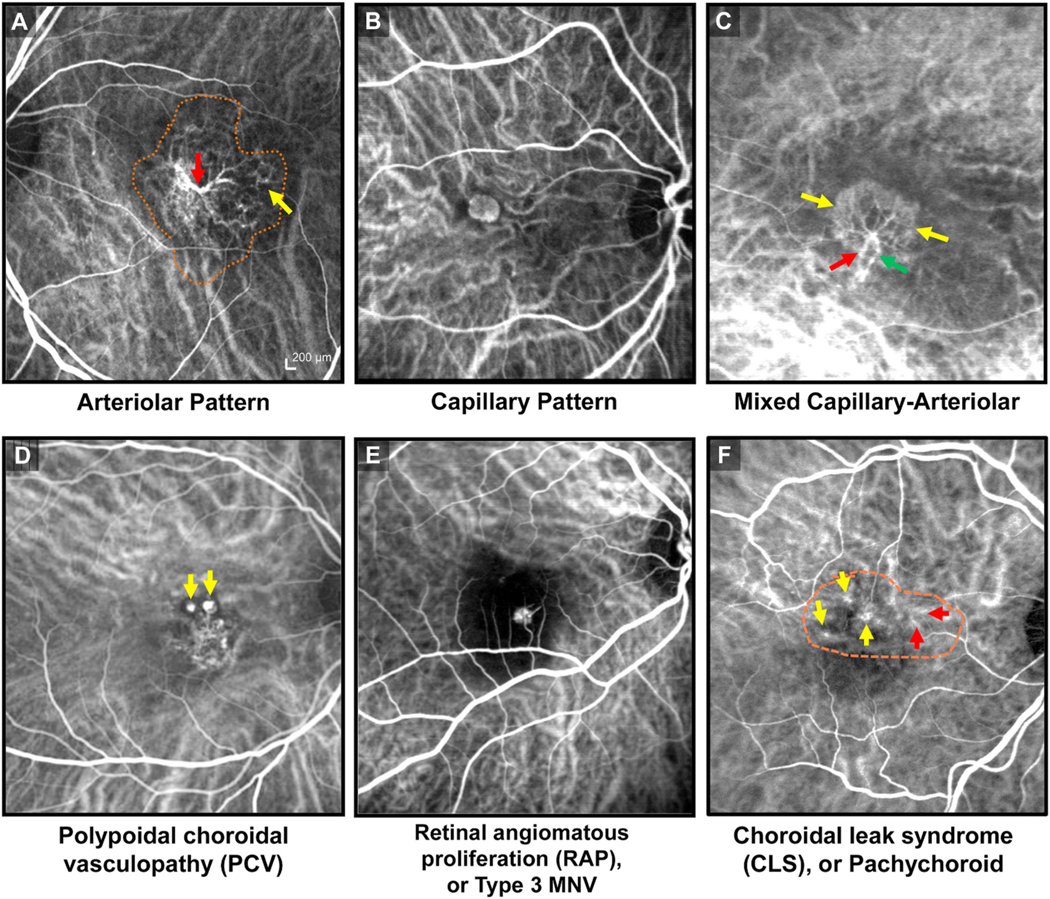
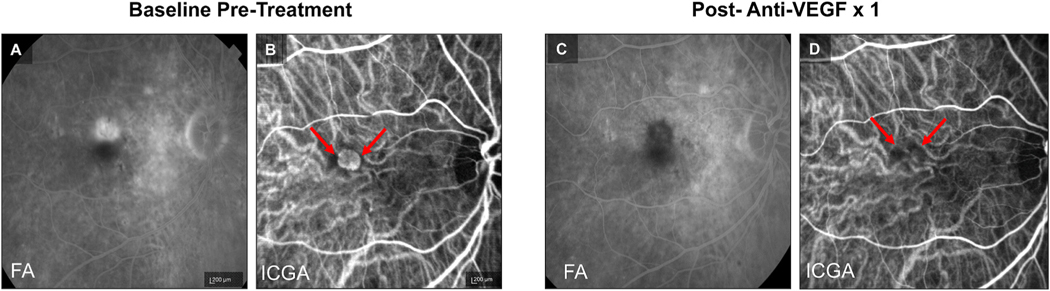
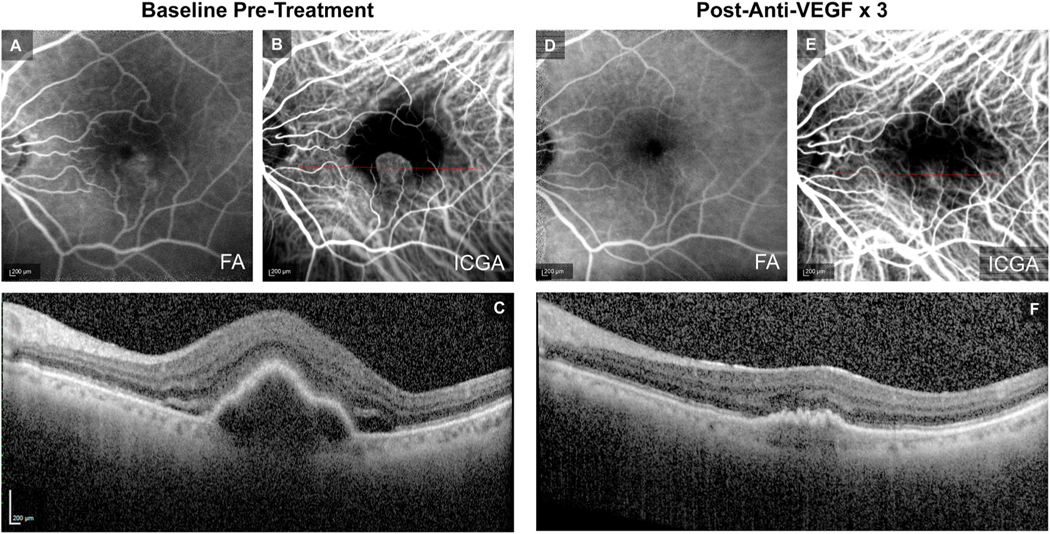
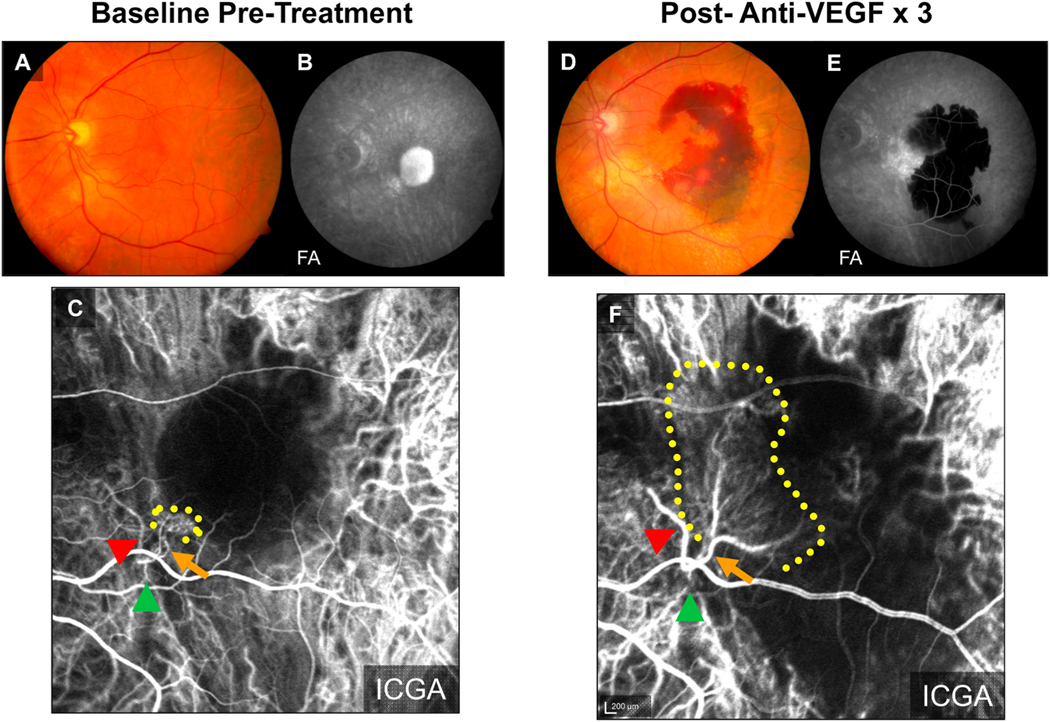
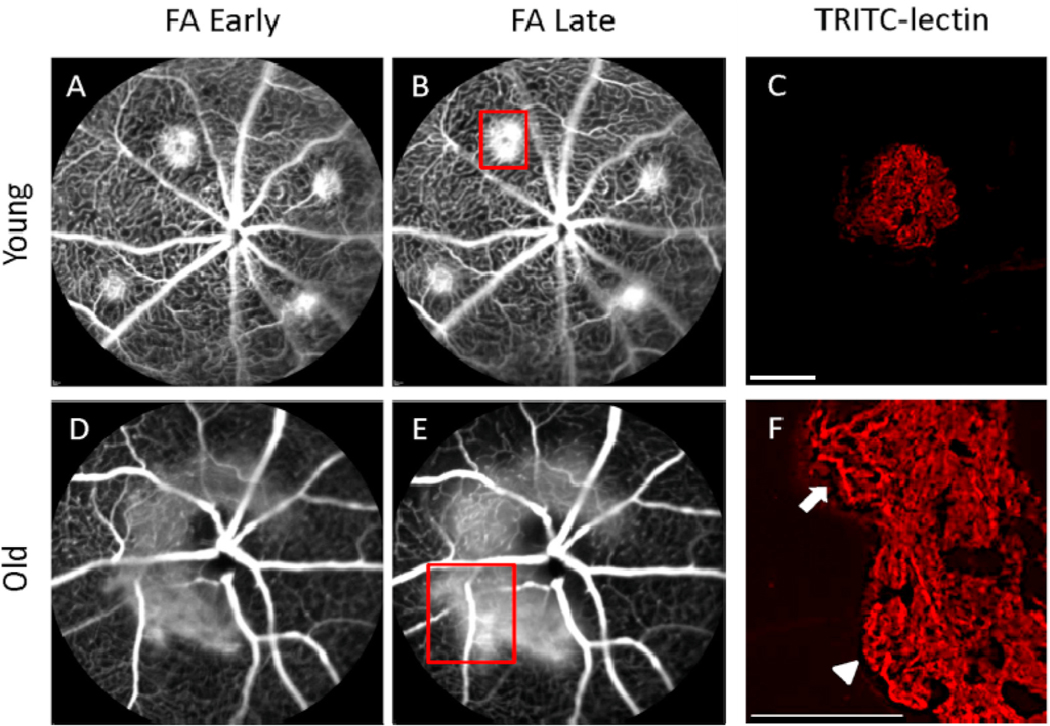
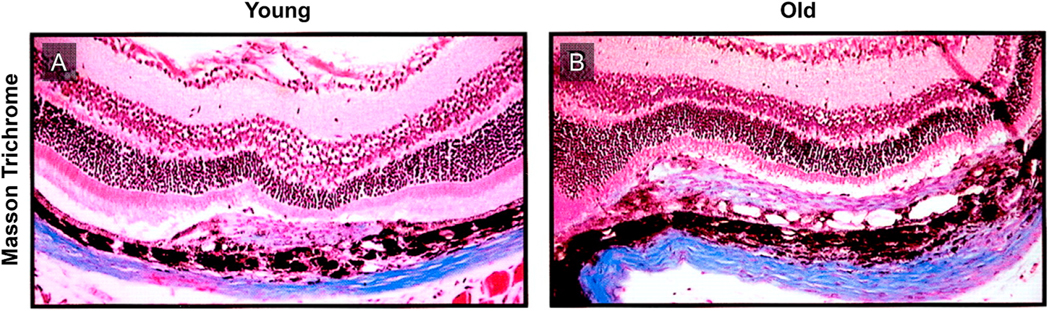
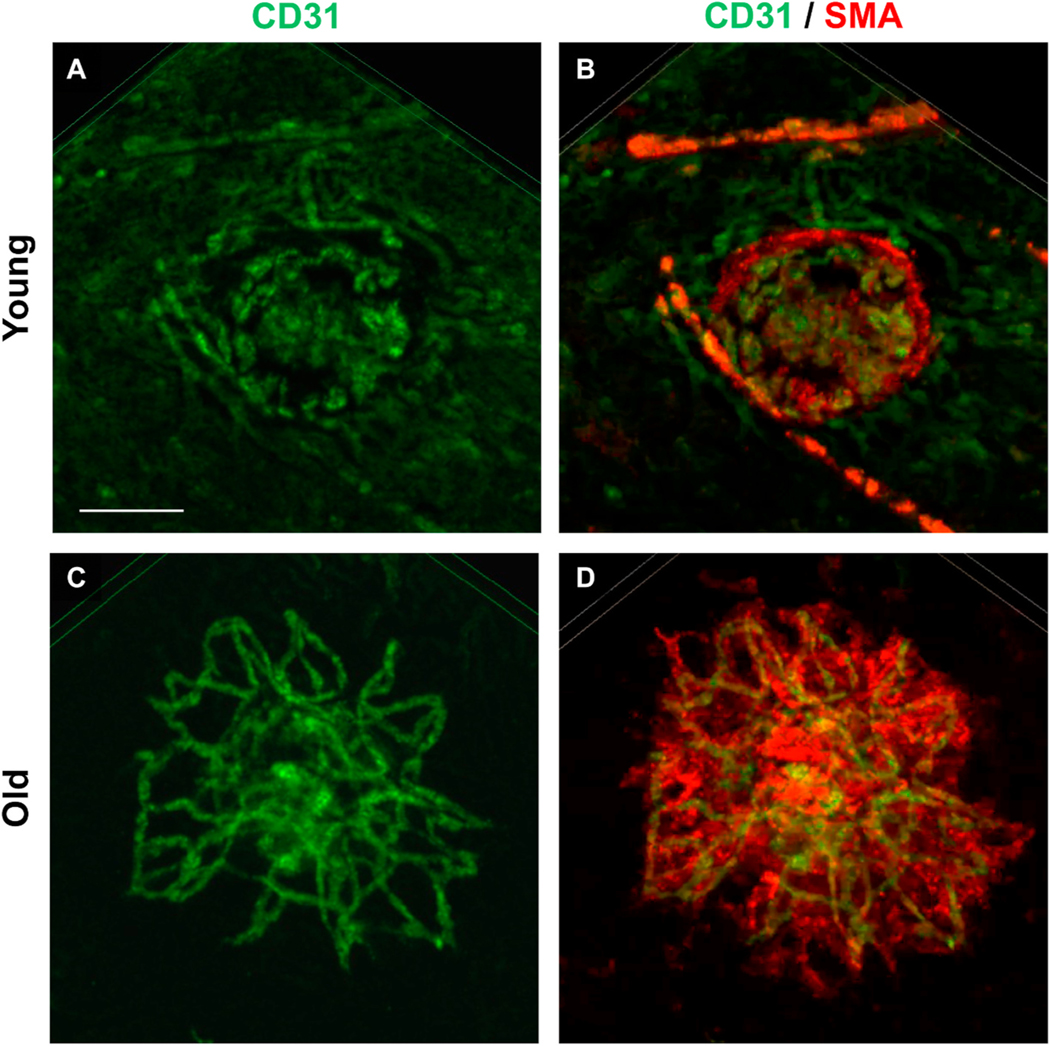
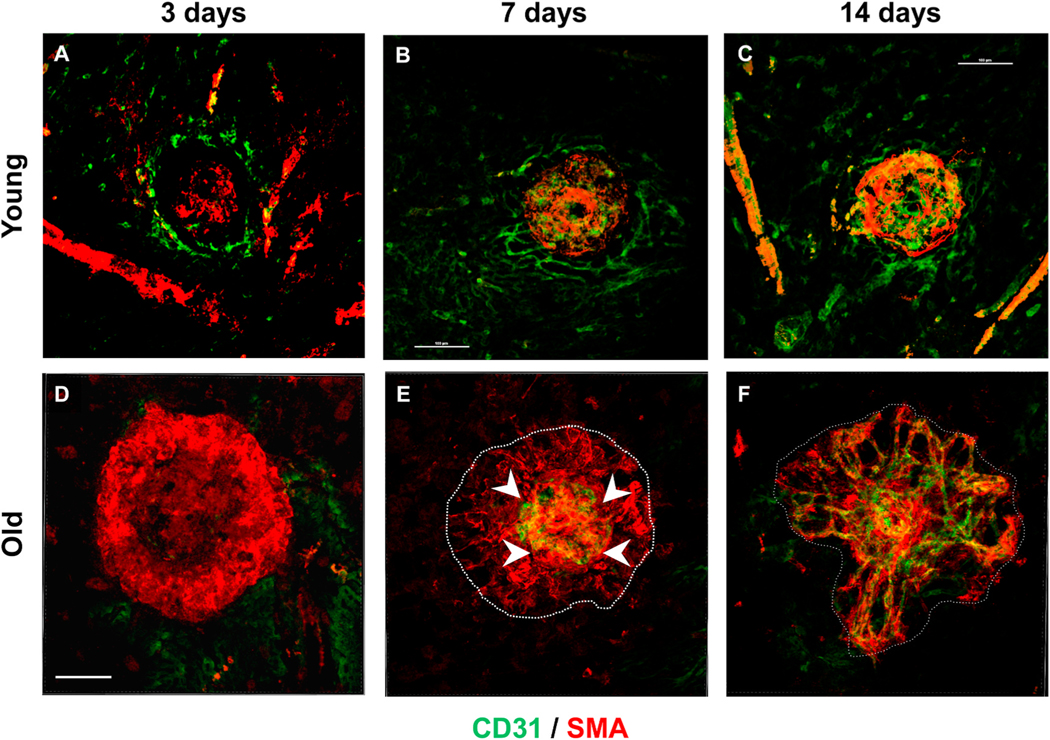
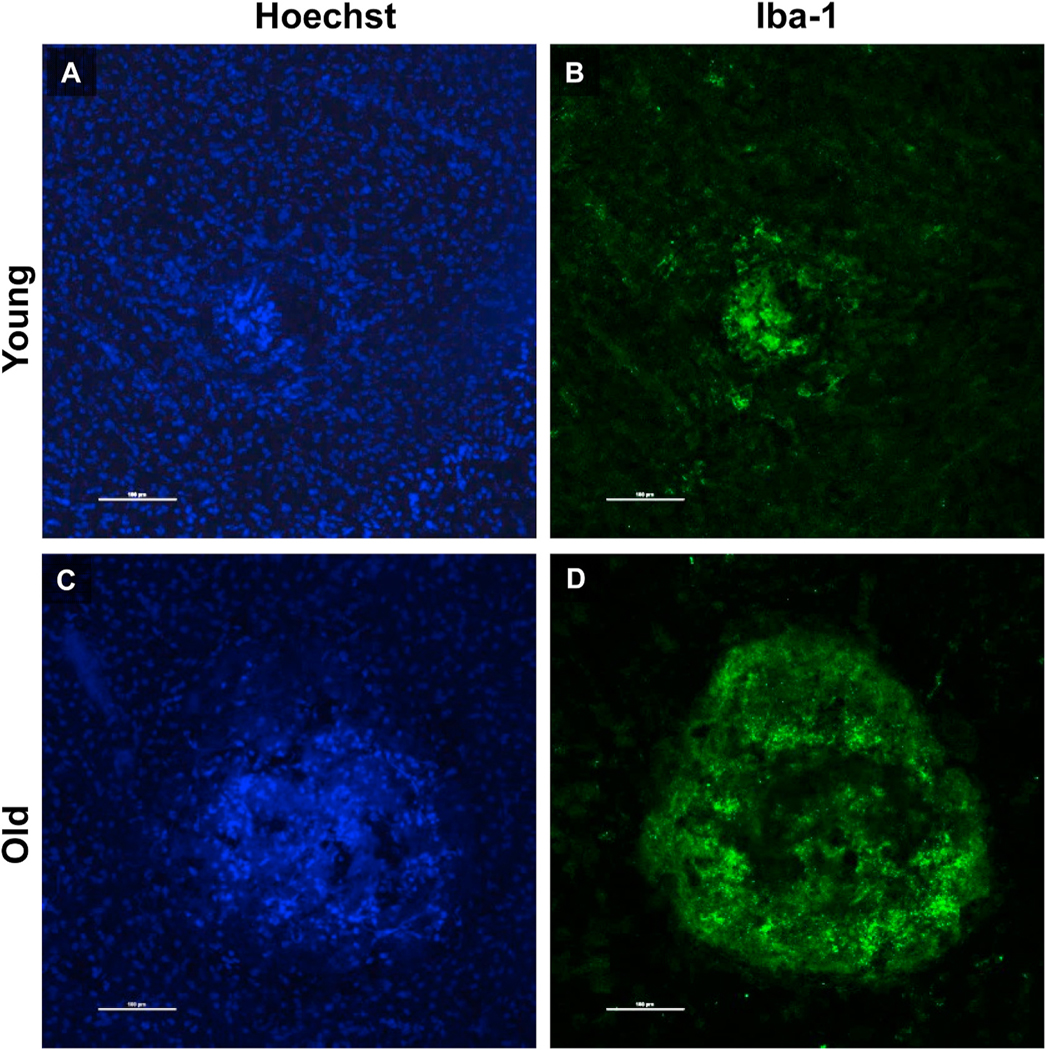
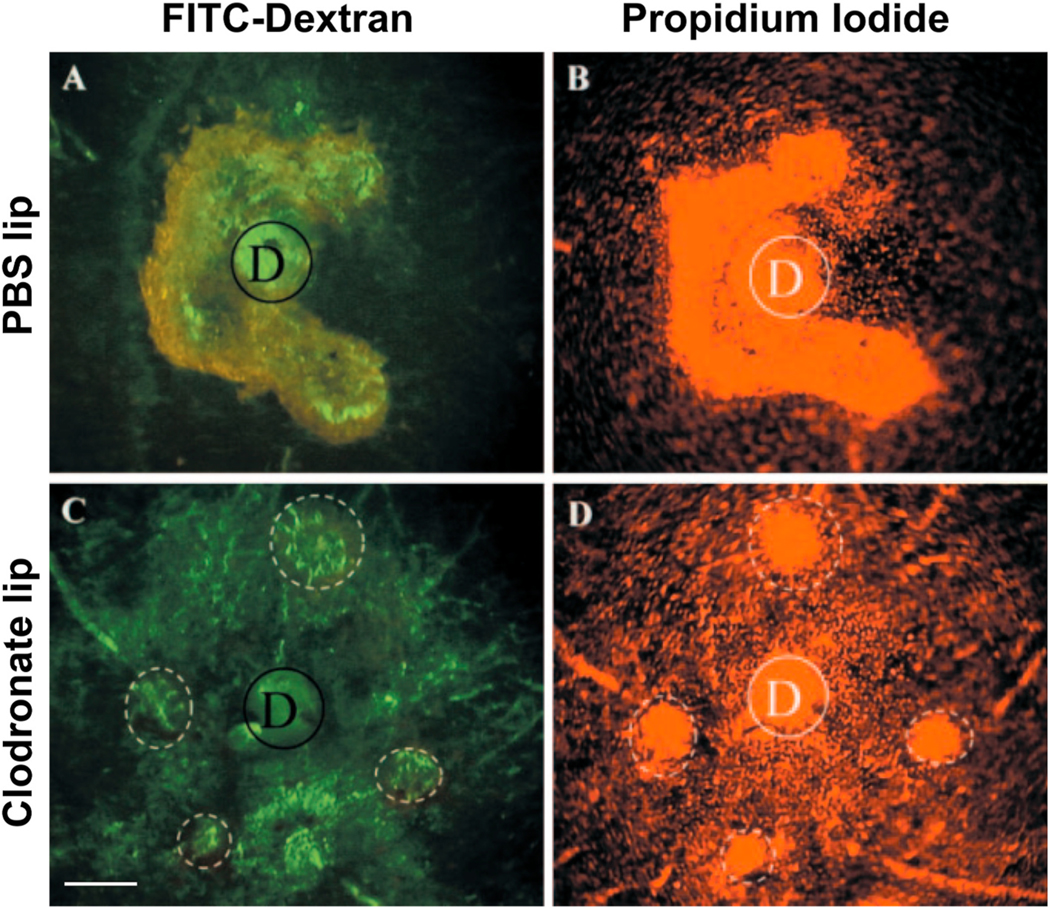
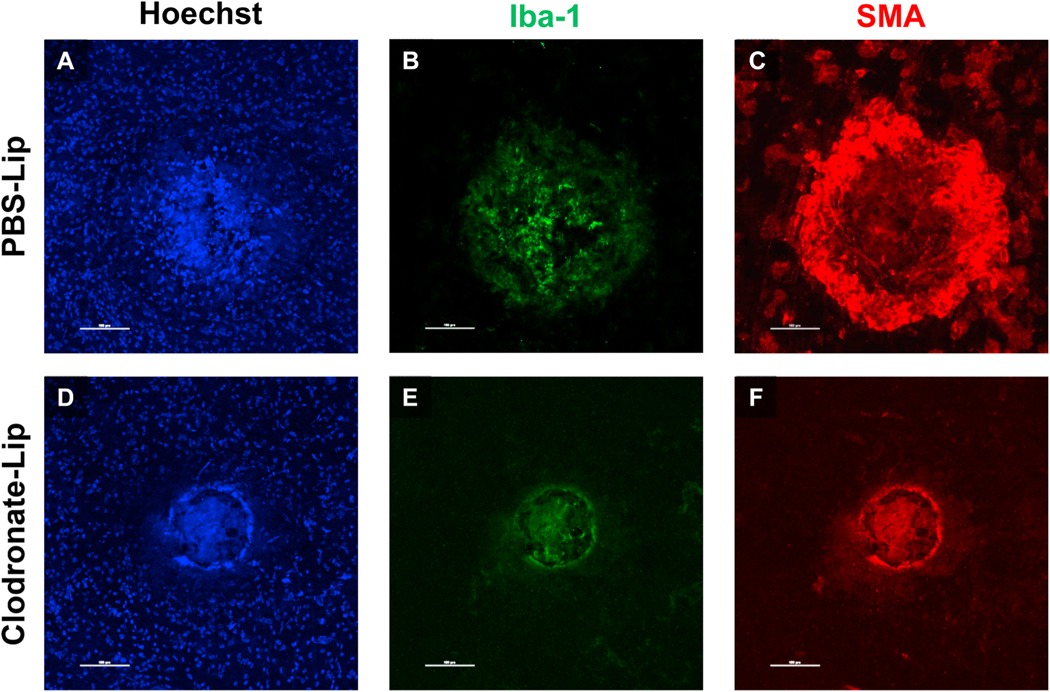
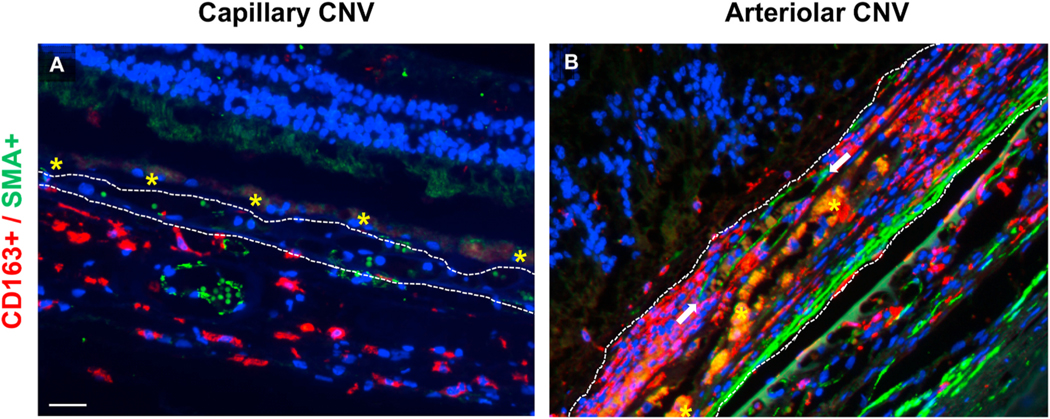
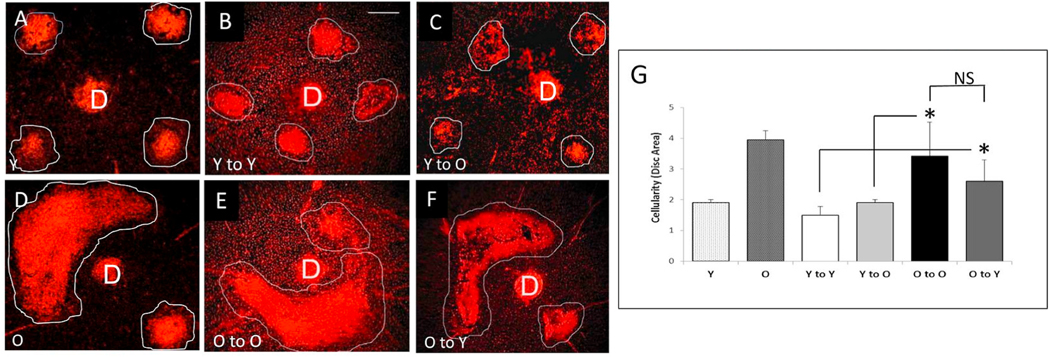
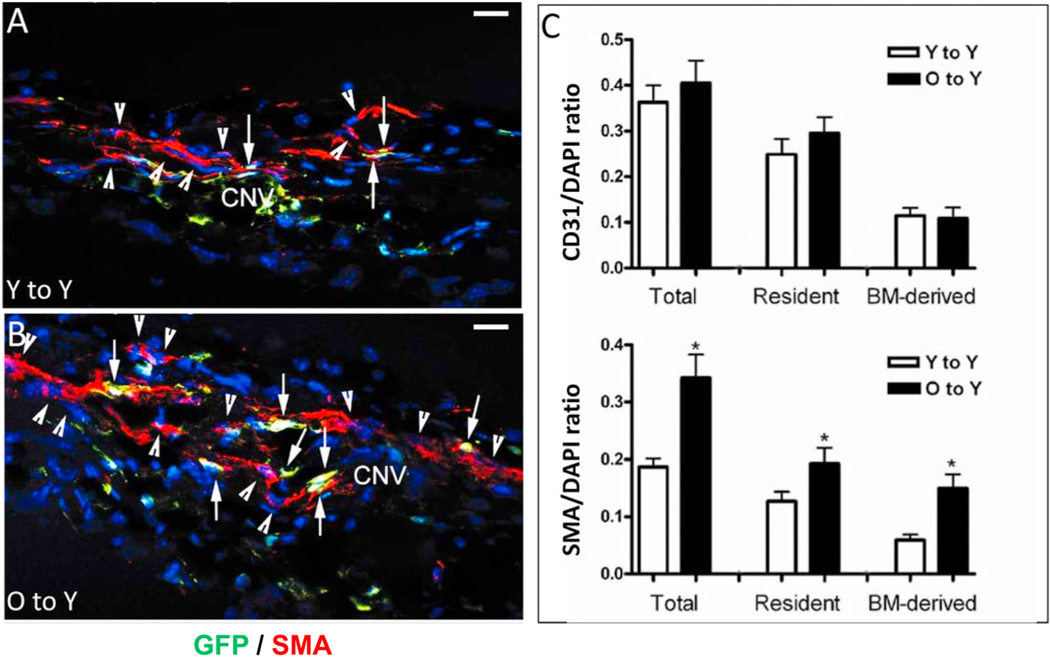
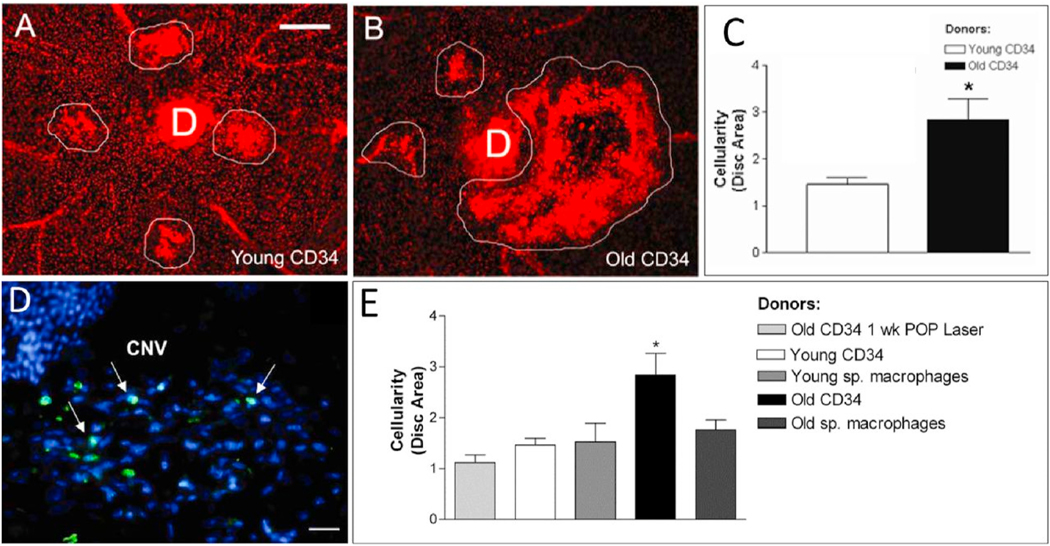
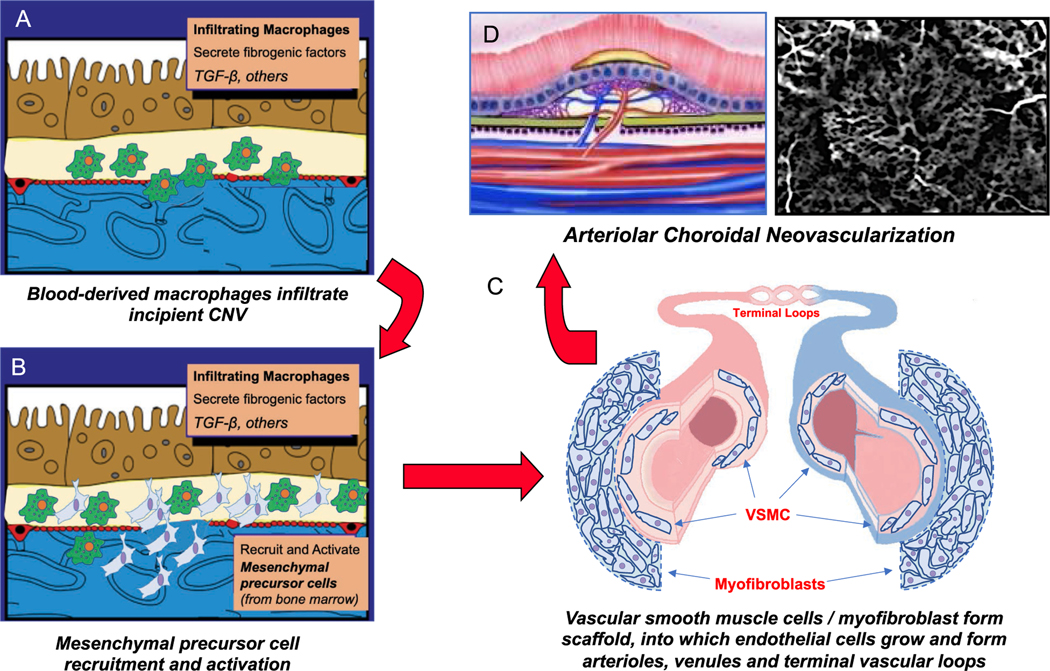
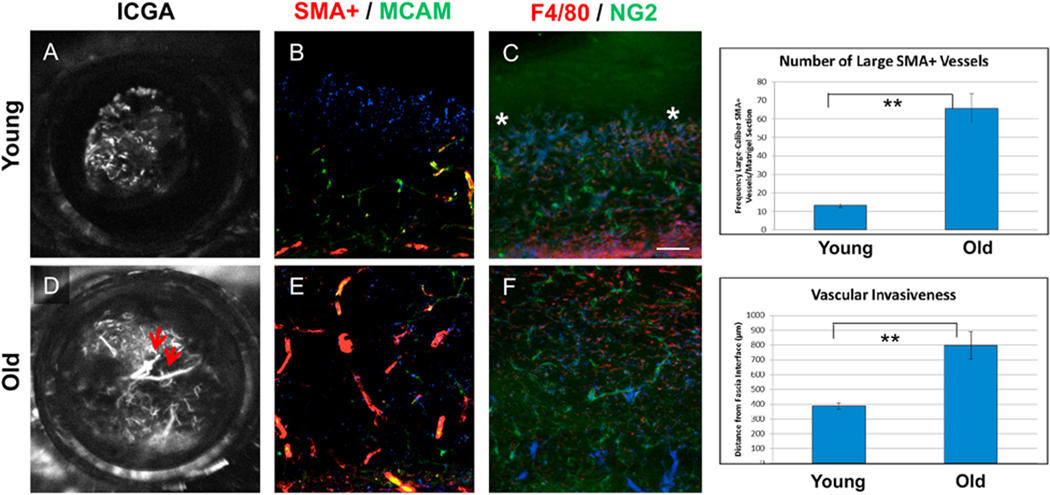
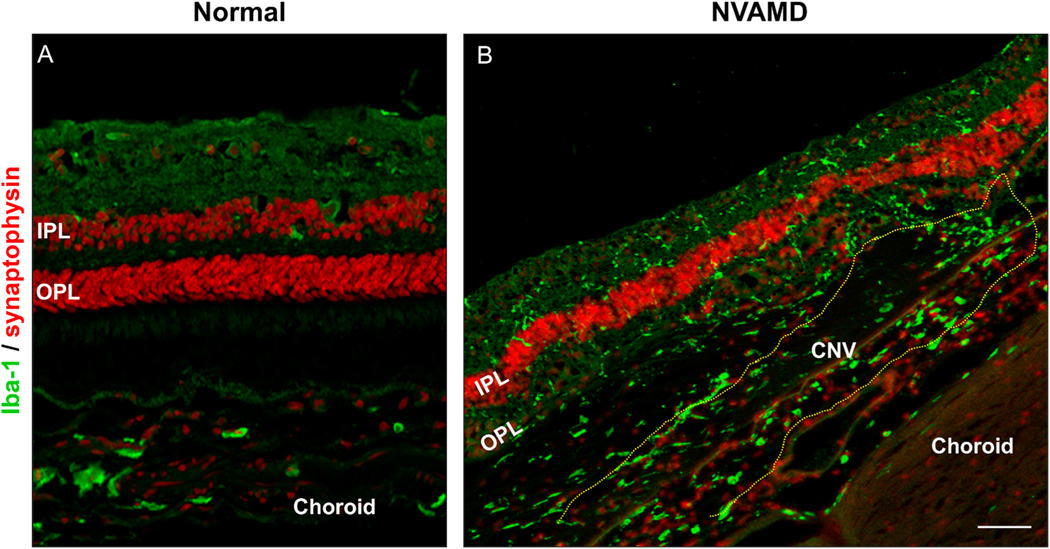
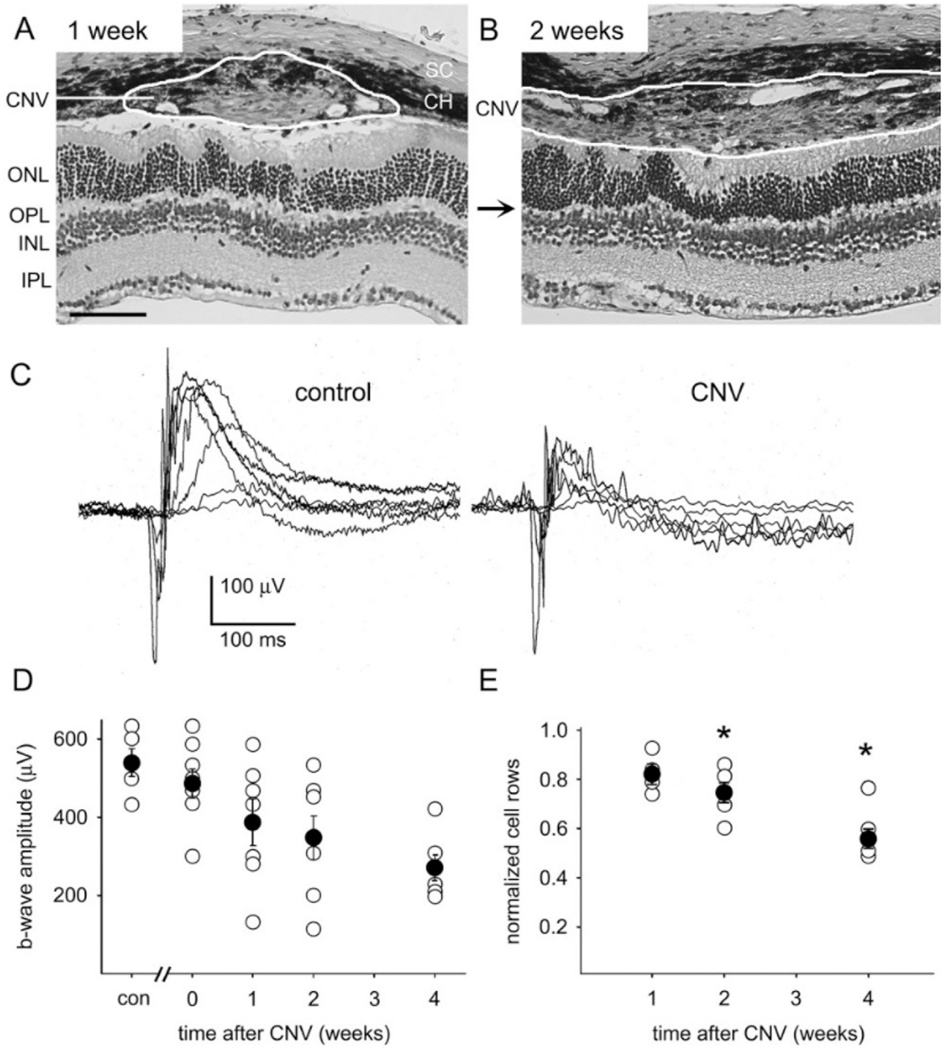
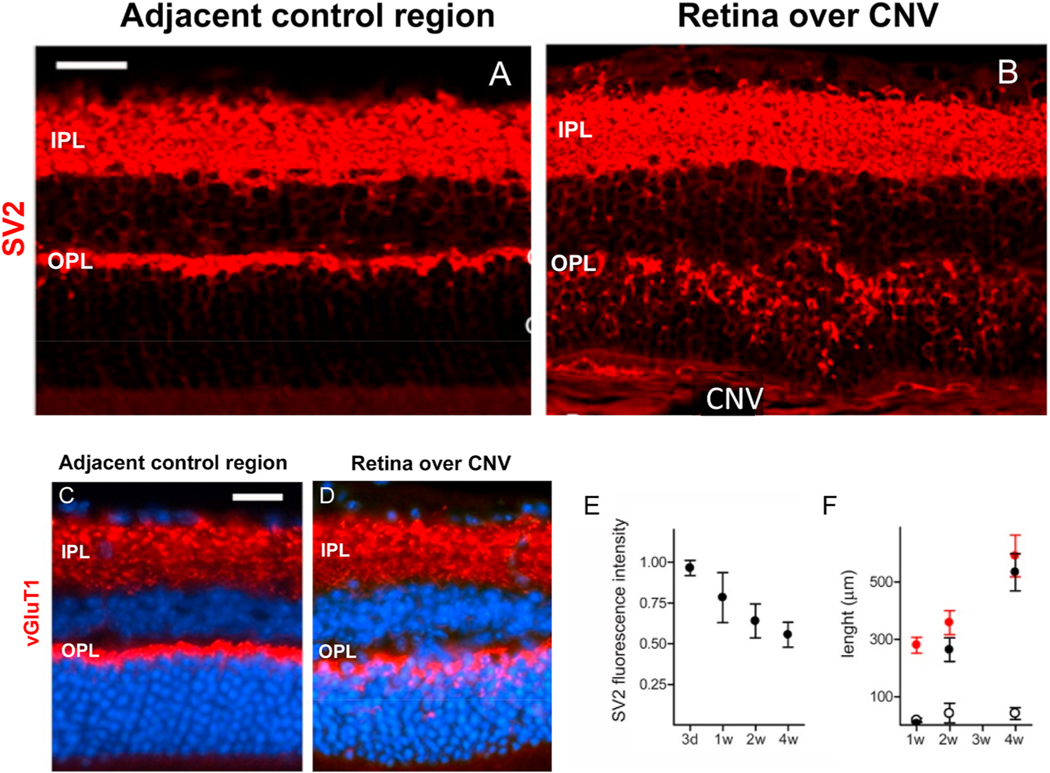
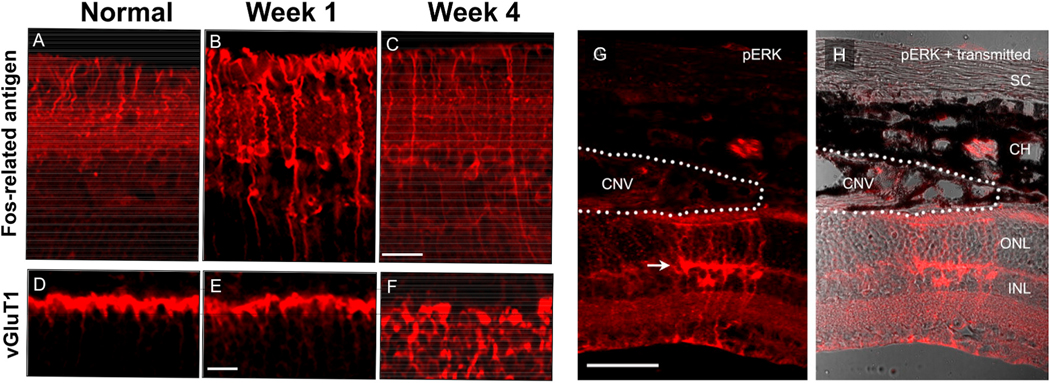
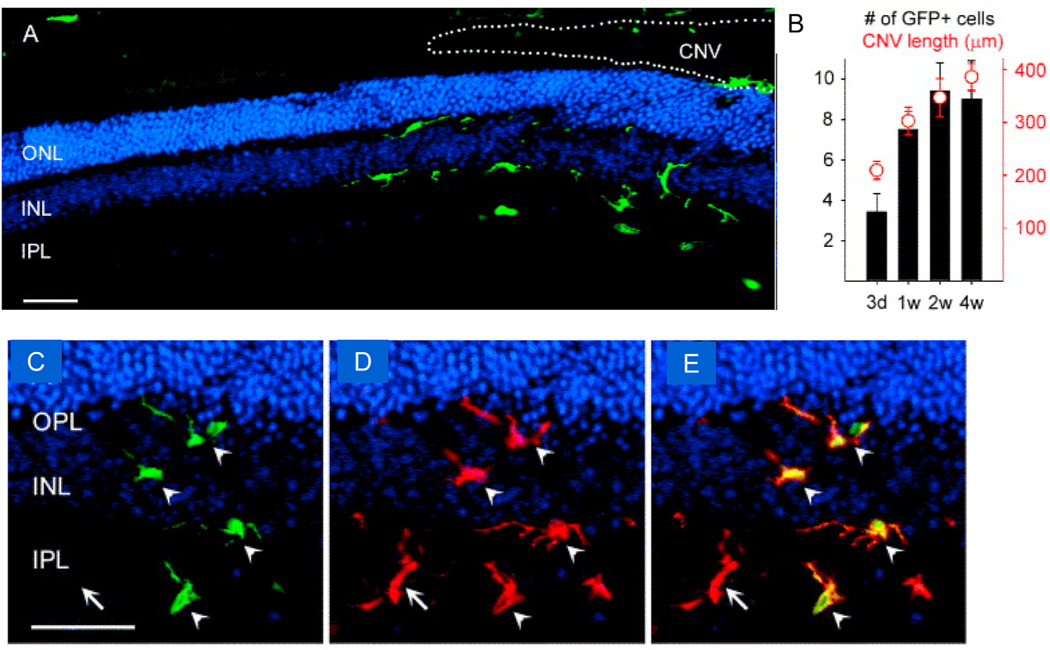
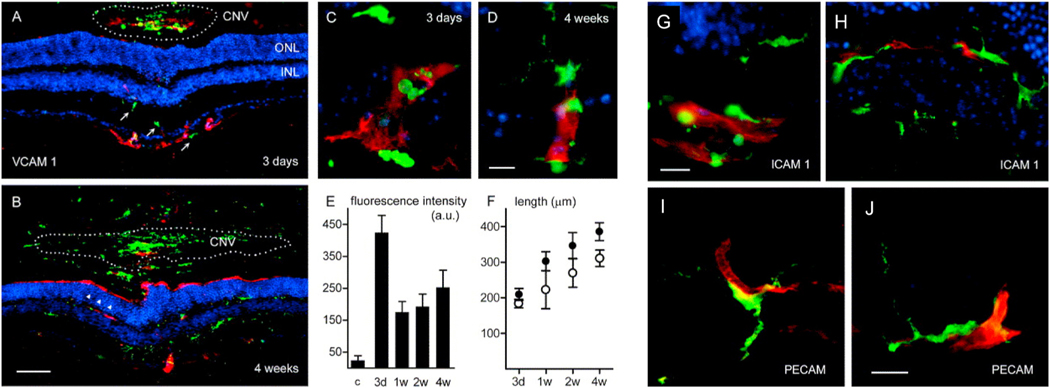
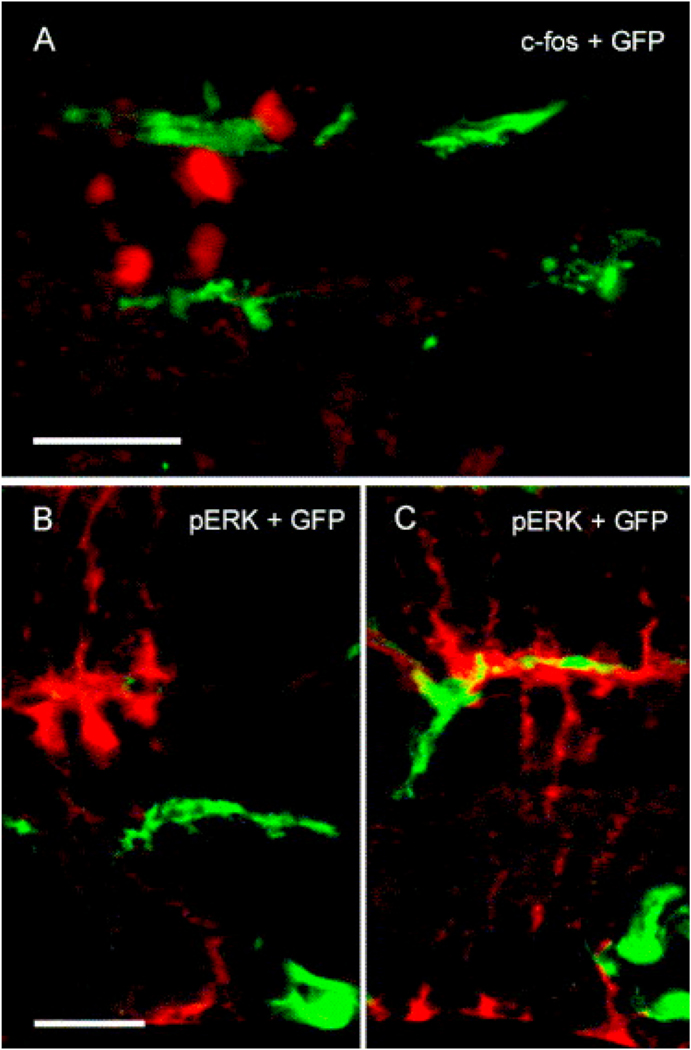
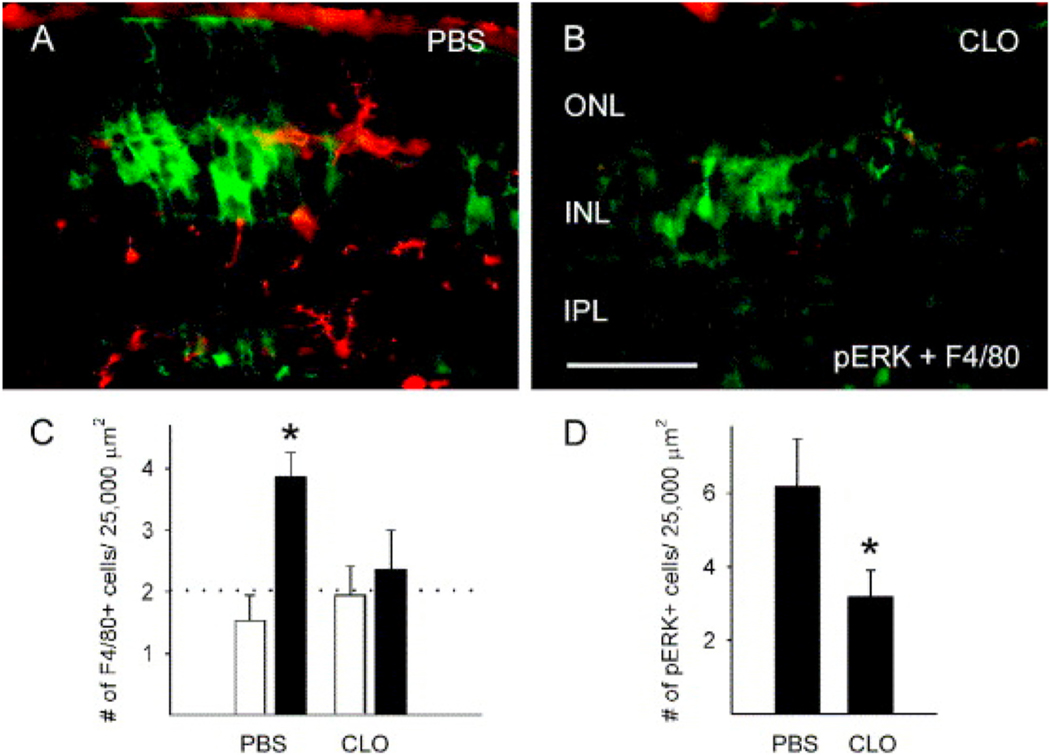
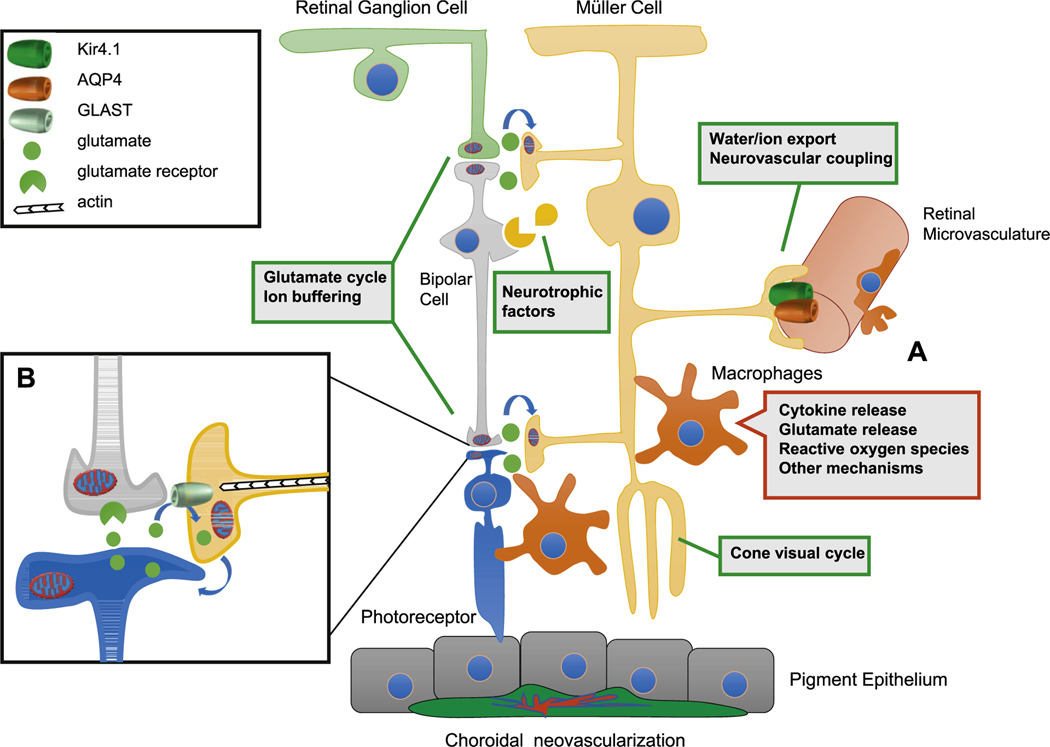
Intravitreal anti-vascular endothelial growth factor (VEGF) drugs have revolutionized the treatment of neovascular age-related macular degeneration (NVAMD). However, many patients suffer from incomplete response to anti-VEGF therapy (IRT), which is defined as (1) persistent (plasma) fluid exudation; (2) unresolved or new hemorrhage; (3) progressive lesion fibrosis; and/or (4) suboptimal vision recovery. The first three of these collectively comprise the problem of persistent disease activity (PDA) in spite of anti-VEGF therapy. Meanwhile, the problem of suboptimal vision recovery (SVR) is defined as a failure to achieve excellent functional visual acuity of 20/40 or better in spite of sufficient anti-VEGF treatment. Thus, incomplete response to anti-VEGF therapy, and specifically PDA and SVR, represent significant clinical unmet needs. In this review, we will explore PDA and SVR in NVAMD, characterizing the clinical manifestations and exploring the pathobiology of each. We will demonstrate that PDA occurs most frequently in NVAMD patients who develop high-flow CNV lesions with arteriolarization, in contrast to patients with capillary CNV who are highly responsive to anti-VEGF therapy. We will review investigations of experimental CNV and demonstrate that both types of CNV can be modeled in mice. We will present and consider a provocative hypothesis: formation of arteriolar CNV occurs via a distinct pathobiology, termed neovascular remodeling (NVR), wherein blood-derived macrophages infiltrate the incipient CNV lesion, recruit bone marrow-derived mesenchymal precursor cells (MPCs) from the circulation, and activate MPCs to become vascular smooth muscle cells (VSMCs) and myofibroblasts, driving the development of high-flow CNV with arteriolarization and perivascular fibrosis. In considering SVR, we will discuss the concept that limited or poor vision in spite of anti-VEGF may not be caused simply by photoreceptor degeneration but instead may be associated with photoreceptor synaptic dysfunction in the neurosensory retina overlying CNV, triggered by infiltrating blood-derived macrophages and mediated by Müller cell activation Finally, for each of PDA and SVR, we will discuss current approaches to disease management and treatment and consider novel avenues for potential future therapies.

Keywords: Anti-VEGF; Anti-VEGF resistance; Choroidal neovascularization; Macrophage; Mesenchymal precursor cell; Monocyte; Müller cell; Neovascular age-related macular degeneration; Neovascular remodeling; Persistent disease activity; Photoreceptor synaptic dysfunction; Suboptimal vision recovery.


Figures

Fig. 1.
Fig. 1.
Manifestations of persistent disease activity (PDA) after a period of sustained treatment with intravitreal anti-VEGF (vascular endothelial growth factor) medicines (i.e., after initial loading dose, 6 months, 1 year, etc.). (D) Demonstrates an example by optical coherence tomography (OCT) of worsening subretinal fluid, new focus of intraretinal fluid, and enlarging shallow spongiform pigment epithelial detachment (PED), post-anti-VEGF therapy, as compared to baseline (A). (E) Demonstrates an example by fluorescein angiography (FA) of macular neovascularization (MNV) enlargement and growth and persistent leakage, post-anti-VEGF therapy, as compared to baseline (B). (F) Demonstrates an example by color fundus photography of persistent hemorrhage and progressive fibrosis extending into the fovea, post-anti-VEGF therapy, as compared to baseline (C).
Fig. 2.
Fig. 2.
Morphologic subtypes of NVAMD, as visualized by indocyanine green angiography (ICGA). (A) Arteriolar pattern (extent of neovascularization outlined by orange dashes) is characterized by high flow through large-caliber feeder artery (red arrow), which gives rise to many branching arterioles and terminal vascular anastomotic loops (yellow arrow) but minimal capillary components. (B) Capillary pattern is evident as a relatively slow filling, discrete homogenous focus of microvessels. (C) Mixed-Capillary is characterized by presence of feeder artery (red arrow), capillary rim (yellow arrows) and draining venule (green arrow), sharing features from both Arteriolar and Capillary Patterns. (D) Polypoidal choroidal vasculopathy (PCV) subtype of macular neovascularization (MNV) is comprised of aneurysmal, vascular dilatations (yellow arrows), frequently in association with a high-flow, variably organized branching vascular network of arterioles and draining venules. (E) Type 3 MNV, or retinal angiomatous proliferation (RAP), is characterized by intraretinal neovascularization originating from the retinal circulation. (F) Choroidal leak syndrome (CLS), or pachychoroid spectrum of NVAMD, is apparent as choroidal neovascular remodeling (red arrows), irregular and frequently transient hot spots (yellow arrows), and late choroidal hyperpermeability (outlined by orange dashes), in association with variable sub-RPE thickening and subretinal fluid by OCT and coarse pigment mottling of the macula by clinical examination.
Fig. 3.
Fig. 3.
Example of Treatment Response in Capillary Pattern CNV. At baseline, (A) fluorescein angiography (FA) demonstrates a Type 2 MNV pattern and (B) indocyanine green angiography (ICGA) demonstrates Capillary Pattern morphology (red arrows). Post treatment with a single anti-VEGF, (C) FA shows clearance of the Type 2 MNV and (D) ICGA shows regression of the capillary microvascular structure (red arrows).
Fig. 4.
Fig. 4.
Example of Treatment Response in Mixed Capillary-Arteriolar CNV. At baseline, (A) fluorescein angiography (FA) demonstrates a Type 2 MNV pattern, (B) indocyanine green angiography (ICGA) demonstrates Mixed Capillary-Arteriolar CNV, with a feeder artery (red arrowhead) giving rise to a capillary rim, and (C) optical coherence tomography (OCT) demonstrates a mixed serous and fibrovascular pigment epithelial detachment (PED) and subretinal fluid (SRF). Post-loading dose with three anti-VEGF treatments, (D) FA shows resolution of leakage from the Type 2 MNV, (E) ICGA shows regression of the capillary rim with persistence of the feeder vascular structure (red arrowhead), and (F) OCT demonstrates reduction in PED and clearance of SRF.
Fig. 5.
Fig. 5.
Example of Treatment Response in Arteriolar Pattern CNV. At baseline, (A) clinical exam and (B) fluorescein angiography (FA) demonstrates evidence of serous pigment epithelial detachment, (C) indocyanine green angiography (ICGA) demonstrates an Arteriolar predominant lesion, with feeder artery (red arrowhead), arteriole (orange arrow), ill-defined marginal rim of vessels (yellow-dotted region, probable capillaries), and draining vein (green arrowhead). Post-loading dose with three anti-VEGF treatments, (D) there is large submacular hemorrhage in the macula by clinical exam, (E) FA demonstrates blockage of fluorescence from the hemorrhage but increased marginal hyperfluorescence indicative of MNV lesion growth, and (F) ICGA demonstrates growth of the CNV lesion, with increased vessel caliber of choroidal feeder artery (red arrowhead), growth of new branching arterioles (orange arrow),extension of arterioles with vascular loops without visible capillaries into the macula (yellow-dotted region), and draining venule (green arrowhead).
Fig. 6.
Fig. 6.
Vascular morphology in experimental CNV lesions by fluorescein angiography and lectin-stained flatmount. Early (~1 min) and late (~4 min) FA photographs were obtained to characterize lesion size and leakage activity of experimental CNV. Lectin-stained vascular flatmounts were obtained to characterize differences in vascular morphology (magnification: × 100; scale bar: 100 μm). Young mice demonstrated small lesions, well-demarcated borders, and mild fluorescein leakage (A, B). Lectin-stained flatmount analysis of one of these lesions (corresponding to red box [B]) demonstrated well-defined, small-diameter capillary networks with minimal discernible large-caliber arterioles (C). FA from old mice demonstrated large, confluent CNV with very active fluorescein leakage (D, E). Lectin-stained flatmount from one of these CNV lesions (corresponding to red box [E]) revealed many large branching arterioles (arrow) and vascular loops at the lesion margins (arrowhead) (F).
Fig. 7.
Fig. 7.
Masson Trichrome demonstrating extracellular matrix deposition in experimental murine laser-induced CNV. As compared to young mice (A), old mice (B) demonstrated thicker CNV lesions with more extensive extracellular matrix deposition, indicative of increased perivascular fibrosis.
Fig. 8.
Fig. 8.
Vascular morphology and cellular composition in experimental CNV lesions by confocal microscopy of flatmounts stained for CD31 (green) endothelial cells and smooth muscle actin (SMA) (red) vascular smooth muscle cells and myofibroblasts. Scale bar: 100 μm. Young mice demonstrate CNV lesions with (A) CD31+ endothelial cells within a well-demarcated but ill-defined network of microvessels; (B) there is minimal staining with SMA+ within the microvascular structure, reflecting the predominance of pericytes as mural cells and rarity of VSMCs and associated myofibroblasts, features that are all consistent with Capillary morphology. Old mice demonstrate CNV lesions (C) with an extensive network of CD31+ branching large-caliber vascular structures, with terminal loops at the lesion margin interconnecting the branching vessels. (D) Double- staining for SMA + perivascular mural cells reveals the presence of extensive SMA + perivascular cells, including SMA + VSMCs that directly invest and envelop the arteriolar vascular structures as well as SMA + cells within the lesion interstitium, myofibroblasts, which are responsible for deposition of perivascular extracellular matrix deposition (fibrosis).
Fig. 9.
Fig. 9.
Time course for dynamic changes in cellular composition and morphology in developing experimental CNV lesions, by confocal microscopy of flatmounts stained for CD31 (green) endothelial cells and smooth muscle actin (SMA) (red) vascular smooth muscle cells and myofibroblasts. Scale bar: 100 μm. At 3 days post-laser induction, (A) nascent lesions in young mice demonstrate an initial migrating wave of CD31+ endothelial cells at the outer margin of the lesion, with a weakly positive focus of SMA + cells at the site of laser injury. By day 7, (B) formation of CD31+ microvascular structures are evident in CNV lesions of young mice, with patterning of SMA + cells within the interstitium of the capillary lesion. By day 14, (C) formation of capillary CNV lesion is complete, with formation of a complete microvascular network. At 3 days post-laser induction in old mice (D), nascent lesions demonstrate a prominent initial “wreath” of SMA + cells encircling well beyond the margins of the site of laser injury, with none to minimal CD31+ endothelial cells present. By day 7, (E) the SMA + cells have begun to pattern into a scaffold of tunnel-like structures (dotted white line), and CD31+ endothelial cells have begun to grow at the center of the lesion, with a leading edge of growth (arrowheads) outwards into the SMA + scaffold tunnels. By 14 days, (F) CD31+ endothelial cells have completed growth out to the full margin of the lesion, forming branching arterioles and anastomotic loops at the rim of the arteriolarized CNV lesion..
Fig. 10.
Fig. 10.
Macrophage CNV infiltration by confocal microscopy of flatmounts stained for Iba-1 (green) macrophages with Hoechst nuclear staining. Scale bar: 100 μm. As compared to CNV lesions of young mice (A) and (B), old mice, (C) and (D) demonstrate more extensive macrophage infiltration within CNV lesions.
Fig. 11.
Fig. 11.
Effects of systemic monocyte depletion on experimental CNV in old mice, by flatmounts (FITC-dextran for vascularity, and propidium iodide for cellularity) of experimental CNV lesions in aged mice treated with either PBS liposomes (PBS lip) (controls) or clodronate liposomes (Clodronate lip) at 2 weeks post induction, D = optic disc. Scale bar: 100 μm. (C) and (D) Depletion of circulating monocytes by systemic administration of clodronate liposomes prevents the development of large arteriolar CNV lesions; clodronate-treated mice instead develop smaller capillary CNV lesions. (A) and (B) Control-PBS lip treated mice demonstrate large CNV lesions characteristic of arteriolar CNV in old mice (which, in this example, are confluent due to extensive lesion growth).
Fig. 12.
Fig. 12.
Effects of systemic monocyte depletion on experimental CNV development at day 3 following CNV induction in old mice. Scale bar: 100 μm. Control-PBS lip treated mice (A–C) demonstrate the (C) expected formation of a prominent initial “wreath” of SMA + cells, in association (B) with early lesional Iba-1 macrophage infiltration. Depletion of circulating monocytes by systemic administration of clodronate liposomes (D–F) completely abrogates the formation of the wreath of SMA + cells (F) at day 3, in association with a complete suppression of lesional macrophage infiltration (E).
Fig. 13.
Fig. 13.
Reparative macrophage infiltration in postmortem CNV specimens from patients with NVAMD. Dashed white lines delimit CNV, yellow stars indicate RPE (which is autofluorescent in (B)). Scale bar: 100 μm. Capillary CNV (A) have minimal SMA+ (green) staining and minimal CD163+ (red) reparative macrophage infiltration, and CNV lesion remains entirely in sub-RPE space within Bruch’s membrane. In contrast, arteriolar CNV is substantially thicker, extends into subretinal space, with presence of large-caliber SMA+ (green) vessel (arrows on either side, seen in cross-section), and extensive CD163+ (red) macrophage infiltration within the CNV lesion.
Fig. 14.
Fig. 14.
Mice with latent MCMV infection develop more severe arteriolar CNV. Groups of adult 7–8 month old C57BL/6 mice were inoculated intraperitoneally with either MCMV or UV-inactivated virus. At 6 days, 6 weeks, or 12 weeks after inoculation, all mice were subjected to laser treatment to induce CNV, and, four weeks later, flatmount preparations of the posterior pole of mouse eyes were stained with propidium iodide. Flatmount preparations of representative individual mouse eyes showing areas of CNV (white outlines). (D = Optic Disc) (Magnification = 50 ×) (Scale bar = 100 μm)) (A) Mouse inoculated with UV-inactivated MCMV (control) for 12 weeks prior to laser treatment. (B) Mouse infected with MCMV for 6 days prior to laser treatment. (C) Mouse infected with MCMV for 6 weeks prior to laser treatment. (D) Mouse infected with MCMV for 12 weeks prior to laser treatment.
Fig. 15.
Fig. 15.
Mice exposed to low level of lipopolysaccharide (LPS, 10 μg) by intraperitoneal injection prior to laser induction develop more severe arteriolar CNV. LPS-stimulated mice (7–9 month old) demonstrate (A) prominent leakage by fluorescein angiogram (FA), (B) large-caliber arterioles (arrows) with vascular loops (arrowheads) by TRITC-lectin flatmount, and (C) increased density of SMA + arterioles by cross-sectional immunofluorescence. In contrast, PBS control-exposed mice have (D) small lesions with mild leakage by FA, (E) capillary morphology by flatmount; and (F) few SMA + vessels. Larger size was confirmed by (G) quantitative analysis of flatmounts (**p < 0.05).
Fig. 16.
Fig. 16.
Development of Arteriolar CNV in LPS-stimulated mice is associated with increased frequency of nonclassical monocytes. The composition of blood monocyte populations was assessed at day 3 following laser induction, the time period when neovascular remodeling biology is believed to occur. Whereas PBS-exposed mice with capillary lesions had an average ratio of 11% nonclassical Ly6Clo to 89% classical Ly6Chi blood monocytes, LPS-exposed mice had a ratio of 36% nonclassical Ly6Clo to 64% classical Ly6Chi blood monocytes (p < 0.01). Further, LPS exposure produced a major change in absolute number of Ly6Clo blood monocytes: LPS-exposed mice - 4978 cells/μL of blood versus PBS-exposed mice - 727 cells/μL (p < 0.01).
Fig. 17.
Fig. 17.
Bone marrow transplant confers susceptibility to neovascular remodeling in experimental CNV. Small capillary lesions developed in young unmanipulated mice (A) and also when young BM was transplanted into either young ([B], Y-to-Y) or old mice ([C], Y-to-O). In contrast, old unmanipulated mice (D) and the old-to-old group (E) developed large neovascular lesions that grew to confluence due to extensive growth between adjacent lesions. Additionally, young recipients receiving old BM ([F], O-to-Y) developed intermediate-size lesions, frequently with confluent growth. (G) Quantitative analysis of the surface area of CNV lesions in each group. Significant differences were observed (asterisks) when old BM was transplanted in both young and old recipients in comparison with transplantation of young BM (t-test: P < 0.001). D, optic disc. White line encircles CNV lesions. Magnification: × 50; scale bar: 200 μm.
Fig. 18.
Fig. 18.
Immunofluorescence detection of resident or recruited BM-derived SMA-expressing perivascular mesenchymal cells in CNV lesions after bone marrow transplant (BMT). Young mice received young (A) or old (B) GFP BM, followed by laser-induced CNV. Although both groups demonstrated resident SMA-expressing cells (red, arrowheads) and GFP-labeled BM-derived cells, many more double-positive cells (yellow, arrows), representing BM-derived SMA/GFP-expressing cells, were observed in cross sections from mice receiving old marrow. Quantification of the frequency of total, resident, and BM-derived CD31 endothelial cells ([C], top) showed no difference in resident or BM-derived CD31-expressing endothelial cells between mice receiving young or old marrow. In contrast, significant differences (asterisks) were observed in the frequency of both resident and BM-derived SMA-expressing cells in CNV of mice receiving marrow from young versus old donors ([C], bottom). In particular, mice receiving old marrow had a 2.5-fold increase in marrow-derived SMA-expressing perivascular mesenchymal cells, contributing to nearly half of all SMA-expressing cells in the CNV. SMA, red; GFP, green; colocalization of GFP and SMA, yellow; DAPI, blue. Magnification: × 400; scale bars: 20 μm.
Fig. 19.
Fig. 19.
Analysis of CNV lesions in young animals receiving adoptive transfer of CD34+-GFP-labeled cells. CD34+ precursor cells obtained from young or old donors were adoptively transferred to young recipient mice at the time of laser-induced CNV (without prior irradiation or BMT). (A) Mice receiving adoptive transfer of CD34+ cells isolated from a young donor display typical small CNVs. (B) In contrast, animals receiving adoptive transfer of CD34+ cells from old donors developed arteriolar CNVs, larger in size. D, optic disc; white lines encircle CNV lesions. Magnification: × 50; scale bar: 200 μm. (C) Quantitative analysis of surface area showed a significant size increase (asterisk) in animals engrafted with CD34+ cells from old donors as compared with young donors. (D) Immunohistochemistry of mouse eye cross sections with CNV lesion showed recruitment and engraftment of adoptively transferred GFP + cells (arrows) within 3 days after CNV induction. GFP, green; DAPI, blue. Magnification: × 400; scale bar: 20 μm. (E) Quantitative analysis of cellular density after adoptive transfer of young or old CD34+ cells versus young or old macrophages (F4/80). Mice receiving old CD34+ cells developed CNV lesions that are approximately double in size (asterisk) when compared to those in the other groups. Adoptive transfer of young or old F4/80+ splenic macrophages failed to induce any increase in severity, similarly to adoptive transfer of CD34+ cells from old marrow transferred 7 days after CNV induction.
Fig. 20.
Fig. 20.
Integrated hypothesis for neovascular remodeling. (A) Circulating monocytes infiltrate the site of incipient choroidal neovascularization (CNV) at Bruch’s membrane/sub-RPE space, where they transform into macrophages. (B) Activated macrophages secrete fibrogenic factors that recruit and activate bone-marrow derived mesenchymal precursor cells from the circulation via the choroid. (C) MPCs differentiate into vascular smooth muscle cells and myofibroblasts, which establish the template for the phenotype of neovessel growth early in CNV development by forming a perivascular mesenchymal scaffold, into which endothelial cells grow to form arterioles, venules, and terminal vascular loops. (D) Growth is complete as an Arteriolar CNV.
Fig. 21.
Fig. 21.
Matrigel chamber assay for neovascularization. Hollow silicone chamber affixed to a coverslip is filled with an extracellular matrix substrate, growth-factor depleted Matrigel. The Matrigel chamber was then implanted into the subcutaneous perineum, with the Matrigel substrate in direct contact with mechanically injured peritoneal tissue. The skin was then secured over the implant. At 14 days, the Matrigel implant was exposed and the protective coverslip was removed, to allow imaging of vessel growth by in vivo angiography. Implants were then harvested for histology and immunofluorescence (SMA labeling VSMC and myofibroblasts; MCAM labeling endothelial cells; F4/80 labeling macrophages; NG2 labeling pericytes). Scale bar: 100 μm Old mice demonstrated (D) high-flow, arteriolarized vessels (red arrows), with (E) significantly higher frequency of large-caliber SMA + -vessels, (F) increased macrophage infiltration, with and increased vascular invasiveness into the implant, as compared to young mice (A–C), stars in C indicating leading edge of vessel growth. **p < 0.05.
Fig. 22.
Fig. 22.
Case example of patient with NVAMD and persistent disease activity undergoing verteporfin photodynamic therapy. 79 year old white female had (A) persistent cystic intraretinal fluid and subretinal fluid by OCT in spite of eight monthly anti-VEGF treatments; (B) indocyanine green angiography (ICGA) demonstrates an Arteriolar CNV with branching arterioles radiating from center feeder artery (outlined with red dashes). Following PDT targeted to the central feeder artery, there is (C) resolution of intraretinal fluid and subretinal fluid by OCT as well as (D) vas-occlusion of the Arteriolar CNV.
Fig. 23.
Fig. 23.
Experimental CNV in CaMKK2 −/− mice exposed to low level of lipopolysaccharide (LPS, 10 μg) by intraperitoneal injection prior to laser induction followed by preparation of TRITC-lectin flatmounts at 14 days post-induction. Scale bar: 100 μm, D = optic disc. (A) Wild-type control mice demonstrate CNV large-caliber vessels with vascular loops, whiles (B) CaMKK2 −/− demonstrates smaller lesions that appear to have capillary morphology. Quantitative analysis of flatmount surface area confirms reduced lesion size for CaMKK2 −/− mice (**p < 0.05).
Fig. 24.
Fig. 24.
Histology of neurosensory retina overlying CNV in postmortem specimen from patient with NVAMD. Scale bar: 100 μm. (A) Normal control demonstrates normal pattern of synaptophysin (red) staining at the outer plexiform layer (OPL) and inner plexiform layer (IPL), and presence of occasional Iba-1+ (green) macrophages in the choroid but only minimal Iba-1+ cells in the retina (which likely label either tissue-resident perivascular macrophages or microglia). (B) NVAMD lesion demonstrates loss of normal synaptophysin staining at the OPL but generally preserved staining at the IPL, in association with extensive infiltration of Iba-1 macrophages not only in the CNV lesion but also in the overlying neurosensory retina.
Fig. 25.
Fig. 25.
Choroidal neovascularization-induced changes in retinal morphology and physiology. A,B: Vertical sections of the eye with choroidal neovascularization (CNV) at 1 week (A) and 2 weeks (B) after laser injury to the choroid (CH). The outer plexiform layer (OPL) was thinner at 2 weeks after CNV (arrow in B). C: Electroretinogram (ERG) recordings showed that the amplitudes of the b-wave were reduced 1 week after CNV. In this particular eye, the amplitude of the a-wave did not change. D: The b-wave amplitudes of the ERG were significantly reduced after CNV (repeated measures ANOVA, F = 6.076, P < 0.01). The amplitudes of the ERG recorded immediately after CNV did not differ from those of the control group (con). Filled circles represent mean ± SEM; open circles are data from individual mice. E: The outer plexiform layer did not show major histological changes 1 week after CNV. At 2 weeks after CNV, the outer nuclear layer had significantly fewer cell rows than that of the adjacent control retina (paired Student’s test, P < 0.01). Further cell loss was present at 4 weeks after CNV. Values are presented as a fraction of control values obtained from the adjacent retina. Asterisks indicate statistical significance. INL, inner nuclear layer; IPL, inner plexiform layer; SC, sclera. Scale bar = 100 μm in A (applies to A,B).
Fig. 26.
Fig. 26.
Immunostaining patterns for photoreceptor synaptic markers in the outer plexiform (OPL) layer changed abruptly after CNV. A,B: The precise arrangement of SV2 immunostaining in the OPL (A, adjacent retina) was completely disrupted in the retina over CNV (B, 4 weeks after CNV). By contrast, SV2 staining in the inner plexiform layer was not affected. C,D: vGluT1 immunostaining (red) was similarly disrupted over CNV (D, 4 weeks after CNV). Counterstaining with DAPI (blue) shows that the overall morphology of the retina was not affected. Scale bars 20 μm in A (applies to A,B), and C (applies to C,D). E: Quantification SV2 immunoreactivity in OPL at different time points following CNV induction. The intensity of SV2 immunoreactivity in the OPL was expressed as a fraction of that of the OPL in control, unaffected retinal regions. SV2 immunostaining was significantly decreased at 2 and 4 weeks after CNV induction (one-way ANOVA, P 0.001). F: Quantification of the lateral spread of CNV growth (red circles), of SV2 immunostaining reduction in retinas with CNV (black circles), and of SV2 immunostaining reduction in photocoagulated retinas of controls without CNV (empty circles).
Fig. 27.
Fig. 27.
A–C: Timecourse of immunostaining for Müller cell activation (Fos-related antigen) and outer plexiform vGluT1 immunostaining; Müller cell activation preceded the development of vGluT1 synaptic disruption. Immunostaining for fos-related antigens (FRA) strongly increased after CNV, reaching peak intensities at 1 week after CNV (B). At 4 weeks after CNV (C), immunostaining levels were lower than at 1 week after CNV but were still higher than in adjacent retinal regions (A). D–F: Immunostaining for vGluT1 began to show slight irregularity at week 1 but did not show extensive disruption over CNV until week 4. Scale bar = 50 μm in C (for A-C), 20 μm in E (for D-F). (G–H) Müller cell activation was most prominent over the leading of CNV growth. Increased pERK immunostaining was still present at 4 weeks after CNV in Müller cells located over the leading edges of CNV. Müller cells were labeled from the inner limiting membrane at the virtual surface to the outer limiting membrane at the level of photoreceptor inner segments. Strongest immunostaining intensities could be seen in Müller cell processes in the outer plexiform layer (arrow). Scale bar in G (for G and H) = 50 μm.
Fig. 28.
Fig. 28.
Bone marrow-derived cells [green fluorescent protein (GFP)-labeled] invaded the retina over choroidal neovascularization (CNV). (A) At 4 weeks after inducing CNV, many GFP-labeled cells were present in the retina over CNV but not in adjacent retinal regions. Stippled line = CNV borders; the center of the CNV lesion does not appear on this micrograph. (B) The number of GFP-labeled cells (bars) increased with time after CNV and correlated with CNV size (circles). # of GFP + cells = number of GFP-labeled cells per retinal sections containing CNV (n = 5 mice). 3d, 1w, 2w, 4w = 3 days, 1 week, 2 weeks, and 4 weeks after laser application, respectively. ONL, outer nuclear layer; INL, inner nuclear layer; IPL, inner plexiform layer; CH, choroid. Scale bars for A = 50 μm. (C–E) GFP-labeled cells (green in C) were immunoreactive for the mononuclear phagocyte marker F4/80 (red in D). In these representative images (4 weeks after CNV), all GFP-labeled bone marrow-derived cells were F4/80 immunoreactive (arrowheads, yellow in E) and had a macrophage phenotype. A resident microglial cell (arrow; not GFP-labeled) could also be seen. Scale bars = 50 μm (in C also applies to D and E).
Fig. 29.
Fig. 29.
Immunostaining intensities for vascular cell adhesion molecule 1 (VCAM 1), intercellular cell adhesion molecule 1 (ICAM 1) and platelet-endothelial cell adhesion molecule (PECAM) increased in retinal blood vessels over CNV. (A) At 3 days after inducing CNV, VCAM 1 immunostaining was strong in large blood vessels at the vitreal surface and small blood vessels in other retinal layers over CNV but was barely detectable in adjacent retinal regions. GFP-labeled cells (arrows) were seen close to immunoreactive blood vessels. The CNV lesion also contained GFP-labeled cells as well as VCAM 1 immunoreactivity. (B) At 4 weeks after inducing CNV, blood vessels in the inner retina and outer plexiform retina (arrowheads) were still VCAM 1 immunoreactive. The increased VCAM 1 immunoreactivity extended laterally. VCAM 1 was also upregulated in the outer limiting membrane over CNV. (C) Round and amoeboid GFP-labeled cells were seen closely associated with VCAM 1 immunoreactive blood vessels in the innermost regions of the retina 3 days after CNV. (D) At 4 weeks after CNV, blood vessels were still VCAM 1 immunoreactive. GFP-labeled cells had stellate morphology. (E) Quantification of VCAM 1 immunostaining in retinal blood vessels after CNV. There was a sharp increase in the intensity of VCAM 1 immunoreactivity at 3 days after CNV (3d). Immunoreactivity intensities remained high thereafter (n = 5 mice per time point). C = values from control (adjacent) retina. Control values were similar at all time points and were pooled. a.u. = arbitrary units. (F) The lateral spread of increased VCAM 1 immunoreactivity (empty circles; n = 5 mice per time point) increased with time and paralleled CNV growth (filled circles; n = 5 mice per time point). Scale bars = 100 μm (in B, also applies to A), 20 μm (in D, also applies to C). (G and H) At 1 week after CNV (G), blood vessels at the vitreal surface were ICAM 1 immunoreactive. ICAM 1 immunoreactive blood vessels could also be seen in the outer plexiform layer (H; 4 weeks after CNV). GFP-labeled cells were closely associated with these blood vessels. (I and J) GFP-labeled cells colocalized with strongly PECAM immunoreactive blood vessels in the outer plexiform layer (I) and at the vitreal surface (J) in the retina over CNV. Scale bars = 20 μm (in G also applies to H, in J to I).
Fig. 30.
Fig. 30.
Bone marrow-derived macrophages were closely associated with activated Müller cells over CNV (4 weeks after laser application). GFP-labeled cells colocalized with c-fos (red in A) and pERK (red in B, C) immunoreactive Müller cells. Macrophage processes were seen intermingling with Müller cell processes in the outer plexiform layer (C). Scale bars = 20 μm (in B also applies to C).
Fig. 31.
Fig. 31.
Depletion of circulating macrophages diminished macrophage infiltration and Müller cell activation in the retina over CNV. (A) The retina overlying CNV (2 weeks after laser application) of a PBS-treated (control) mouse showed extensive macrophage recruitment (red F4/80 immunofluorescence) and Müller cell activation (green pERK immunofluorescence). (B) Clodronate treatment strongly reduced macrophage recruitment and Müller cell activation. (C) Quantification of macrophage densities in PBS-treated (PBS) and clodronate-treated mice (CLO) in retinal regions over (filled bars) and adjacent to CNV (empty bars). Macrophage densities significantly increased in PBS treated but not in clodronate-treated mice (CLO; n = 8 mice per group; paired Student’s t-test; asterisk denotes significance at p < 0.01). Stippled line = macrophage density of control retinal regions. (D) The density of pERK immunoreactive Müller cells over CNV was reduced in clodronate-treated mice (n = 8 mice per group; Student’s t-test; p < 0.05). Scale bar = 50 μm.
Fig. 32.
Fig. 32.
Müller cells provide a number of critical support functions required for normal photoreceptor and neuronal function including glutamate reuptake and metabolism, potassium and water homeostasis, neurovascular coupling, support of cone visual cycle and release of neurotrophic factors. (A) Macrophages extravasate from the retinal vasculature and subsequently contact and injure Müller cells leading to dysfunction of one or more Müller cell functions. Potential injury mechanisms include cytokine release, glutamate release, reactive oxygen species production or others as yet uncharacterized. (B) These injury stimuli may lead to loss of normal cytoskeleton, cell adhesion, glutamate cycle, ion and water regulation and mitochondrial function in Müller cells which are required for synaptic support of photoreceptors and neurons.

References

    1. Akwii RG, Sajib MS, Zahra FT, Mikelis CM, 2019. Role of Angiopoietin-2 in Vascular Physiology and Pathophysiology’, Cells, p. 8. - PMC - PubMed
    1. Al-Khersan H, Hussain RM, Ciulla TA, Dugel PU, 2019. ’Innovative therapies for neovascular age-related macular degeneration. Expet Opin. Pharmacother. 20, 1879–1891. - PubMed
    1. Al-Sheikh M, Iafe NA, Phasukkijwatana N, Sadda SR, Sarraf D, 2018. Biomarkers of neovascular activity in age-related macular degeneration using optical coherence tomography angiography’. Retina 38, 220–230. - PubMed
    1. Allingham MJ, Tserentsoodol N, Saloupis P, Mettu PS, Cousins SW, 2018. ’Aldosterone exposure causes increased retinal edema and severe retinopathy following laser-induced retinal vein occlusion in mice. Invest. Ophthalmol. Vis. Sci. 59, 3355–3365. - PubMed
    1. Allingham MJ, Mettu PS, Cousins SW, 2019. ’Elamipretide, a mitochondrial- targeted drug, for the treatment of vision loss in dry AMD with high risk drusen: results of the phase 1 ReCLAIM study. Invest. Ophthalmol. Vis. Sci. 60, 361–61.

Publication types

Substances