. 2020 Oct 2;9(10):2230.
doi: 10.3390/cells9102230.

TAZ Represses the Neuronal Commitment of Neural Stem Cells

Affiliations

TAZ Represses the Neuronal Commitment of Neural Stem Cells

Natalia Robledinos-Antón et al. Cells. .

Abstract

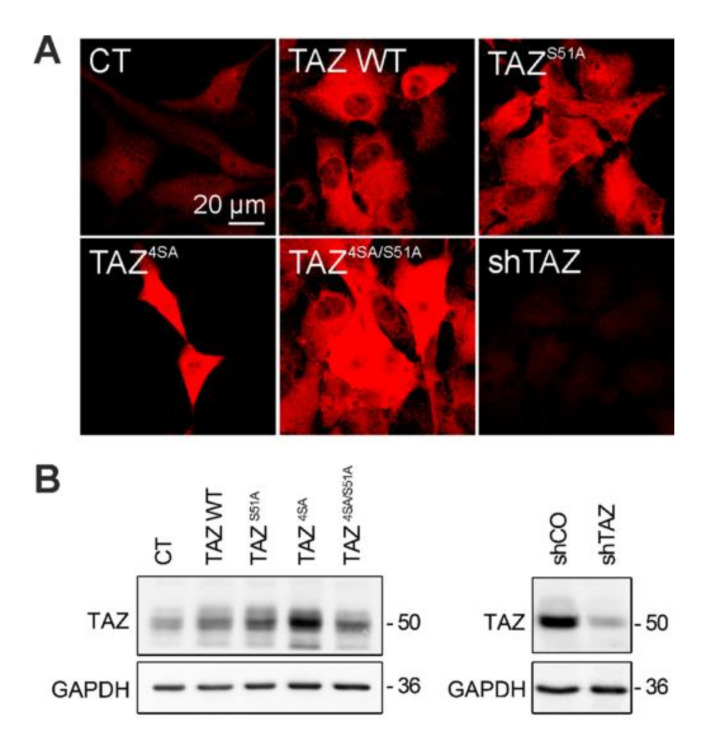
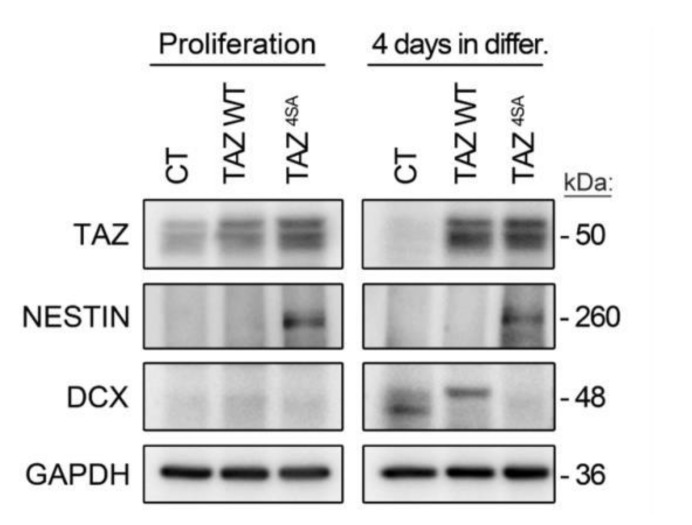
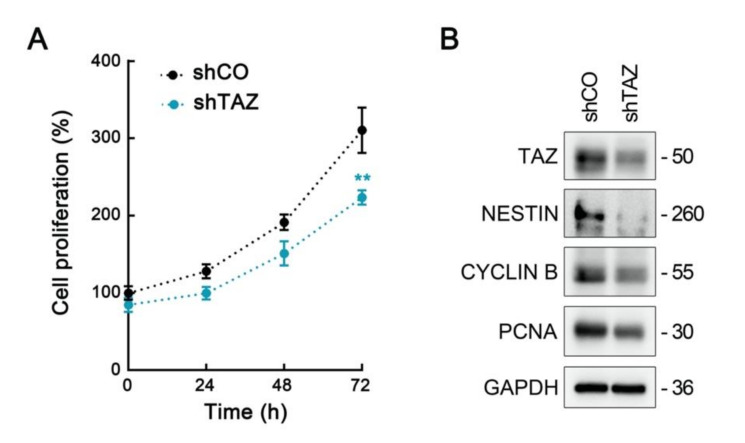
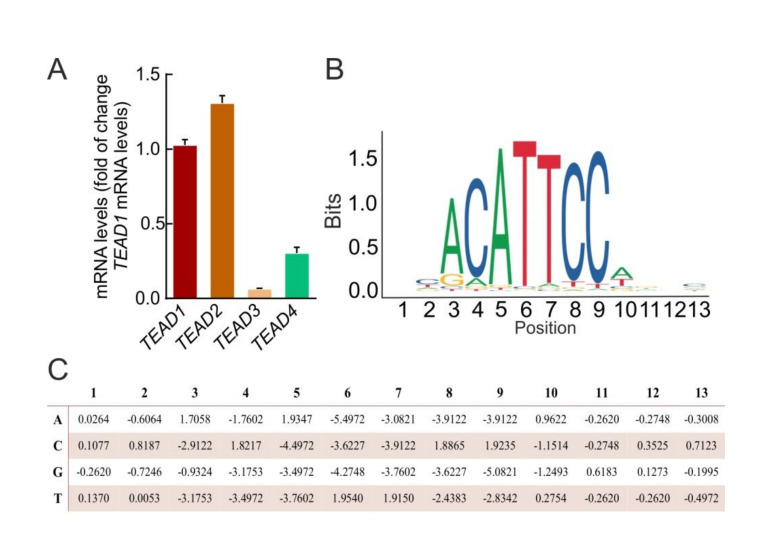
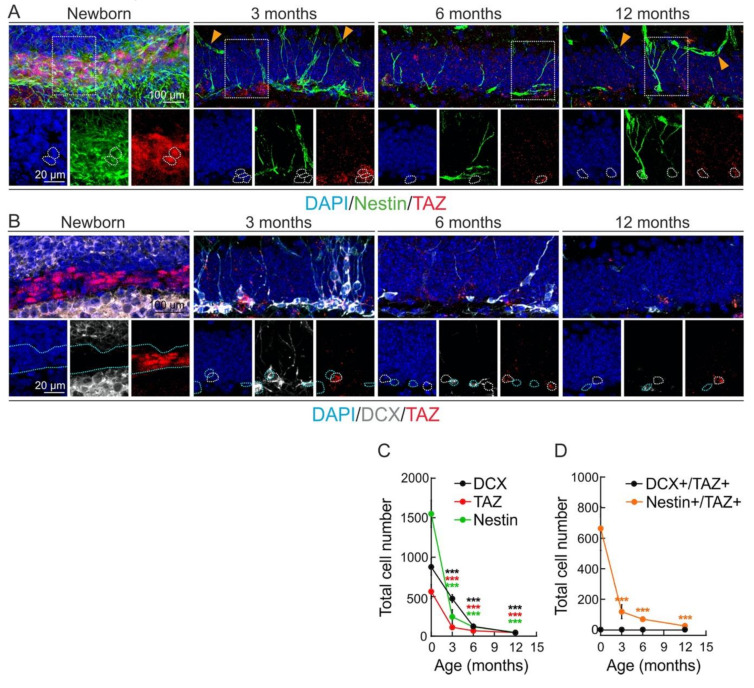
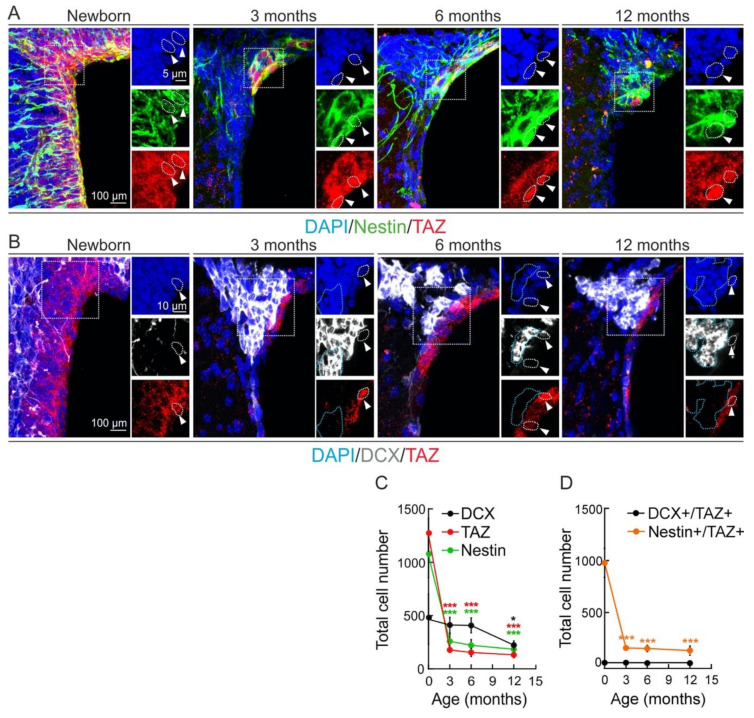
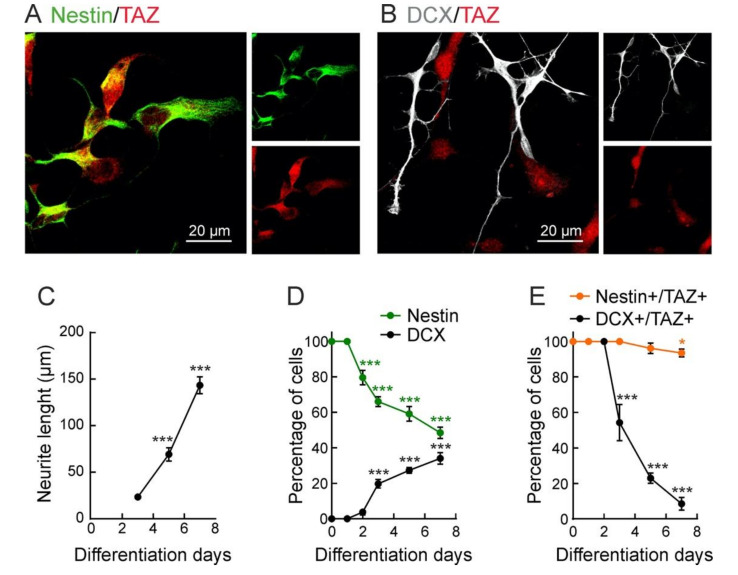
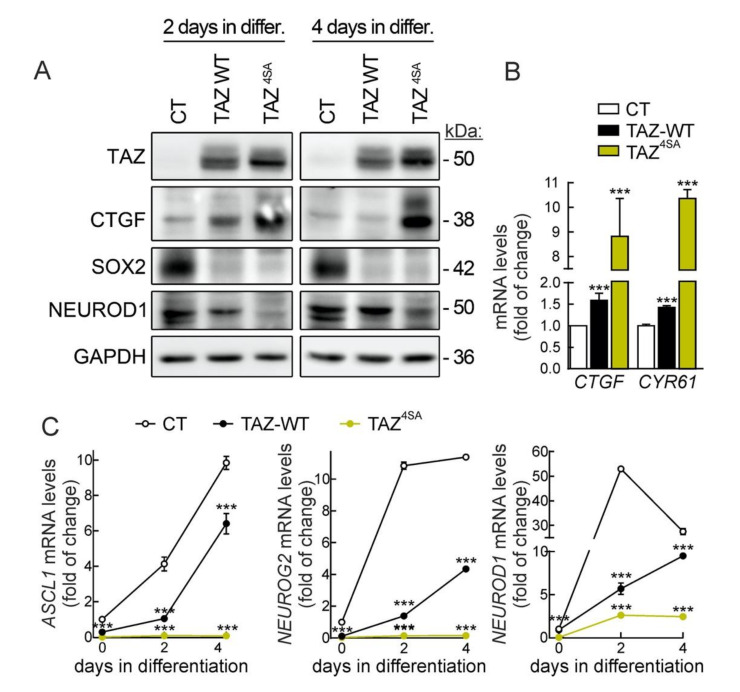
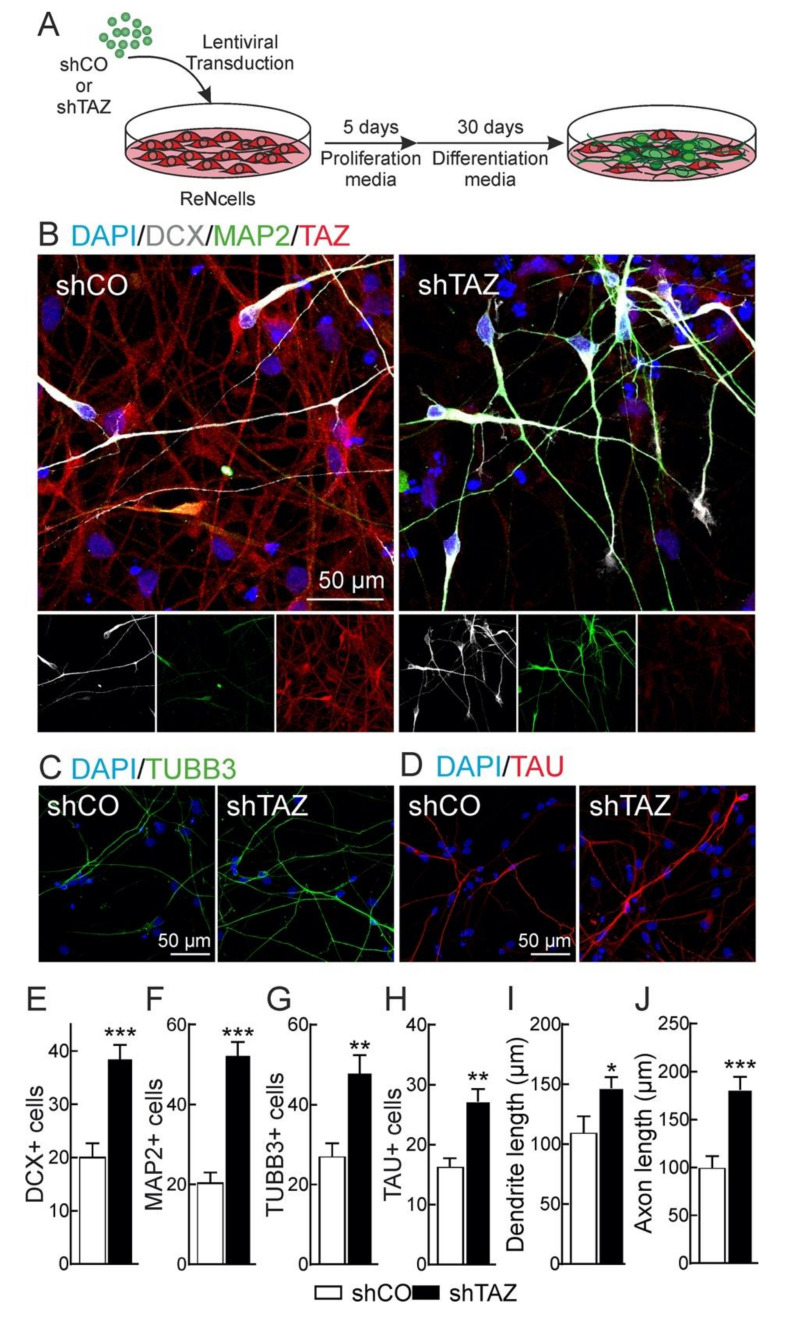
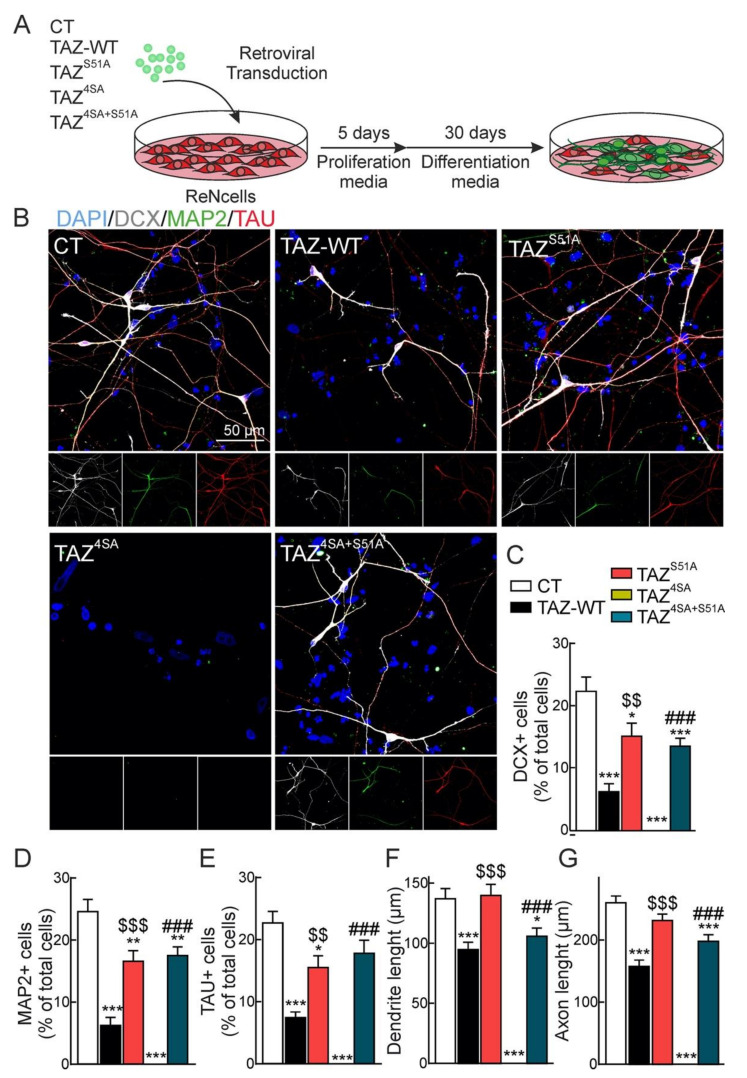
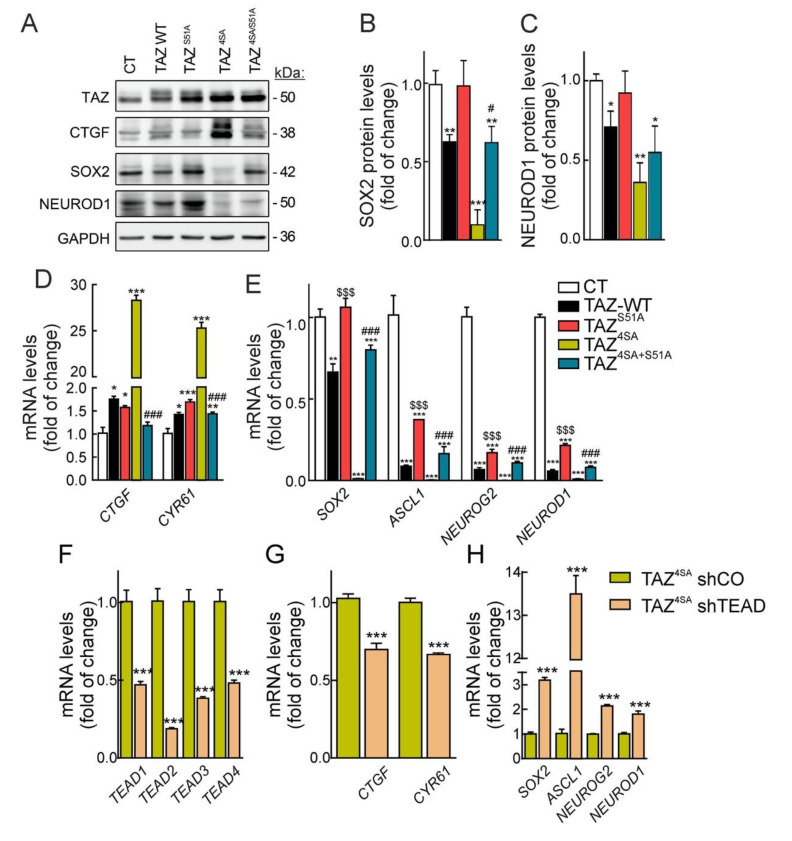
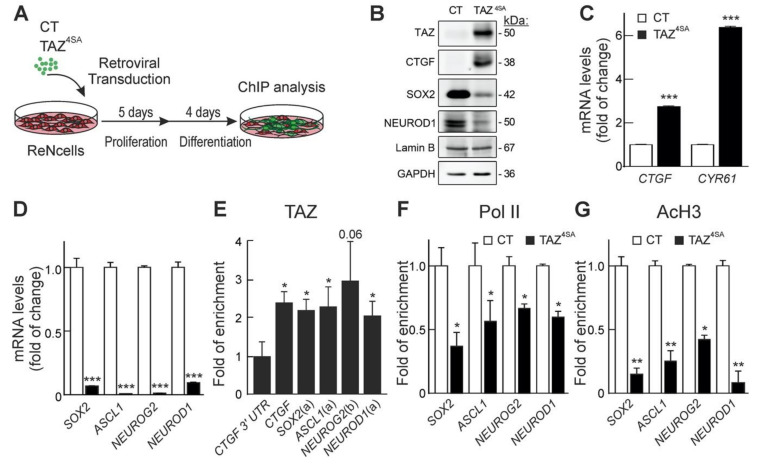
The mechanisms involved in regulation of quiescence, proliferation, and reprogramming of Neural Stem Progenitor Cells (NSPCs) of the mammalian brain are still poorly defined. Here, we studied the role of the transcriptional co-factor TAZ, regulated by the WNT and Hippo pathways, in the homeostasis of NSPCs. We found that, in the murine neurogenic niches of the striatal subventricular zone and the dentate gyrus granular zone, TAZ is highly expressed in NSPCs and declines with ageing. Moreover, TAZ expression is lost in immature neurons of both neurogenic regions. To characterize mechanistically the role of TAZ in neuronal differentiation, we used the midbrain-derived NSPC line ReNcell VM to replicate in a non-animal model the factors influencing NSPC differentiation to the neuronal lineage. TAZ knock-down and forced expression in NSPCs led to increased and reduced neuronal differentiation, respectively. TEADs-knockdown indicated that these TAZ co-partners are required for the suppression of NSPCs commitment to neuronal differentiation. Genetic manipulation of the TAZ/TEAD system showed its participation in transcriptional repression of SOX2 and the proneuronal genes ASCL1, NEUROG2, and NEUROD1, leading to impediment of neurogenesis. TAZ is usually considered a transcriptional co-activator promoting stem cell proliferation, but our study indicates an additional function as a repressor of neuronal differentiation.

Keywords: ASCL; NEUROD1; NEUROG2; SOX2; hippo; neural stem cells; neurogenesis; neuronal differentiation.


Conflict of interest statement

The authors declare no conflict of interest.

Figures

Figure A1
Figure A1
Specificity of the TAZ antibody. (A) Representative confocal images of TAZ immunostaining in cells transduced with empty viral vector (CT), or vector expressing wild type TAZ (TAZ-WT), or mutant TAZS51A, TAZ4SA and TAZ4SA+S51A and shTAZ ReNcells VM after 5 days of viral transduction. (B) Representative immunoblot analysis of TAZ in ReNcells after 5 days of viral transduction, showing a specific band around 50 kDa. GADPH was used as load control.
Figure A2
Figure A2
Effect of differentiation markers in ReNcells ectopically expression wild type or mutant TAZ4SA. ReNcells were transduced with retroviral expression vectors for wild type TAZ or mutant TAZ4SA under proliferating conditions (left panels). Then, cells were plated for 4 days in differentiation medium (right panels). Overexpression of the very active TAZ4SA mutant led to significant detection of NESTIN under proliferation conditions, but also in differentiation medium. By contrast, TAZ4SA blocked DCX expression under differentiator conditions.
Figure A3
Figure A3
Analysis of proliferative markers in TAZ-depleted ReNcells. Cells were transduced with lentiviral vectors for expression of sh control (shCO) or shTAZ. (A) After 4 days in selection medium 4,000 cells/well of each condition were analyzed in quadrupled according to the MTT method (see Material and Methods). (B) At time 0, cell lysates were also analyzed by immunoblot. Note the decrease in the proliferative markers CYCLINB and PCNA as well as in the neural stem cell marker NESTIN.
Figure A4
Figure A4
TEADs expression in ReNcells VM and JASPAR-based analysis of the consensus TEAD binding sequences. (A) mRNA levels of the TEADs 1 to 4 were determined by qRT-PCR and normalized to the levels of TEAD1. mRNA levels were determined by qRT-PCR and normalized by the geometric mean of ACTB, GAPDH and TBP levels. Data represent mean ± S.D. (n = 4). (B) TEAD2 motif from JASPAR database indicating its consensus binding profile. (C) Position specific scoring matrix (PSSM) for TEAD2 PSSM derived from the frequency matrix available in JASPAR database (PSSM or TEAD1, TEAD3 and TEAD4 are available upon request).
Figure 1
Figure 1
TAZ expression declines in the neurogenic niche of the subgranular zone (SGZ). (A,B), representative confocal immunofluorescence photographs of Nestin/TAZ and DCX/TAZ stained cells, respectively, in the SGZ of new-born, 3-, 6- and 12- month-old mice. Nuclei are counterstained with DAPI. White dotted lines indicate examples of TAZ+ cells. Yellow arrowheads denote Nestin-stained blood vessels that were not analyzed. Blue dotted lines indicate DCX+/TAZ cells. (C) quantification of Nestin+, DCX+ or TAZ+ cells. Data represent mean ± SEM (n = 5 mice per age). Asterisks denote statistically significant differences of the age 0 group vs. the other time points of DCX+ (black), TAZ+ (red), and Nestin+ (green) groups, according to one-way ANOVA. *** p < 0.001. (D) quantification of Nestin+/TAZ+ and DCX+/TAZ+ cells. Data represent mean ± SEM (n = 5 mice per age). Asterisks denote statistically significant differences of the age 0 group vs. the other time points of the Nestin+/TAZ+ groups, according to one-way ANOVA. *** p < 0.001. The changes in the DCX+/TAZ+ cells were not statistically significant.
Figure 2
Figure 2
TAZ expression declines in the neurogenic niche of the subventricular zone (SVZ). (A,B), representative confocal immunofluorescence photographs of Nestin/TAZ and DCX/TAZ stained cells, respectively, in the SVZ of new-born, 3-, 6-, and 12- month-old mice. Nuclei are counterstained with DAPI. White arrowheads and dotted lines indicate TAZ+ cells. Blue dotted lines indicate DCX+/TAZ cells. (C), quantification of Nestin+, DCX+ or TAZ+ cells. Data represent mean ± SEM (n = 5 mice per age). Asterisks denote statistically significant differences of the age 0 group vs. the other time points of DCX+ (black), TAZ+ (red), and Nestin+ (green) groups, according to one-way ANOVA. * p < 0.05; *** p < 0.001 (D), quantification of Nestin+/TAZ+ and DCX+/TAZ+ cells. Data represent mean ± SEM (n = 5 mice per age). Asterisks denote statistically significant differences of the age 0 group vs. the other time points of the Nestin+/TAZ+ groups, according to one-way ANOVA. *** p < 0.001. The changes in the DCX+/TAZ+ cells were not statistically significant.
Figure 3
Figure 3
TAZ expression declines during neuronal differentiation. Representative confocal images of ReNcells VM immunostained with (A) Nestin and TAZ under proliferative conditions (in the presence of growth factors) or (B) immunostained with DCX and TAZ after seven days under differentiation conditions (in the absence of growth factors); (C) neurite length of DCX+ cells during differentiation; (D) quantification of Nestin+ and DCX+ ReNcells VM during differentiation; (E) quantification of Nestin+/TAZ+ cells DCX+/TAZ+ cells during differentiation. Data are mean ± S.E.M. (n = 50). Asterisks denote statistically significant differences of the group at age 0 vs. the other color-coded groups, according to one-way ANOVA. * p < 0.05, *** p < 0.001.
Figure 4
Figure 4
TAZ overexpression decreases the expression of SOX2 and proneuronal genes. (A) representative immunoblot of TAZ, CTGF, SOX2, NEUROD1, and GAPDH as a loading control in ReNcells VM transduced with wild type or TAZ4SA-expressing retrovirus after two or four days post infection; (B) mRNA levels of TAZ targets CTGF and CYR61; (C) mRNA levels of ASCL1, NEUROG2 and NEUROD1. mRNA levels were determined by qRT-PCR and normalized by the geometric mean of ACTB, GAPDH and TBP levels. Data represent mean ± S.D. (n = 4). Statistical analysis was performed using one-way ANOVA. *** p < 0.001 vs. CT.
Figure 5
Figure 5
Loss of TAZ favours neuronal differentiation. (A) schematic overview of the experimental procedure. ReNcells VM were transduced with lentivirus encoding shcontrol (shCO) or human shTAZ, and after five days were plated under differentiation conditions (in the absence of growth factors) for 30 days. Representative confocal immunofluorescence photographs of DCX, MAP2, and TAZ (B), TUBB3 (C), and TAU (D). Nuclei are counterstained with DAPI. Quantifications correspond to DCX+ (E), MAP2+ (F), TUBB3+ (G), and TAU+ (H) cells. (I) Dendrite length based on MAP2 staining; (J) axonal length based on TAU staining. Data are mean ± S.E.M (n = 20). Statistical analysis was performed with the Student’s t-test. * p < 0.05; ** p < 0.01, *** p < 0.005.
Figure 6
Figure 6
TEADs participate in the inhibitory effect of TAZ on neuronal differentiation. (A) schematic overview of the experimental design. ReNcells VM were transduced with empty vector (CT) or retroviral vector for overexpression of TAZ-WT and TAZ mutants TAZS51A, TAZ4SA and TAZ4SA+S51A. After five days of retroviral transduction, cells were incubated under differentiation conditions for 30 days; (B) immunostaining with neuronal markers DCX, MAP2, and TAU. Nuclei are counterstained with DAPI. Quantification of DCX+ (C), MAP2+ (D), and TAU+ (E) cells. (F) dendrite length based on MAP2 staining; (G) axonal length based on TAU staining. Data are mean ± S.E.M. (n = 20). Statistical analysis was performed with one-way ANOVA. * p < 0.05; ** p < 0.01, *** p < 0.001 vs. CT. $$ p < 0.01, $$$ p < 0.001 comparing TAZS51A vs. TAZ-WT. ### p < 0.001 comparing TAZ4SA+S51A vs. TAZ4SA.
Figure 7
Figure 7
TAZ/TEAD is a transcriptional repressor of SOX2 and proneuronal transcription factors. (A) representative immunoblots of TAZ, CTGF, SOX2, NEUROD1, and GAPDH as a loading control in ReNcells VM CT, TAZ-WT, TAZS51A, TAZ4SA, and TAZ4SA+S51A after five days of retroviral transduction; (B) densitometric quantification of SOX2 protein levels in (A) relative to GAPDH; (C) densitometric quantification of NEUROD1 protein levels in (A) relative to GAPDH. Data are mean ± SEM (n = 4). (D) mRNA levels of TAZ targets CTGF and CYR61. (E) mRNA levels of SOX2, ASCL1, NEUROG2 and NEUROD1. mRNA levels were determined by qRT-PCR and normalized by the geometric mean of ACTB, GAPDH and TBP levels. Data are presented as mean ± S.D. (n = 4). Statistical analysis was performed using one-way ANOVA. * p < 0.05; ** p < 0.01, *** p < 0.001 vs. control conditions. $$$ p < 0.001 comparing TAZS51A vs. TAZ-WT. # p < 0.05; ### p < 0.001 comparing TAZ4SA+S51A vs. TAZ4SA. (F) mRNA levels of TEAD1, TEAD2, TEAD3 and TEAD4 in ReNcells VM after 5 days of lentiviral transduction with control vector (shCO) or shRNA against co-expression of shRNAs for TEAD1/3/4, and TEAD2 (shTEAD). (G) mRNA levels of CTGF and CYR61; (H) mRNA levels of SOX2, ASCL1, NEUROG2, and NEUROD1. mRNA levels were determined by qRT-PCR and normalized by the geometric mean of ACTB, GAPDH and TBP levels. Data represent mean ± S.D. (n = 4). Statistical analysis was performed using one-way ANOVA. *** p < 0.001 vs. shCO.
Figure 8
Figure 8
TAZ/TEAD induces epigenetic changes that inhibit the expression of SOX2 and proneuronal genes. (A) Representative scheme of experimental procedure. ReNcells VM were transduced with retroviral vector control (CT) or TAZ4SA and grown for five days in proliferative conditions and 4 days in differentiation conditions; (B) representative immunoblots of TAZ, CTGF, SOX2, and NEUROD1 carrying GAPDH and Lamin B as loading controls; (C) mRNA levels of TAZ targets CTGF and CYR61; (D) mRNA levels of SOX2, ASCL1, NEUROG2 and NEUROD1. mRNA levels were determined by qRT-PCR and normalized by the geometric mean of ACTB, GAPDH, and TBP levels. Data are mean ± S.D. (n = 4). Statistical analysis was performed using Student’s t-test. *** p < 0.001 vs. CT. (E) ChIP-qPCR analysis of putative TAZ/TEAD interacting regions in SOX2 and proneurogenic the genes as indicated in Table A2 and Table A4 of the Appendix A. (F,G) ChIP-qPCR analysis of enrichment of Pol II (F) or AcH3 (G) in the genes SOX2, ASCL1, NEUROG2, and NEUROD1, immunoprecipitated with anti-Pol II or anti-AcH3 antibodies, respectively. qPCR determination was performed with the oligonucleotides indicated in Table A2 of the Appendix A. Data represent mean ± S.D. of three independent immunoprecipitations. Statistical analysis was performed using one-way ANOVA. * p < 0.05 vs. each control group.

Similar articles

Cited by

References

    1. Kumar A., Pareek V., Faiq M.A., Ghosh S.K., Kumari C. ADULT NEUROGENESIS IN HUMANS: A Review of Basic Concepts, History, Current Research, and Clinical Implications. Innov. Clin. Neurosci. 2019;16:30–37. - PMC - PubMed
    1. Moreno-Jimenez E.P., Flor-Garcia M., Terreros-Roncal J., Rabano A., Cafini F., Pallas-Bazarra N., Avila J., Llorens-Martin M. Adult hippocampal neurogenesis is abundant in neurologically healthy subjects and drops sharply in patients with Alzheimer’s disease. Nat. Med. 2019;25:554–560. doi: 10.1038/s41591-019-0375-9. - DOI - PubMed
    1. Takei Y. Age-dependent decline in neurogenesis of the hippocampus and extracellular nucleotides. Hum. Cell. 2019;32:88–94. doi: 10.1007/s13577-019-00241-9. - DOI - PubMed
    1. Marchetti B., Tirolo C., L’Episcopo F., Caniglia S., Testa N., Smith J.A., Pluchino S., Serapide M.F. Parkinson’s disease, aging and adult neurogenesis: Wnt/beta-catenin signalling as the key to unlock the mystery of endogenous brain repair. Aging Cell. 2020;19:e13101. doi: 10.1111/acel.13101. - DOI - PMC - PubMed
    1. Marchetti B. Wnt/beta-Catenin Signaling Pathway Governs a Full Program for Dopaminergic Neuron Survival, Neurorescue and Regeneration in the MPTP Mouse Model of Parkinson’s Disease. Int. J. Mol. Sci. 2018;19:3743. doi: 10.3390/ijms19123743. - DOI - PMC - PubMed

Publication types

Substances