

Pre-purification of diatom pigment protein complexes provides insight into the heterogeneity of FCP complexes
- PMID: 33023504
- PMCID: PMC7539453
- DOI: 10.1186/s12870-020-02668-x
Pre-purification of diatom pigment protein complexes provides insight into the heterogeneity of FCP complexes
Abstract
Background: Although our knowledge about diatom photosynthesis has made huge progress over the last years, many aspects about their photosynthetic apparatus are still enigmatic. According to published data, the spatial organization as well as the biochemical composition of diatom thylakoid membranes is significantly different from that of higher plants.
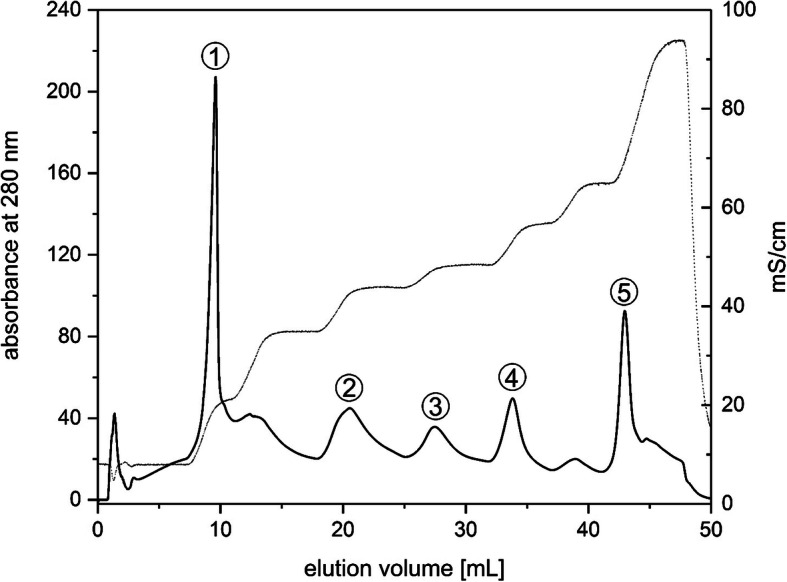
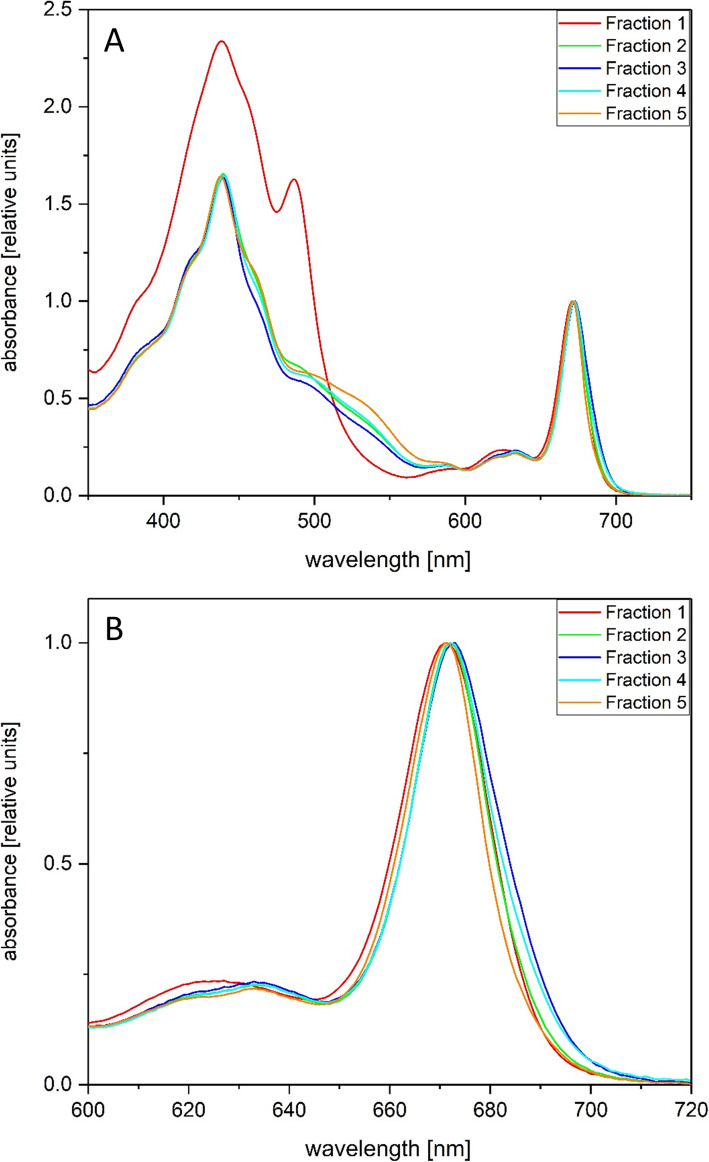
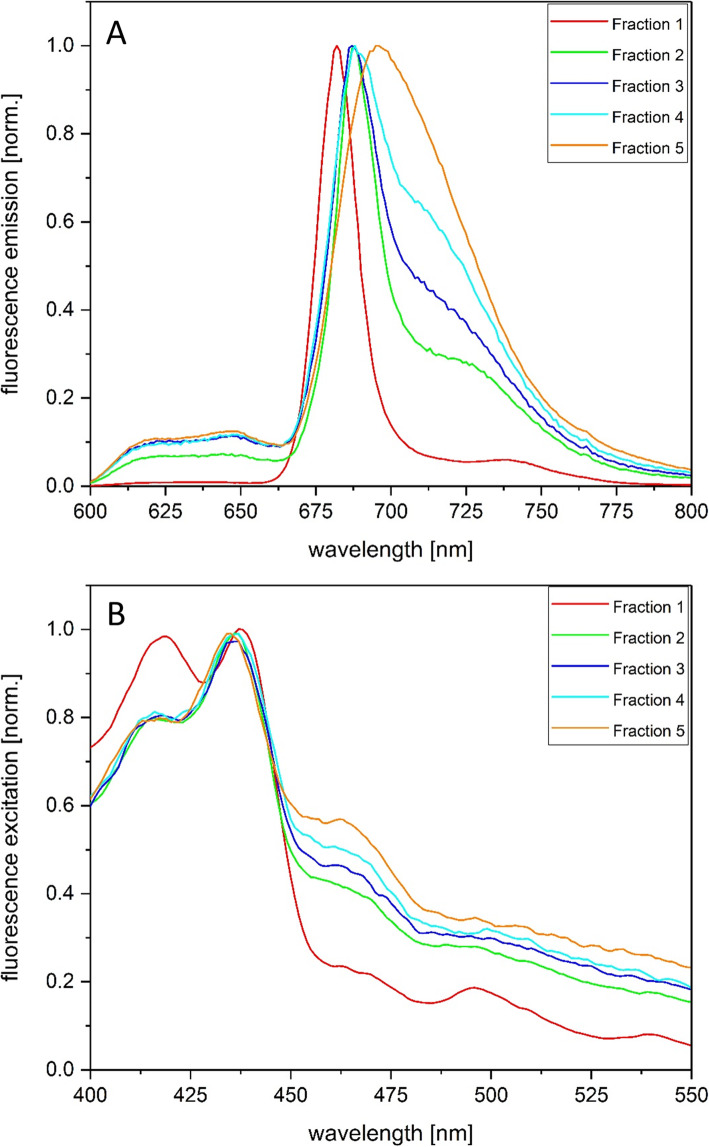
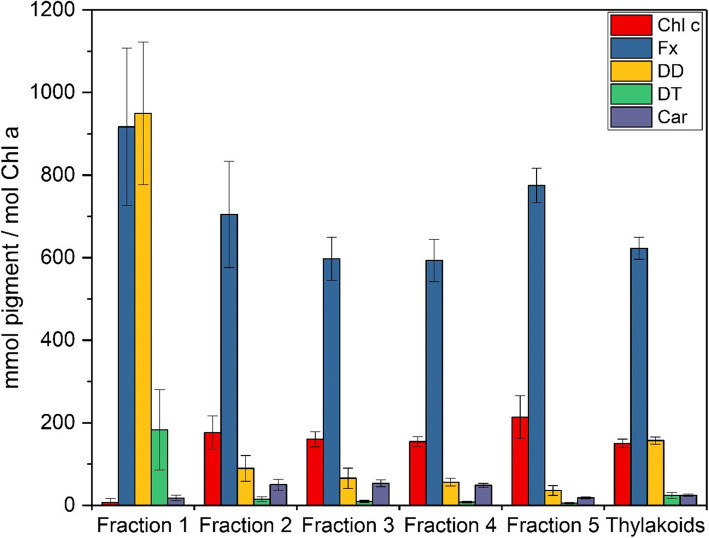
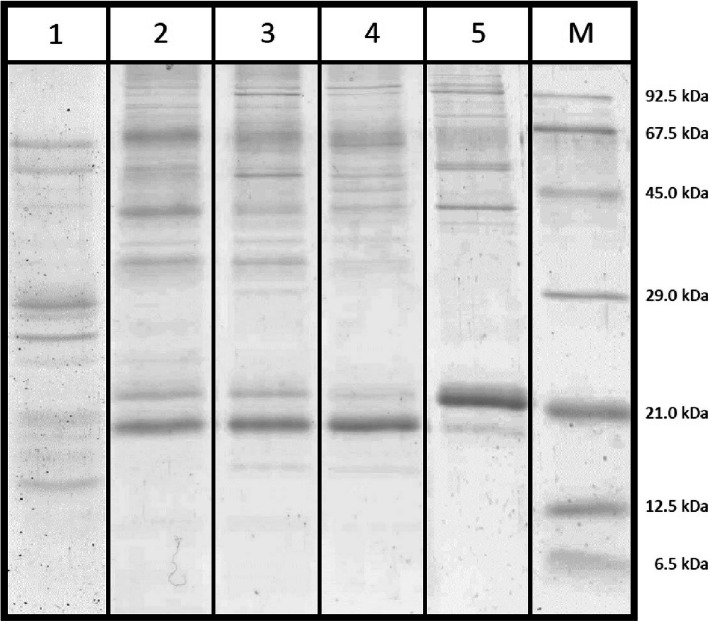
Results: In this study the pigment protein complexes of the diatom Thalassiosira pseudonana were isolated by anion exchange chromatography. A step gradient was used for the elution process, yielding five well-separated pigment protein fractions which were characterized in detail. The isolation of photosystem (PS) core complex fractions, which contained fucoxanthin chlorophyll proteins (FCPs), enabled the differentiation between different FCP complexes: FCP complexes which were more closely associated with the PSI and PSII core complexes and FCP complexes which built-up the peripheral antenna. Analysis by mass spectrometry showed that the FCP complexes associated with the PSI and PSII core complexes contained various Lhcf proteins, including Lhcf1, Lhcf2, Lhcf4, Lhcf5, Lhcf6, Lhcf8 and Lhcf9 proteins, while the peripheral FCP complexes were exclusively composed of Lhcf8 and Lhcf9. Lhcr proteins, namely Lhcr1, Lhcr3 and Lhcr14, were identified in fractions containing subunits of the PSI core complex. Lhcx1, Lhcx2 and Lhcx5 proteins co-eluted with PSII protein subunits. The first fraction contained an additional Lhcx protein, Lhcx6_1, and was furthermore characterized by high concentrations of photoprotective xanthophyll cycle pigments.
Conclusion: The results of the present study corroborate existing data, like the observation of a PSI-specific antenna complex in diatoms composed of Lhcr proteins. They complement other data, like e.g. on the protein composition of the 21 kDa FCP band or the Lhcf composition of FCPa and FCPb complexes. They also provide interesting new information, like the presence of the enzyme diadinoxanthin de-epoxidase in the Lhcx-containing PSII fraction, which might be relevant for the process of non-photochemical quenching. Finally, the high negative charge of the main FCP fraction may play a role in the organization and structure of the native diatom thylakoid membrane. Thus, the results present an important contribution to our understanding of the complex nature of the diatom antenna system.
Keywords: Anion exchange chromatography; Fucoxanthin chlorophyll protein; Lhcx; Mass spectrometry; Photosystem I; Photosystem II.
Conflict of interest statement
The authors declare that they have no competing interests.
Figures
Similar articles
-
Specific Lhc Proteins Are Bound to PSI or PSII Supercomplexes in the Diatom Thalassiosira pseudonana.Plant Physiol. 2020 May;183(1):67-79. doi: 10.1104/pp.20.00042. Epub 2020 Mar 20. Plant Physiol. 2020. PMID: 32198308 Free PMC article.
-
Fucoxanthin-Chlorophyll Protein Complexes of the Centric Diatom Cyclotella Meneghiniana Differ in Lhcx1 and Lhcx6_1 Content.Plant Physiol. 2019 Apr;179(4):1779-1795. doi: 10.1104/pp.18.01363. Epub 2019 Feb 7. Plant Physiol. 2019. PMID: 30733257 Free PMC article.
-
Isolation of fucoxanthin chlorophyll protein complexes of the centric diatom Thalassiosira pseudonana associated with the xanthophyll cycle enzyme diadinoxanthin de-epoxidase.IUBMB Life. 2023 Jan;75(1):66-76. doi: 10.1002/iub.2650. Epub 2022 May 26. IUBMB Life. 2023. PMID: 35557488
-
Structural features of the diatom photosystem II-light-harvesting antenna complex.FEBS J. 2020 Jun;287(11):2191-2200. doi: 10.1111/febs.15183. Epub 2020 Jan 7. FEBS J. 2020. PMID: 31854056 Review.
-
Carotenoids, versatile components of oxygenic photosynthesis.Prog Lipid Res. 2013 Oct;52(4):539-61. doi: 10.1016/j.plipres.2013.07.001. Epub 2013 Jul 26. Prog Lipid Res. 2013. PMID: 23896007 Review.
Cited by
-
The Critical Studies of Fucoxanthin Research Trends from 1928 to June 2021: A Bibliometric Review.Mar Drugs. 2021 Oct 26;19(11):606. doi: 10.3390/md19110606. Mar Drugs. 2021. PMID: 34822476 Free PMC article. Review.
-
Light Harvesting in Fluctuating Environments: Evolution and Function of Antenna Proteins across Photosynthetic Lineage.Plants (Basel). 2021 Jun 10;10(6):1184. doi: 10.3390/plants10061184. Plants (Basel). 2021. PMID: 34200788 Free PMC article.
References
MeSH terms
Substances
LinkOut - more resources
Full Text Sources
