Alternative graphical displays for the monitoring of epidemic outbreaks, with application to COVID-19 mortality
- PMID: 33023505
- PMCID: PMC7537983
- DOI: 10.1186/s12874-020-01122-8
Alternative graphical displays for the monitoring of epidemic outbreaks, with application to COVID-19 mortality
Erratum in
-
Correction to: Alternative graphical displays for the monitoring of epidemic outbreaks, with application to COVID-19 mortality.BMC Med Res Methodol. 2020 Oct 26;20(1):265. doi: 10.1186/s12874-020-01147-z. BMC Med Res Methodol. 2020. PMID: 33106163 Free PMC article.
Abstract
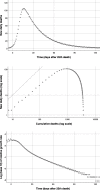
Background: Classic epidemic curves - counts of daily events or cumulative events over time -emphasise temporal changes in the growth or size of epidemic outbreaks. Like any graph, these curves have limitations: they are impractical for comparisons of large and small outbreaks or of asynchronous outbreaks, and they do not display the relative growth rate of the epidemic. Our aim was to propose two additional graphical displays for the monitoring of epidemic outbreaks that overcome these limitations.
Methods: The first graph shows the growth of the epidemic as a function of its size; specifically, the logarithm of new cases on a given day, N(t), is plotted against the logarithm of cumulative cases C(t). Logarithm transformations facilitate comparisons of outbreaks of different sizes, and the lack of a time scale overcomes the need to establish a starting time for each outbreak. Notably, on this graph, exponential growth corresponds to a straight line with a slope equal to one. The second graph represents the logarithm of the relative rate of growth of the epidemic over time; specifically, log10(N(t)/C(t-1)) is plotted against time (t) since the 25th event. We applied these methods to daily death counts attributed to COVID-19 in selected countries, reported up to June 5, 2020.
Results: In most countries, the log(N) over log(C) plots showed initially a near-linear increase in COVID-19 deaths, followed by a sharp downturn. They enabled comparisons of small and large outbreaks (e.g., Switzerland vs UK), and identified outbreaks that were still growing at near-exponential rates (e.g., Brazil or India). The plots of log10(N(t)/C(t-1)) over time showed a near-linear decrease (on a log scale) of the relative growth rate of most COVID-19 epidemics, and identified countries in which this decrease failed to set in in the early weeks (e.g., USA) or abated late in the outbreak (e.g., Portugal or Russia).
Conclusions: The plot of log(N) over log(C) displays simultaneously the growth and size of an epidemic, and allows easy identification of exponential growth. The plot of the logarithm of the relative growth rate over time highlights an essential parameter of epidemic outbreaks.
Keywords: COVID-19; Epidemic curve; Growth rate.
Conflict of interest statement
The authors declare that they have no competing interests.
Figures


References
-
- The New York Times. Coronavirus map: tracking the global outbreak. May 8, 2020. https://www.nytimes.com/interactive/2020/world/coronavirus-maps.html.
-
- Kevorkian A, Grenet T, Gallee H. Tracking the Covid-19 pandemic: simple visualization of epidemic states and trajectories of select European countries & assessing the effect of delays in official response. MedRxiv. 2020. 10.1101/2020.03.14.20035964https://www.medrxiv.org/content/10.1101/2020.03.14.20035964v2. - DOI
-
- European Centre for Disease Prevention and Control. COVID-19. Today’s data on the geographic distribution of COVID-19 cases worldwide, June 5, 2020. https://www.ecdc.europa.eu/en/publications-data/download-todays-data-geo....
MeSH terms
LinkOut - more resources
Full Text Sources
Research Materials

