Comparative Study
. 2020 Oct 6;21(1):259.
doi: 10.1186/s13059-020-02162-5.

A genome assembly and the somatic genetic and epigenetic mutation rate in a wild long-lived perennial Populus trichocarpa

Affiliations
Comparative Study

A genome assembly and the somatic genetic and epigenetic mutation rate in a wild long-lived perennial Populus trichocarpa

Brigitte T Hofmeister et al. Genome Biol. .

Abstract

Background: Plants can transmit somatic mutations and epimutations to offspring, which in turn can affect fitness. Knowledge of the rate at which these variations arise is necessary to understand how plant development contributes to local adaption in an ecoevolutionary context, particularly in long-lived perennials.

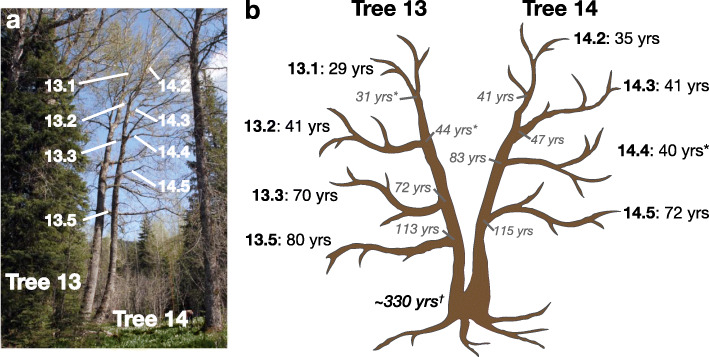
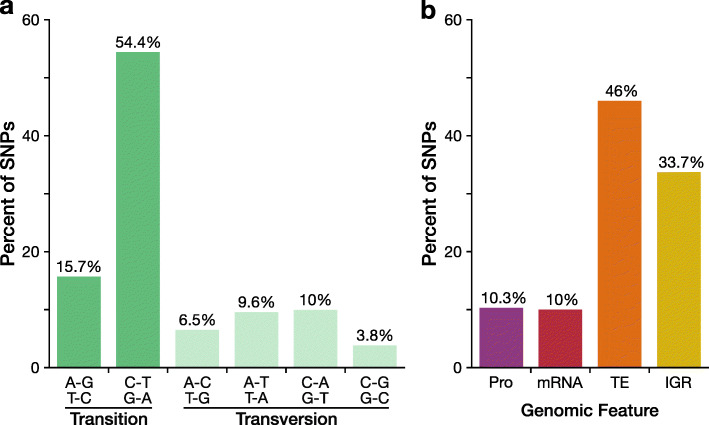
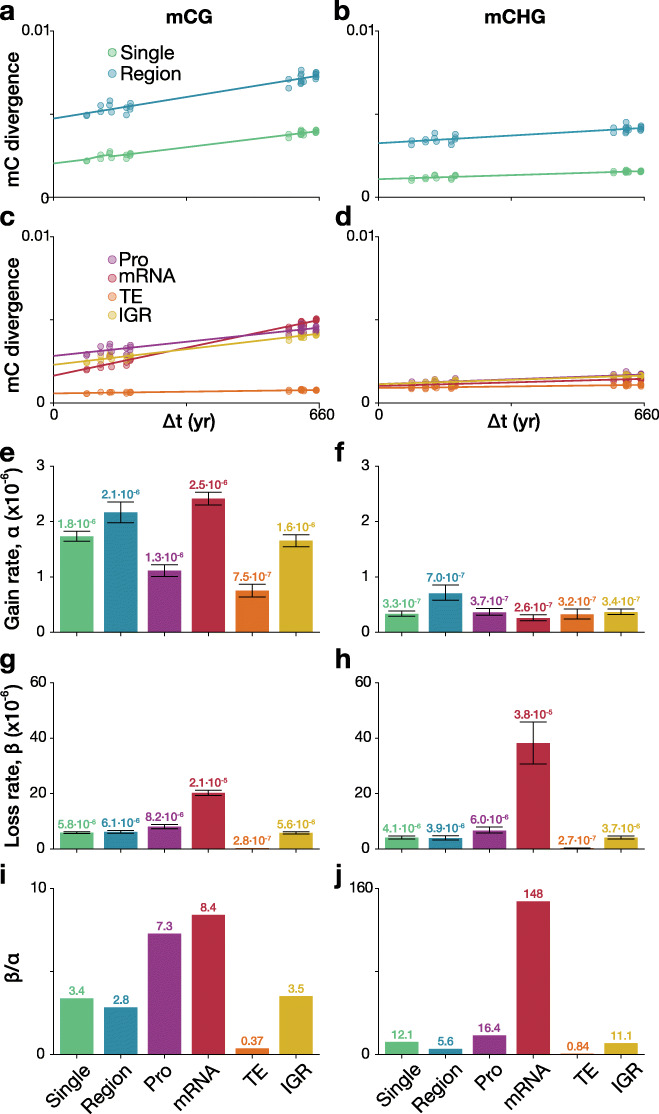
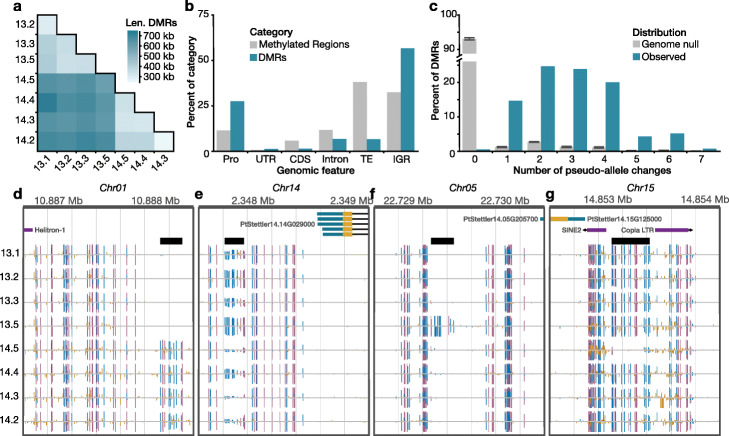
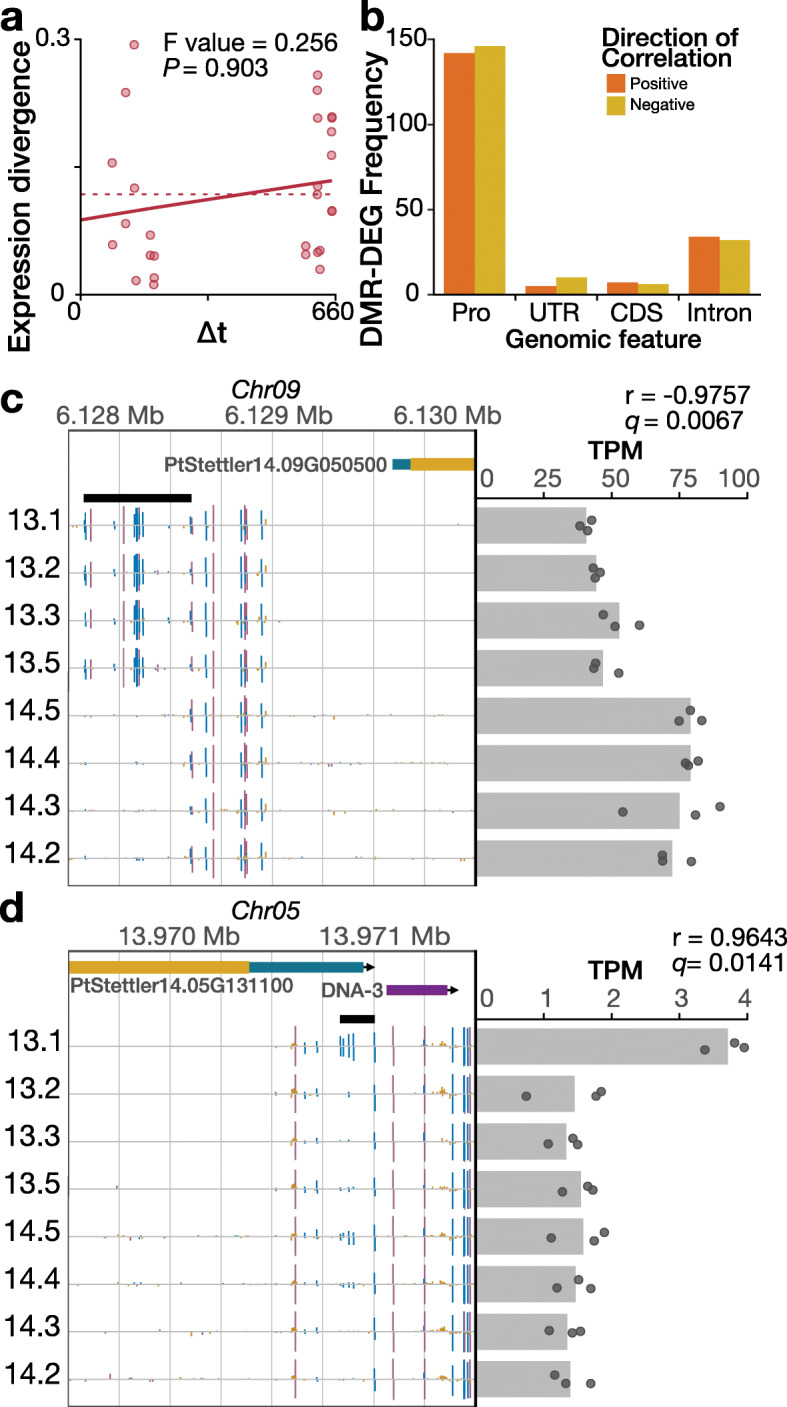
Results: Here, we generate a new high-quality reference genome from the oldest branch of a wild Populus trichocarpa tree with two dominant stems which have been evolving independently for 330 years. By sampling multiple, age-estimated branches of this tree, we use a multi-omics approach to quantify age-related somatic changes at the genetic, epigenetic, and transcriptional level. We show that the per-year somatic mutation and epimutation rates are lower than in annuals and that transcriptional variation is mainly independent of age divergence and cytosine methylation. Furthermore, a detailed analysis of the somatic epimutation spectrum indicates that transgenerationally heritable epimutations originate mainly from DNA methylation maintenance errors during mitotic rather than during meiotic cell divisions.

Conclusion: Taken together, our study provides unprecedented insights into the origin of nucleotide and functional variation in a long-lived perennial plant.

Keywords: DNA methylation; Epigenetics; Epimutation rate; Mutation rate; Poplar.


Conflict of interest statement

The authors declare that they have no competing interests.

Figures

Fig. 1
Fig. 1
Photograph and schematic drawing of tree 13 and tree 14. This wild P. trichocarpa, located near Mt. Hood, Oregon, experienced a decapitation event ~ 300 years ago. Tree 14 re-sprouted from the stump and ~ 80–100 years later tree 13 re-sprouted. a Leaf samples were collected from the labeled terminal branches. b Age was estimated for both the end of the branch (black font) and where it meets the main stem (gray italics). Ages with * indicate age was estimated using diameter; all other estimates were from core samples. Leaf samples of each branch was used to create genomic sequencing libraries, PacBio libraries, whole-genome bisulfite sequencing libraries, and mRNA-sequencing libraries
Fig. 2
Fig. 2
Most somatic mutations are transitions and occur in non-genic regions. a Distribution of reference to alternative allele observed in the high-confidence SNPs identified in tree 13 and tree 14. b Distribution of high-confidence SNPs separated by the genomic feature. See Additional file 2: Table S3 for per-tree distributions. Abbreviations: Pro, promoter (2 kb upstream of TSS); TE, transposable elements and repeats; and IGR, intergenic regions
Fig. 3
Fig. 3
Somatic epimutation rates for single sites, regions, and by genomic feature. mCG (a) and mCHG (b) divergence by branch time divergence for single sites and regions; mCG (c) and mCHG (d) divergence by branch time divergence for genomic features Pro (promoter; 2 kb upstream of TSS), mRNA, TE (transposable elements), and IGR (intergenic regions). The dots show the individual observed divergences, whereas the line represents the fit of the data to the model. Estimated mCG (e) and mCHG (f) gain rates by feature. Estimated mCG (g) and mCHG (h) loss rates by feature. Ratio of mCG (i) and mCHG (j) loss to gain by feature. An F-test was used comparing the neutral model vs null model (Supplementary Text). See Additional file 2: Table S9 for P values. Error bars represent bootstrapped 95% confidence intervals of the estimates. Abbreviations: Pro, promoter; TE, transposable elements and repeats; and IGR, intergenic regions
Fig. 4
Fig. 4
Identification and quantification of somatic stability of differentially methylated regions. a Divergence of differentially methylated regions corresponds to divergence in age. The darker color indicates combined length of the pairwise DMRs. b The genome-wide distribution of identified DMRs in genomic features. Abbreviations: TE, transposable elements and repeats; IGR, intergenic region; Pro, promoter region (2 kb upstream of TSS); UTR, untranslated regions; CDS, coding sequence. Methylated regions were identified in as regions methylated in at least one sample. c There are significantly more pseudo-allele changes between the branches at DMRs (blue) compared to the genome-wide null (Wilcoxon rank sum, one-sided, P value < 2 × 10− 16). Gray bars are the genome-wide null as mean +/− std. dev. across 10 simulations. d Browser screenshot of a tree specific DMR where all branches in tree 13 are homozygous unmethylated and all branches of tree 14 are homozygous methylated. e Browser screenshot of a highly variable DMR where the pseudo-allele state changes between each branch. f Browser screenshot of a single gain DMR where all branches except 13.5 are homozygous unmethylated and 13.5 gains methylation. g Browser screenshot of a single loss DMR where all branches except 14.5 are homozygous methylated and 14.5 has lost methylation. For dg, gene models and transposable elements are shown at the top and methylome tracks are below. Vertical bars indicate methylation at the position, where height corresponds to level and color is context, red for CG, blue for CHG, and yellow for CHH. DMR is indicated by thick black horizontal line
Fig. 5
Fig. 5
Gene expression is largely independent from divergence age and nearby cytosine methylation except in a few examples. a Gene expression divergence is not significantly associated with divergence age. The dots show the individual observed divergences, whereas the line represents the fit of the data to the model. b Distribution of positive and negative correlations for differentially expressed genes and overlapping/nearby DMRs. Positive correlation occurs when the higher methylation level is associated with higher gene expression among the samples. c A significantly negatively correlated, tree-specific DMR and DEG where the DMR occurs in the promoter region of the gene (Pearson’s correlation test, two-sided, N = 8, adjusted P value = 0.0067). The higher methylation levels in the DMR for tree 13 branches are associated with lower gene expression. d A significantly positively correlated, single gain DMR and DEG where the DMR occurs in the 5′ untranslated region of the gene (Pearson’s correlation test, two-sided, N = 8, adjusted P = 0.0141). The higher methylation level in the DMR for branch 13.1 is associated with greater gene expression. For c and d, gene expression, as transcripts per million (TPM), is represented as points for the individual replicates and as bar for mean among replicates. In the genome browser view, gene models and transposable elements are shown at the top and methylome tracks are below. Vertical bars indicate methylation at the position, where height corresponds to level and color is context, red for CG, blue for CHG, and yellow for CHH. DMR is indicated by thick black horizontal line

References

    1. Whitham TG, Slobodchikoff CN. Evolution by individuals, plant-herbivore interactions, and mosaics of genetic variability: the adaptive significance of somatic mutations in plants. Oecologia. 1981;49:287. doi: 10.1007/BF00347587. - DOI - PubMed
    1. Walbot V. On the life strategies of plants and animals. Trends Genet. 1985; 10.1016/0168-9525(85)90071-X.
    1. Gill DE. Individual plants as genetic mosaics: ecological organisms versus evolutionary individuals. In: Crawley MJ, editor. Plant Ecol. Oxford: Blackwell Scientific Publications; 1986. pp. 321–343.
    1. Gill DE, Chao L, Perkins SL, Wolf JB. Genetic mosaicism in plants and clonal animals. Annu Rev Ecol Syst. 1995;26:423–444. doi: 10.1146/annurev.es.26.110195.002231. - DOI
    1. Hadany L. A conflict between two evolutionary levels in trees. J Theor Biol. 2001; 10.1006/jtbi.2000.2236. - PubMed

Publication types