. 2020 Oct 6;12(1):86.
doi: 10.1186/s13073-020-00783-w.

The murine Microenvironment Cell Population counter method to estimate abundance of tissue-infiltrating immune and stromal cell populations in murine samples using gene expression

Affiliations

The murine Microenvironment Cell Population counter method to estimate abundance of tissue-infiltrating immune and stromal cell populations in murine samples using gene expression

Florent Petitprez et al. Genome Med. .

Abstract

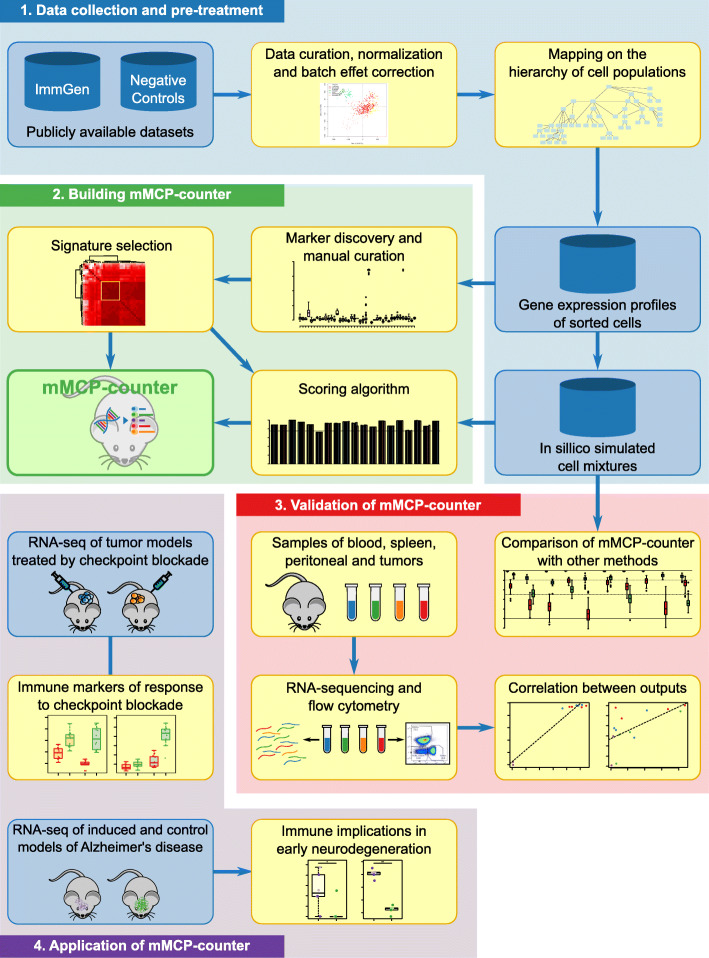
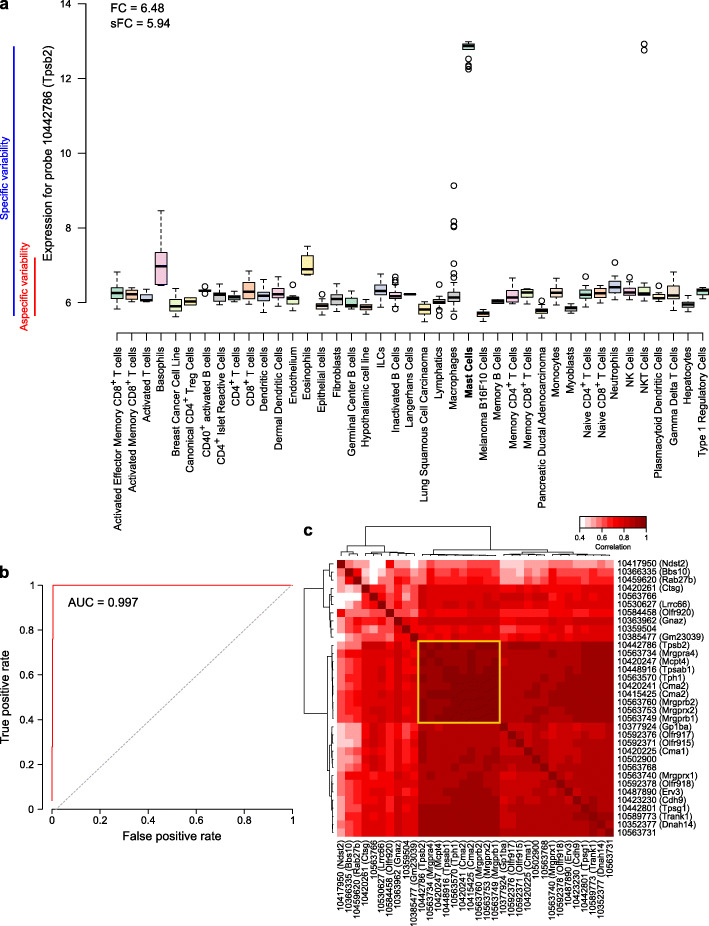
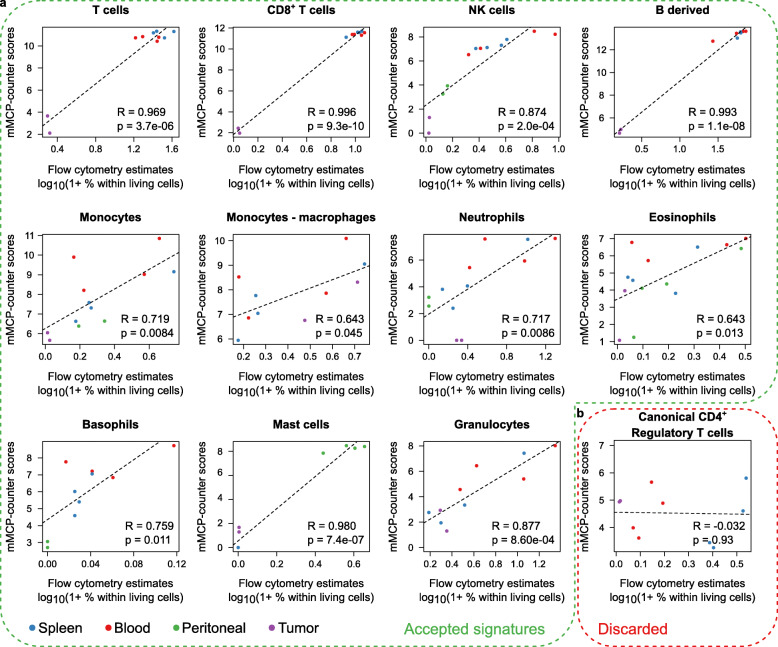
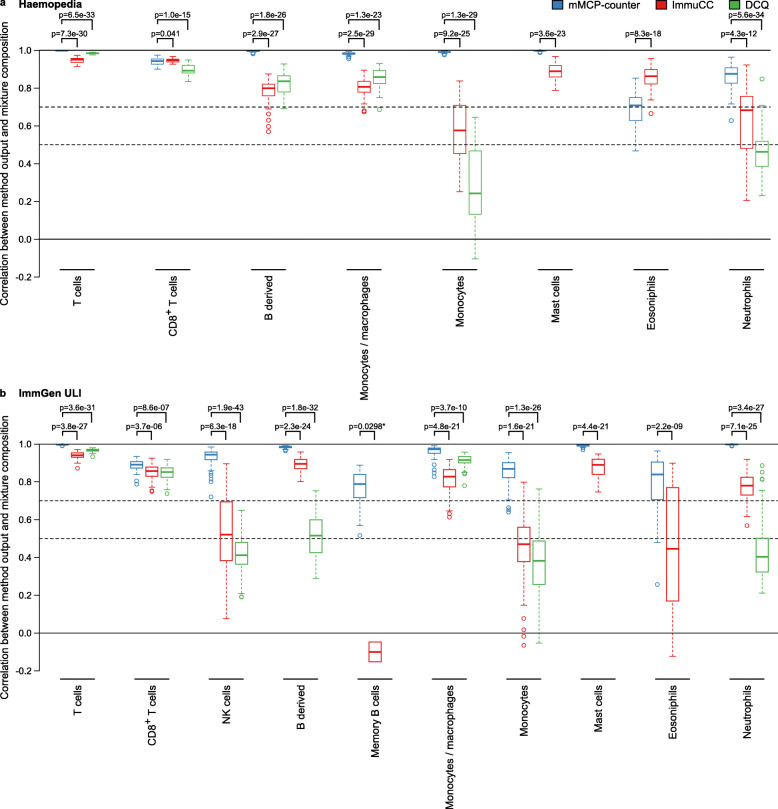
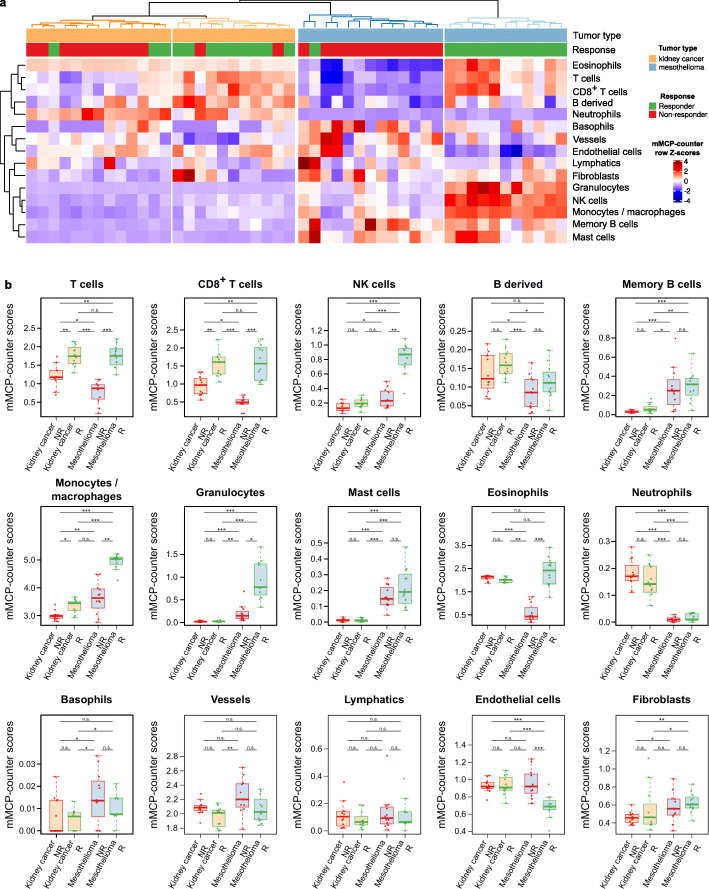
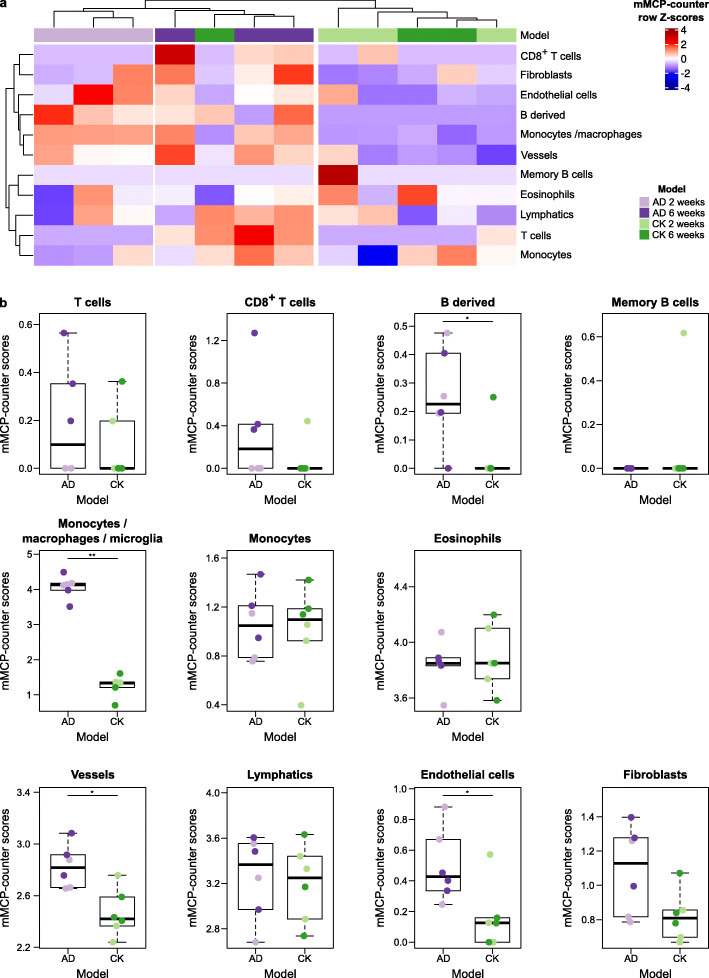
Quantifying tissue-infiltrating immune and stromal cells provides clinically relevant information for various diseases. While numerous methods can quantify immune or stromal cells in human tissue samples from transcriptomic data, few are available for mouse studies. We introduce murine Microenvironment Cell Population counter (mMCP-counter), a method based on highly specific transcriptomic markers that accurately quantify 16 immune and stromal murine cell populations. We validated mMCP-counter with flow cytometry data and showed that mMCP-counter outperforms existing methods. We showed that mMCP-counter scores are predictive of response to immune checkpoint blockade in cancer mouse models and identify early immune impacts of Alzheimer's disease.

Keywords: Alzheimer’s disease; Heterogeneous tissue; Immune checkpoint blockade; Immune composition; Tumor microenvironment.


Conflict of interest statement

WHF is a consultant for Adaptimmune, AstraZeneca, Novartis, Anaveon, Catalym, Oxford Biotherapeutics, OSE immunotherapeutics, Zelluna, and IPSEN. The remaining authors declare that they have no competing interests.

Figures

Fig. 1
Fig. 1
Workflow for the development, validation, and application of mMCP-counter. This figure depicts (1) the data acquisition, pre-processing, and normalization, as well as the mapping the cell population hierarchy; (2) the building of the methods by research and curation of cell-type-specific gene signatures and optimal scoring algorithm; (3) the validation of mMCP-counter by comparison to previously published methods on simulated mixtures and by comparison to immune composition inferred by flow-cytometry; and (4) the illustration of mMCP-counter to two datasets including mouse models of kidney cancer and mesothelioma treated by immune checkpoint blockade, and murine models of early neurodegeneration in Alzheimer’s disease
Fig. 2
Fig. 2
Identification of cell-type-specific gene signatures: example of mast cells. a Expression of a transcriptomic marker (probe 10442786) of mast cells in various cell types, with the representation of the fold-change and the specific fold-change. b Receiver operating characteristic (ROC) curve for the same marker as in a. c Correlation heatmap of all found transcriptomic markers for mast cells. The yellow square indicates the restricted signature that was chosen for the method
Fig. 3
Fig. 3
Validation of mMCP-counter on ex vivo data by comparison to flow cytometry data on n = 14 samples. a Correlation graphs between the flow cytometry estimates (logarithmic scale, expressed in percent of the total of living cells) and the mMCP-counter scores for populations for which the signature was accepted. Each graph corresponds to a different population. The dotted line shows the linear regression model. Correlations are estimated with the Pearson correlation. b Correlation graph for canonical CD4+ regulatory T cells presented as in a. Following this validation step, this signature was discarded
Fig. 4
Fig. 4
Comparison of the performance of mMCP-counter with other published methods. The three methods have been applied to 50 simulated RNA mixture sets, each comprising 50 randomized mixtures, generated from the Haemopedia (a) and ImmGen ULI datasets (b). This graph shows the Pearson correlation between the mixture compositions and the scores returned by the methods for each population on all mixture sets. Full lines indicate correlation equal to 0 and 1. Dashed lines indicate correlations equal to 0.7 and 0.5. An asterisk indicates that for memory B cells, there were only 2 datasets where ImmuCC returned non-all-zero scores and where its performance could therefore be assessed
Fig. 5
Fig. 5
mMCP-counter discriminates between tumor types and between responders and non-responders to immune checkpoint blockade. a Heatmap showing that clustering of tumors on mMCP-counter scores accurately separates tumors based on the tumor type (n = 24 mesothelioma models, n = 24 kidney cancer models, first line) and the response to immune checkpoint blockade (second line, n = 12 responders and n = 12 non-responders for each cancer type). The heatmap illustrates row Z-scores for all included cell populations. b Detailed differences in mMCP-counter scores between responders and non-responders to ICB in both kidney cancer and mesothelioma models. Comparisons are computed using Kruskal-Wallis tests followed by post hoc Dunn test for pairwise comparisons, with Benjamini-Hochberg correction for multiple testing. *p < 0.05, **p < 0.01, ***p < 0.001, n.s. p ≥ 0.05
Fig. 6
Fig. 6
mMCP-counter discriminates between control CK mice and Alzheimer’s disease brain tissues. a Heatmap showing that clustering of samples on mMCP-counter scores accurately separates hippocampus samples from control CK samples and induced Alzheimer’s disease (AD) at different time points (n = 6 AD and n = 6 CK). The heatmap illustrates row Z-scores for all included cell populations. b Detailed differences in mMCP-counter scores between CK and induced AD hippocampus samples. The color code of the individual data points refers to the legend of panel a. Comparisons are computed using Mann-Whitney tests. *p < 0.05, **p < 0.01

References

    1. Petitprez F, Sun C-M, Lacroix L, Sautès-Fridman C, de Reyniès A, Fridman WH. Quantitative analyses of the tumor microenvironment composition and orientation in the era of precision medicine. Front Oncol. 2018;8:390. doi: 10.3389/fonc.2018.00390. - DOI - PMC - PubMed
    1. Fridman WH, Pagès F, Sautès-Fridman C, Galon J. The immune contexture in human tumours: impact on clinical outcome. Nat Rev Cancer. 2012;12:298–306. doi: 10.1038/nrc3245. - DOI - PubMed
    1. Fridman WH, Zitvogel L, Sautès-Fridman C, Kroemer G. The immune contexture in cancer prognosis and treatment. Nat Rev Clin Oncol. 2017;14:717–734. doi: 10.1038/nrclinonc.2017.101. - DOI - PubMed
    1. Becht E, Giraldo NA, Lacroix L, Buttard B, Elarouci N, Petitprez F, et al. Estimating the population abundance of tissue-infiltrating immune and stromal cell populations using gene expression. Genome Biol. 2016;17:218. doi: 10.1186/s13059-016-1070-5. - DOI - PMC - PubMed
    1. Sturm G, Finotello F, Petitprez F, Zhang JD, Baumbach J, Fridman WH, et al. Comprehensive evaluation of transcriptome-based cell-type quantification methods for immuno-oncology. Bioinformatics. 2019;35:i436–i445. doi: 10.1093/bioinformatics/btz363. - DOI - PMC - PubMed

Publication types

MeSH terms

LinkOut - more resources