. 2021 Feb;11(2):480-499.
doi: 10.1158/2159-8290.CD-20-0331. Epub 2020 Oct 6.

The RNA m6A Reader YTHDF2 Maintains Oncogene Expression and Is a Targetable Dependency in Glioblastoma Stem Cells

Affiliations

The RNA m6A Reader YTHDF2 Maintains Oncogene Expression and Is a Targetable Dependency in Glioblastoma Stem Cells

Deobrat Dixit et al. Cancer Discov. 2021 Feb.

Abstract

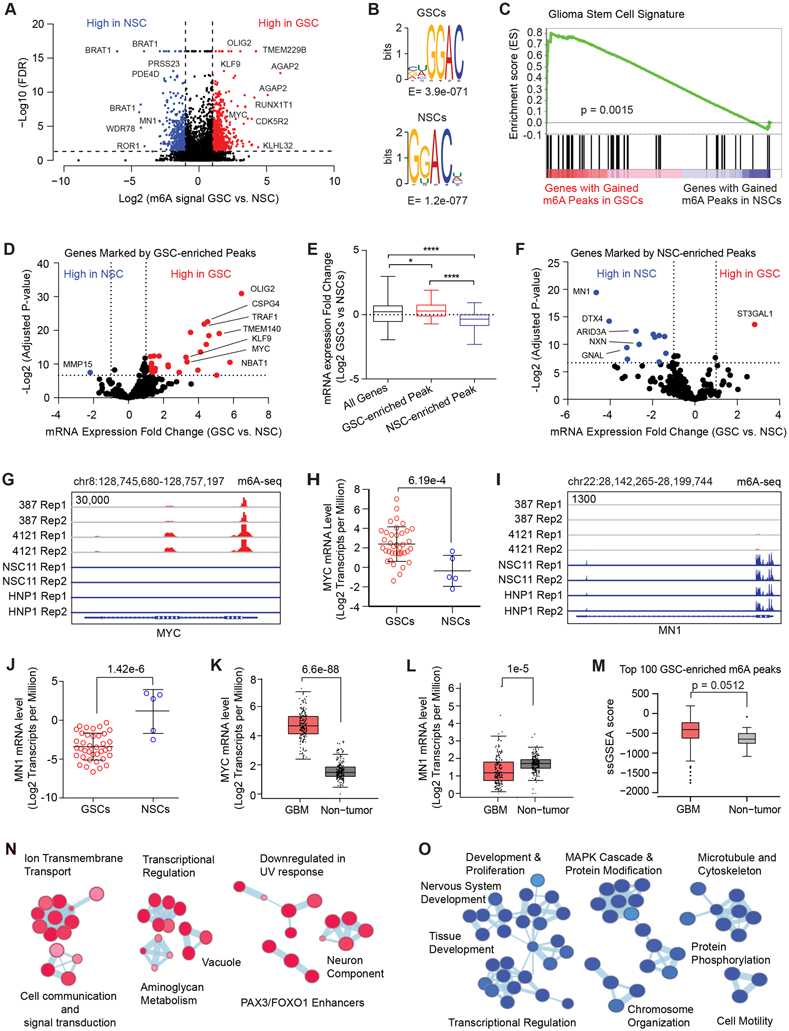
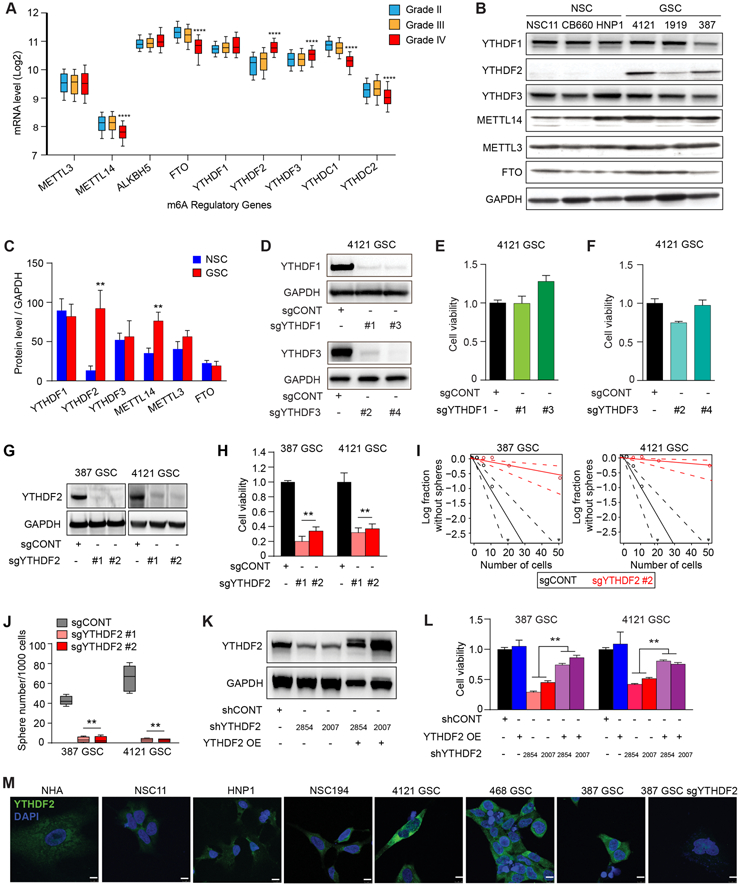
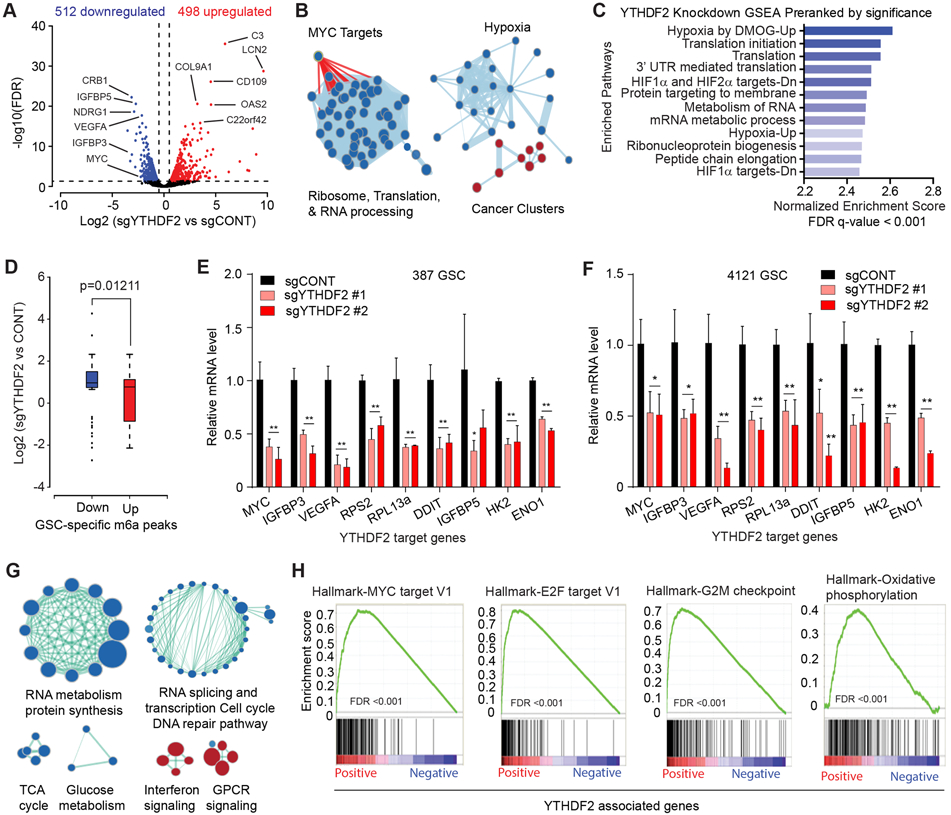
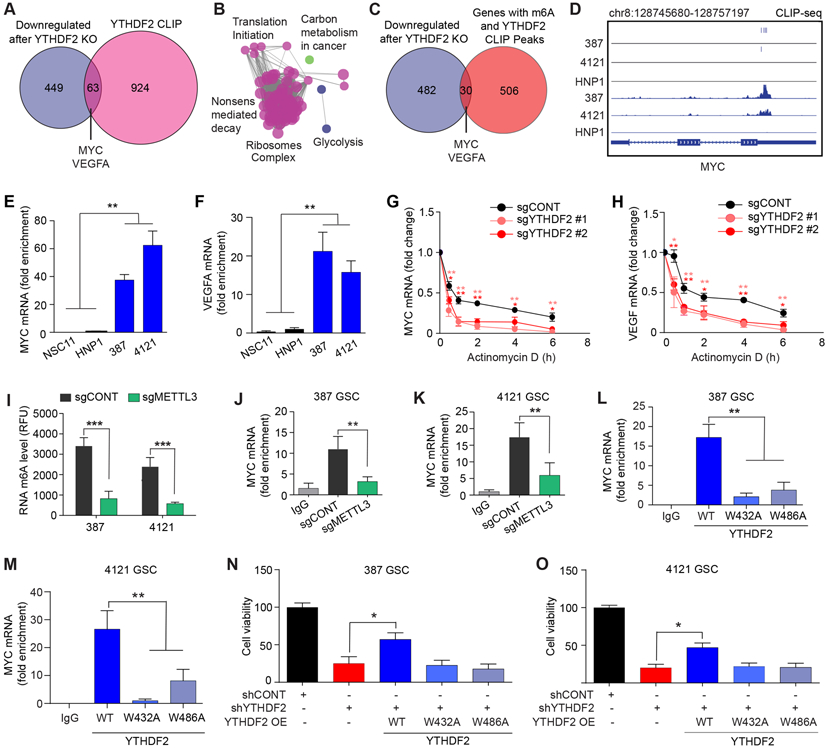
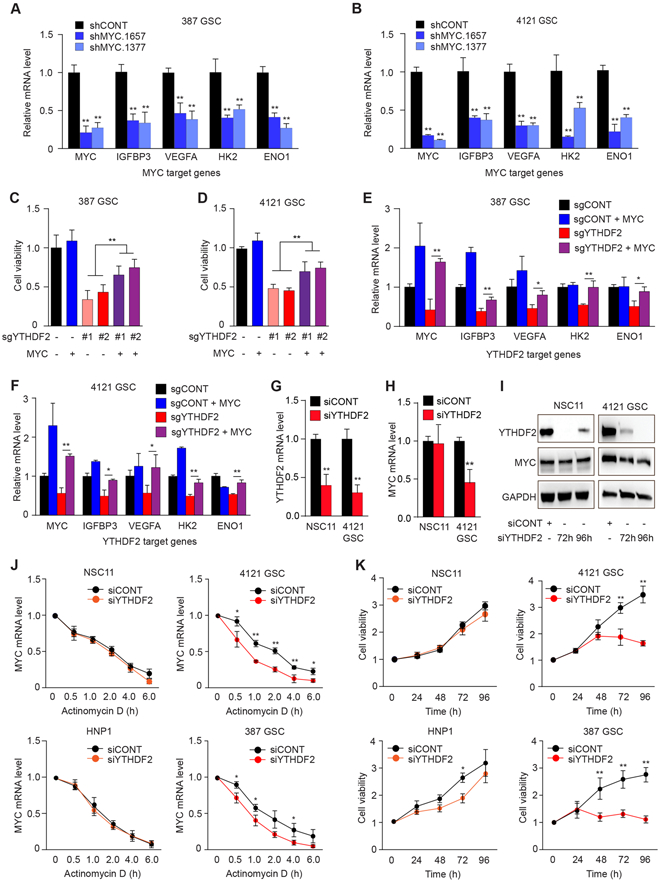
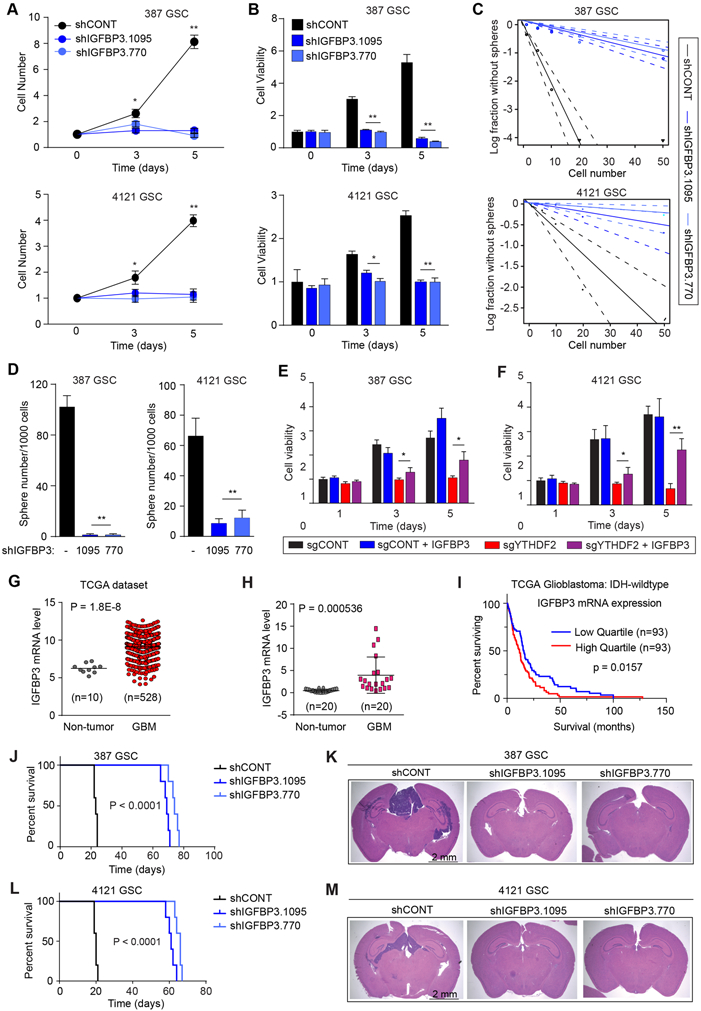
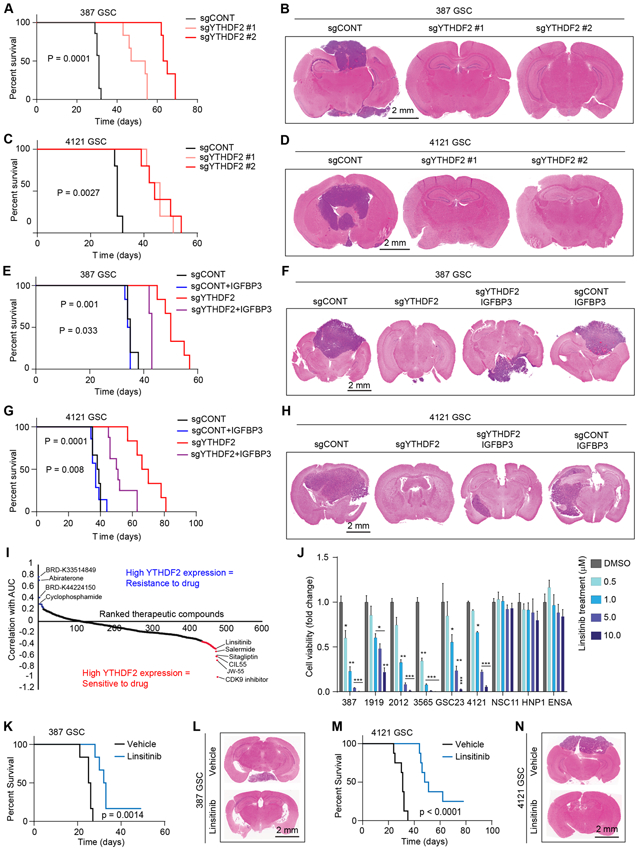
Glioblastoma is a universally lethal cancer driven by glioblastoma stem cells (GSC). Here, we interrogated N 6-methyladenosine (m6A) mRNA modifications in GSCs by methyl RNA immunoprecipitation followed by sequencing and transcriptome analysis, finding transcripts marked by m6A often upregulated compared with normal neural stem cells (NSC). Interrogating m6A regulators, GSCs displayed preferential expression, as well as in vitro and in vivo dependency, of the m6A reader YTHDF2, in contrast to NSCs. Although YTHDF2 has been reported to destabilize mRNAs, YTHDF2 stabilized MYC and VEGFA transcripts in GSCs in an m6A-dependent manner. We identified IGFBP3 as a downstream effector of the YTHDF2-MYC axis in GSCs. The IGF1/IGF1R inhibitor linsitinib preferentially targeted YTHDF2-expressing cells, inhibiting GSC viability without affecting NSCs and impairing in vivo glioblastoma growth. Thus, YTHDF2 links RNA epitranscriptomic modifications and GSC growth, laying the foundation for the YTHDF2-MYC-IGFBP3 axis as a specific and novel therapeutic target in glioblastoma. SIGNIFICANCE: Epitranscriptomics promotes cellular heterogeneity in cancer. RNA m6A landscapes of cancer and NSCs identified cell type-specific dependencies and therapeutic vulnerabilities. The m6A reader YTHDF2 stabilized MYC mRNA specifically in cancer stem cells. Given the challenge of targeting MYC, YTHDF2 presents a therapeutic target to perturb MYC signaling in glioblastoma.This article is highlighted in the In This Issue feature, p. 211.


Conflict of interest statement

Conflict of interest statement: The authors declare no competing financial interests.

Figures

Figure 1:
Figure 1:. Cancer-specific genes, upregulated in glioblastoma stem cells are marked by RNA m6A modification. See also Figure S1.
A, Volcano plot of m6A peaks detected by meRIP-seq in two GSCs and two NSCs. Red dots indicate m6A peaks gained in GSCs while blue dots indicate m6A peaks gained in NSCs. Note that multiple peaks may map to the same gene. B, (Top) Top RNA motif enriched in m6A peaks in GSCs. (Bottom) Top RNA motif enriched in m6A peaks in NSCs. C, Gene set enrichment analysis of genes with GSC-enriched m6A peaks for a “glioma stem cell” signature. D, Volcano plot showing differential mRNA expression fold change between a panel of 38 GSCs and 5 NSCs for genes marked by GSC-enriched m6A peaks. Data was derived from Mack et al. (8). E, Differential mRNA expression fold change between a panel of 38 GSCs and 5 NSCs for all genes, genes marked by GSC-enriched m6A peaks, and genes marked by NSC-enriched m6A peaks. F, Volcano plot showing differential mRNA expression fold change between a panel of 38 GSCs and 5 NSCs for genes marked by NSC-enriched m6A peaks. Data was derived from Mack et al (8). G, m6A signal in two GSCs and two NSCs at the MYC locus. H, MYC mRNA expression (Log2 transcripts per million) in a panel of 38 GSCs and 5 NSCs. The DESeq2 package was used to calculate statistical significance with multiple test correction, p = 6.19e-4. I, m6A signal in two GSCs and two NSCs at the MN1 locus. J, MN1 mRNA expression (Log2 transcripts per million) in a panel of 38 GSCs and 5 NSCs. The DESeq2 package was used to calculate statistical significance with multiple test correction, p = 1.42e-6. K, MYC mRNA expression (Log2 transcripts per million) in a panel of glioblastoma tissue specimens (n = 163) and normal brain samples (n = 207). Four-way analysis of variance (ANOVA), using sex, age, ethnicity and disease state was used to calculate statistical significance, p = 6.6e-88. Data were derived from GEPIA (80). L, MN1 mRNA expression (Log2 transcripts per million) in a panel of glioblastoma tissue specimens (n = 163) and normal brain samples (n = 207). Four-way analysis of variance (ANOVA), using sex, age, ethnicity and disease state was used to calculate statistical significance, p = 1.0e-5. Data were derived from GEPIA (80). M, A single sample gene set enrichment analysis (ssGSEA) score was calculated based on expression of the genes marked with the top 100 m6A peaks in GSCs. The signature score was compared between glioblastoma and non-tumor specimens derived from TCGA datasets. N, Pathway enrichment bubble plot of gene sets enriched among genes marked by GSC-enriched m6A peaks. O, Pathway enrichment bubble plot of gene sets enriched among genes marked by NSC-enriched m6A peaks.
Figure 2.
Figure 2.. The m6A reader YTHFD2 is required for maintenance of glioblastoma stem cells. See also Figure S2.
A, mRNA expression of selected m6A regulatory genes in the TCGA GBM-LGG dataset based on tumor grade. ****, p < 0.0001 for Grade IV vs either Grade II or III. B, Immunoblot assessment of YTHDF1, YTHDF2, YTHDF3, METTL14, METTL3, and FTO protein levels in NSCs and GSCs. GAPDH was used as a loading control. C, Densitometry graphs showing the protein levels of m6A readers, writers and erasers normalized to GAPDH in GSCs compared to NSCs. **, p < 0.01. Error bars show standard deviation. D, Immunoblot showing YTHDF1 and YTHDF3 levels after transduction of GSCs with a control non-targeting sgRNA sequence (sgCONT) or four independent sgRNAs targeting YTHDF1 (sgYTHDF1 #1, and sgYTHDF1 #3) and YTHDF3 (sgYTHDF3 #2 and sgYTHDF3 #4). E and F, Relative cell viability of 4121 GSCs expressing a control non-targeting sgRNA sequence (sgCONT) or two independent sgRNAs targeting YTHDF1 (sgYTHDF1 #1 and sgYTHDF1 #3) and YTHDF3 (sgYTHDF3 #2 and sgYTHDF3 #4). Error bars show standard deviation. G, Immunoblot showing YTHDF2 protein levels after transduction of two GSCs (387 and 4121), with a control non-targeting sgRNA sequence (sgCONT) or two independent sgRNAs targeting YTHDF2 (sgYTHDF2 #1 and sgYTHDF2 #2). H, Cell viability of two patient-derived GSCs (387 and 4121) following transduction with either a non-targeting control sgRNA (sgCONT) or one of two independent, non-overlapping sgRNAs targeting YTHDF2. **, p < 0.01. Error bars show standard deviation. I, Sphere formation using an extreme limiting dilution assay (ELDA) was performed with 387 and 4121 GSCs expressing sgCONT or sgYTHDF2 #2. J, Box plot shoeing the quantification of the number of spheres (per 1,000 cells) formed by GSCs. Data are presented as mean (+/−SEM) from three independent experiments. **, p < 0.01. K, Immunoblots demonstrating the knockdown and overexpression efficiency of YTHDF2 in 4121 GSCs. GAPDH is used as a loading control. L, Cell viability of GSCs transduced with one of two independent, non-overlapping shRNAs against YTHDF2 (shYTHDF2) or control shRNA (shCONT), with or without exogenous YTHDF2 overexpression. **, p < 0.01. Error bars show standard deviation. M, Cellular localization and levels of YTHDF2 in GSCs, NSCs and normal astrocytes as demonstrated by immunofluorescence staining using YTHDF2 antibody. Scale bars: 10 μm.
Figure 3.
Figure 3.. YTHDF2 supports gene expression of important cancer-specific pathways in GSCs. See also Figure S3.
A, Volcano plot of gene expression changes in YTHDF2 knockout vs. control, obtained from 387 and 4121 GSCs. Blue indicates genes downregulated in YTHDF2 knockout at an FDR < 0.05 and log2 fold change < −1. Red indicates genes upregulated following YTHDF2 knockout at an FDR < 0.05 and log2 fold change >1. B, Gene set enrichment analysis of GO pathways enriched or depleted following YTHDF2 knockdown in 387 and 4121 GSCs. Blue indicates enrichment in genes downregulated following YTHDF2 knockdown. Red indicates programs enriched in genes upregulated after YTHDF2 knockdown. C, Gene set enrichment analysis of genes downregulated following YTHDF2 knockdown in 387 and 4121 GSCs. Enriched gene signatures are plotted with normalized enrichment score. D, Boxplot demonstrating changes in gene expression with YTHDF2 knockdown in 387 and 4121 GSCs, compared with m6A differential peaks in GSCs vs. NSCs. The x-axis indicates m6A peaks downregulated (blue) or upregulated (red) in GSCs. The y-axis represents gene expression in YTHDF2 knockdown vs. control. E, Relative mRNA expression of YTHDF2 target genes normalized to 18S mRNA level in 387 GSCs. *, p < 0.05, **, p < 0.01. Error bars show standard deviation. F, Relative mRNA expression of YTHDF2 target genes normalized to 18S mRNA level in 4121 GSCs. *, p < 0.05, **, p < 0.01. Error bars show standard deviation. G, Gene set enrichment analysis of GO pathways positively or negatively correlated with YTHDF2 expression in TCGA dataset. Blue indicates enrichment in programs positively correlated and red indicates programs enriched in negatively correlated genes with YTHDF2 expression. H, Gene set enrichment analysis of Hallmark gene sets using a pre-ranked gene list weighted by correlation of gene expression with YTHDF2 in TCGA.
Figure 4.
Figure 4.. YTHDF2 stabilizes the expression of oncogenes required for survival of GSCs in a m6A dependent manner. See also Figure S4 and S5.
A, Overlap between mRNAs downregulated upon YTHDF2 knockout with mRNAs obtained from cross-linking immunoprecipitation (CLIP) using an anti-YTHDF2 antibody in GSCs. B, ClueGO analysis using Cytoscape to identify enriched pathways using 63 genes from Venn diagram intersection. C, Overlap between mRNAs downregulated in GSCs upon YTHDF2 knockout with mRNAs that both contain m6A modifications (m6A IP) and bind to YTHDF2 (CLIP). D, YTHDF2 binding sites identified and iCLIP signal in 387, 4121 and HNP1 at the MYC locus. E, F, Graphs showing enrichment of (E) MYC, and (F) VEGFA mRNAs in the YTHDF2 immunoprecipitated RNA fraction. **, p < 0.01. Error bars show standard deviation. G, H, Graphs showing changes in the mRNA levels of (G) MYC and (H) VEGFA, at different time points following actinomycin-D treatment in GSCs transduced with sgYTHDF2 #1, sgYTHDF2 #2 or sgCONT. *, p < 0.05 and **, p < 0.01. Error bars show standard deviation. I, Quantification of RNA m6A levels in two patient derived GSCs following knockout of METTL3. **, p < 0.01 and ***, p < 0.001. Error bars show standard deviation. J, K, Graphs showing enrichment of MYC mRNA in the YTHDF2 immunoprecipitated RNA fraction of 387 (J) and 4121 (K) GSCs following knockout of METTL3 or treatment with a non-targeting sgRNA. **, p < 0.01. Error bars show standard deviation. L, M, Graphs showing enrichment of MYC mRNA in the immunoprecipitated RNA fraction of GSCs following overexpression of either wild type (WT) YTHDF2 or m6A binding mutant YTHDF2 (W432A and W486A) in 387 (L) and 4121 (M) GSCs. **, p < 0.01. Error bars show standard deviation. N, O, Cell viability of GSCs transduced with YTHDF2 shRNAs (shYTHDF2) or control, non-targeting shRNA (shCONT), with or without exogenous overexpression of wild type (WT) or m6A binding mutant (W432A and W486A) YTHDF2 in 387 (N) and 4121 (O) GSCs. *, p < 0.05. Error bars show standard deviation.
Figure 5.
Figure 5.. YTHDF2 stabilizes MYC mRNA in GSCs but not in NSCs. See also Figure S6.
A, B, mRNA levels of MYC and MYC target genes (IGFBP3, VEGFA, HK2, and ENO1) assessed by quantitative RT-PCR following MYC knockdown with two, non-overlapping shRNAs or a non-targeting control sequence in (A) 387 and (B) 4121 GSCs. *, p<0.05, **, p < 0.01. Error bars show standard deviation. C and D, Cell viability measured in sgYTHDF2 #1-, sgYTHDF2 #2- or sgCONT-transduced GSCs in the presence or absence of MYC overexpression. **, p < 0.01. Error bars show standard deviation. E and F, Relative mRNA levels of YTHDF2 target genes normalized to 18S mRNA levels in GSCs transduced with sgYTHDF2 #2 or sgCONT, in the presence or absence of exogenous MYC overexpression. *, p < 0.05, **, p < 0.01. Error bars show standard deviation. G and H, Relative YTHDF2 and MYC mRNA level normalized to 18S mRNA levels in NSC11 and 4121 GSCs transfected with siRNA against YTHDF2 (siYTHDF2) or scrambled control siRNA (siCONT).**, p < 0.01. Error bars show standard deviation. I, Representative western blots showing the protein levels of YTHDF2 and MYC normalized to GAPDH level in NSC11 and 4121 GSCs transfected with siYTHDF2 or siCONT at 72 hours and 96 hours post transfection. J, MYC mRNA assessed over a time course following actinomycin-D treatment in siYTHDF2- or siCONT-transduced NSCs and GSCs. K, Cell viability of NSCs and GSCs transfected with siYTHDF2 or siCONT over a time course up to 96 hours post-transfection. *, p < 0.05, **, p < 0.01. Error bars show standard deviation.
Figure 6.
Figure 6.. The YTHDF2-MYC axis regulates viability of GSCs through IGFBP3. See also Figures S7.
A, Growth of 387 and 4121 GSCs expressing shCONT, shIGFBP3.1095 or shIGFBP3.770 as measured by direct cell count (fold change). **, p < 0.01. Error bars show standard deviation. B, Cell viability of 387 and 4121 GSCs over 5 days post-transduction with shCONT, shIGFBP3.1095 or shIGFBP3.770, as measured by CellTiter-Glo reagent. **, p < 0.01. Error bars show standard deviation. C, Sphere formation using an extreme limiting dilution assay (ELDA) was performed with 387 and 4121 GSCs expressing shCONT, shIGFBP3.1095 or shIGFBP3.770. D, Quantification of the number of spheres (per 1,000 cells) formed by 387 and 4121 GSCs following transduction with shCONT, shIGFBP3.1095 or shIGFBP3.770. **, p < 0.01. Error bars show standard deviation. E and F, Cell viability of sgYTHDF2- or sgCONT-transduced GSCs, in the presence or absence of IGFBP3 overexpression, up to 5 days post-transduction. **, p < 0.01. Error bars show standard deviation. G, mRNA expression of IGFBP3 in normal brain (n=10) and glioblastoma tissues (n=528) derived from the TCGA glioblastoma dataset. H, qRT-PCR quantification of IGFBP3 mRNA levels in glioblastoma and normal brain tissue. I, Kaplan-Meier curve showing patient survival based on IGFBP3 mRNA expression in IDH-wildtype glioblastoma patients from the TCGA dataset, p = 0.0157. J, Kaplan-Meier survival curves of immunocompromised mice bearing intracranial 387 GSC transduced with shCONT, shIGFBP3.1095 or shIGFBP3.770. K, Representative images of hematoxylin and eosin-stained sections of tumor-bearing brains. Tumors were derived from 387 GSC transduced with shIGFBP3.1095, shIGFBP3.770 or shCONT. Brains were harvested after the presentation of first neurological sign in any cohort. Scale bar: 2 mm. L, Kaplan-Meier survival curves of immunocompromised mice bearing intracranial 4121 GSC transduced with shCONT, shIGFBP3.1095 or shIGFBP3.770. M, Representative images of hematoxylin and eosin-stained sections of tumor-bearing brains. Tumors were derived from 4121 GSC transduced with shIGFBP3.1095, shIGFBP3.770 or shCONT. Brains were harvested after the presentation of first neurological sign in any cohort. Scale bar: 2 mm.
Figure 7.
Figure 7.. YTHDF2-MYC-IGFBP3 axis promotes in vivo tumor growth and has therapeutic potential in GSCs. See also Figure S8 and S9.
A, Kaplan-Meier survival curves of immunocompromised mice bearing intracranial 387 GSC transduced with sgCONT, sgYTHDF2 #1 or sgYTHDF2 #2. B, Representative images of hematoxylin and eosin-stained sections of tumor-bearing brains. Tumors were derived from 387 GSC transduced with sgYTHDF2#1, sgYTHDF2#2 or sgCONT. Brains were harvested after the appearance of first neurological sign in any cohort. Scale bar: 2 mm. C, Kaplan-Meier survival curves of immunocompromised mice bearing intracranial 4121 GSC transduced with sgCONT, sgYTHDF2 #1 or sgYTHDF2 #2. D, Representative images of hematoxylin and eosin-stained sections of tumor-bearing brains. Tumors were derived from 4121 GSC transduced with sgYTHDF2#1, sgYTHDF2#2 or sgCONT. Brains were harvested after the appearance of first neurological sign in any cohort. Scale bar: 2 mm. E, Kaplan-Meier survival curves of immunocompromised mice bearing intracranial 387 GSC transduced with sgYTHDF2 or sgCONT, in the presence or absence of IGFBP3 overexpression. F, Representative images of hematoxylin and eosin-stained sections of tumor-bearing brains. Tumors were derived from 387 GSC transduced with sgYTHDF2 or sgCONT, in the presence or absence of IGFBP3 overexpression. Brains were harvested after the presentation of first neurological sign in any cohort. Scale bar: 2 mm. G, Kaplan-Meier survival curves of immunocompromised mice bearing intracranial 4121 GSC transduced with sgYTHDF2 or sgCONT, in the presence or absence of IGFBP3 overexpression. H, Representative images of hematoxylin and eosin-stained sections of tumor-bearing brains. Tumors were derived from 4121 GSC transduced with sgYTHDF2 or sgCONT, in the presence or absence of IGFBP3 overexpression. Brains were harvested after the presentation of first neurological sign in any cohort. Scale bar: 2 mm. I, Therapeutic efficacy prediction of all drugs in brain cancer cells in the CTRP dataset based on mRNA expression of YTHDF2. Plot shows ranked therapeutic compounds based on correlation between YTHDF2 expression and area under the curve (AUC) of each drug. J, Cell viability of five patient-derived GSCs (387, 1919, 2012, 3565, GSC23 and 4121) and three NSCs (NSC11, HNP1 and ENSA) following a five day treatment of vehicle control (DMSO) and various concentrations of linsitinib. *, p < 0.05, **, p < 0.01, ***, p < 0.001, Error bars show standard deviation. K, Kaplan-Meier survival curves of immunocompromised mice bearing intracranial 387 GSC, which received orally, vehicle or linsitinib (50 mg/kg body weight). L, Representative images of hematoxylin and eosin-stained sections of tumor-bearing brains. Brains were harvested after the presentation of first neurological sign in any cohort. Tumors were derived from 387 GSC and mice were treated orally with either vehicle or linsitinib (50 mg/kg body weight). Scale bar: 2 mm. M, Kaplan-Meier survival curves of immunocompromised mice bearing intracranial 4121 GSC, which received orally, vehicle or linsitinib (50 mg/kg body weight). N, Representative images of hematoxylin and eosin-stained sections of tumor-bearing brains. Brains were harvested after the presentation of first neurological sign in any cohort. Tumors were derived from 4121 GSC and mice were treated orally with either vehicle or linsitinib (50 mg/kg body weight). Scale bar: 2 mm.

Similar articles

Cited by

References

    1. Ceccarelli M, Barthel FP, Malta TM, Sabedot TS, Salama SR, Murray BA, et al. Molecular Profiling Reveals Biologically Discrete Subsets and Pathways of Progression in Diffuse Glioma. Cell 2016;164(3):550–63 doi 10.1016/j.cell.2015.12.028. - DOI - PMC - PubMed
    1. Chen J, McKay RM, Parada LF. Malignant glioma: lessons from genomics, mouse models, and stem cells. Cell 2012;149(1):36–47 doi 10.1016/j.cell.2012.03.009. - DOI - PMC - PubMed
    1. Bao S, Wu Q, McLendon RE, Hao Y, Shi Q, Hjelmeland AB, et al. Glioma stem cells promote radioresistance by preferential activation of the DNA damage response. Nature 2006;444(7120):756–60 doi 10.1038/nature05236. - DOI - PubMed
    1. Singh SK, Clarke ID, Terasaki M, Bonn VE, Hawkins C, Squire J, et al. Identification of a cancer stem cell in human brain tumors. Cancer research 2003;63(18):5821–8. - PubMed
    1. Zhou BB, Zhang H, Damelin M, Geles KG, Grindley JC, Dirks PB. Tumour-initiating cells: challenges and opportunities for anticancer drug discovery. Nature reviews Drug discovery 2009;8(10):806–23 doi 10.1038/nrd2137. - DOI - PubMed

Publication types

MeSH terms