. 2020 Dec 11;295(50):17071-17082.
doi: 10.1074/jbc.RA120.014271. Epub 2020 Oct 6.

Fluctuation in O-GlcNAcylation inactivates STIM1 to reduce store-operated calcium ion entry via down-regulation of Ser621 phosphorylation

Affiliations

Fluctuation in O-GlcNAcylation inactivates STIM1 to reduce store-operated calcium ion entry via down-regulation of Ser621 phosphorylation

Atsuo Nomura et al. J Biol Chem. .

Abstract

Stromal interaction molecule 1 (STIM1) plays a pivotal role in store-operated Ca2+ entry (SOCE), an essential mechanism in cellular calcium signaling and in maintaining cellular calcium balance. Because O-GlcNAcylation plays pivotal roles in various cellular function, we examined the effect of fluctuation in STIM1 O-GlcNAcylation on SOCE activity. We found that both increase and decrease in STIM1 O-GlcNAcylation impaired SOCE activity. To determine the molecular basis, we established STIM1-knockout HEK293 (STIM1-KO-HEK) cells using the CRISPR/Cas9 system and transfected STIM1 WT (STIM1-KO-WT-HEK), S621A (STIM1-KO-S621A-HEK), or T626A (STIM1-KO-T626A-HEK) cells. Using these cells, we examined the possible O-GlcNAcylation sites of STIM1 to determine whether the sites were O-GlcNAcylated. Co-immunoprecipitation analysis revealed that Ser621 and Thr626 were O-GlcNAcylated and that Thr626 was O-GlcNAcylated in the steady state but Ser621 was not. The SOCE activity in STIM1-KO-S621A-HEK and STIM1-KO-T626A-HEK cells was lower than that in STIM1-KO-WT-HEK cells because of reduced phosphorylation at Ser621 Treatment with the O-GlcNAcase inhibitor Thiamet G or O-GlcNAc transferase (OGT) transfection, which increases O-GlcNAcylation, reduced SOCE activity, whereas treatment with the OGT inhibitor ST045849 or siOGT transfection, which decreases O-GlcNAcylation, also reduced SOCE activity. Decrease in SOCE activity due to increase and decrease in O-GlcNAcylation was attributable to reduced phosphorylation at Ser621 These data suggest that both decrease in O-GlcNAcylation at Thr626 and increase in O-GlcNAcylation at Ser621 in STIM1 lead to impairment of SOCE activity through decrease in Ser621 phosphorylation. Targeting STIM1 O-GlcNAcylation could provide a promising treatment option for the related diseases, such as neurodegenerative diseases.

Keywords: O-GlcNAcylation; O-linked N-acetylglucosamine (O-GlcNAc) transferase (OGT); calcium; phosphorylation; protein phosphorylation; store-operated Ca2+ entry; store-operated calcium entry (SOCE); stromal interaction molecule 1 (STIM1).


Conflict of interest statement

Conflict of interest—The authors declare that they have no conflicts of interest with the contents of this article.

Figures
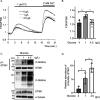
Figure 1.
Figure 1.
Effects of exposure to low (0 g/liter), normal (1 g/liter), and high (4.5 g/liter) doses of glucose on SOCE activity. A, HEK293 cells were treated with different glucose concentrations for 48 h, and the SOCE activity was measured with 1 μm TG treatment. The black, gray, and light gray lines indicate the low glucose–, normal glucose–, and high glucose–treated groups, respectively. B, the peak SOCE activity in HEK293 cells after Ca2+ addition was evaluated from the experiments, as shown in A. Dots, data points. The data were analyzed by using one-way ANOVA followed by Tukey's test (n = 30–40 cells). *, p < 0.05. C, O-GlcNAc and STIM1 expression levels for HEK293 cells treated with different glucose concentrations. O-GlcNAcylation of endogenous STIM1 for HEK293 cells treated with different glucose concentrations was examined using immunoprecipitation assays. α-Tubulin served as the loading control. D, relative abundance of O-GlcNAcylated STIM1 was quantified as shown in C. The data were analyzed using one-way ANOVA followed by Tukey's test. Data are represented as mean ± S.D. values (error bars) (n = 3). *, p < 0.05. TG, a SOCE inducer (a SERCA inhibitor).
Figure 2.
Figure 2.
Dual role played by STIM1 O-GlcNAcylation in SOCE activity. A, C, E, and G, STIM1-KO-HEK cells transfected with the STIM1-mKATE-WT plasmid were treated with 10 μm TMG (gray line) or DMSO (black line) as a solvent control (A), 50 μm OGT inhibitor ST045849 (gray line) or DMSO (black line) (C), the OGT plasmid (gray line) or mock control (black line) (E), or siOGT (gray line) or siControl (black line) (G) for 24–48 h before the experiments. Subsequently, the SOCE activity was measured. B, D, F, and H, peak SOCE activity in HEK293 cells after Ca2+ addition, which was evaluated from the results shown in A, C, E, and G, respectively. Dots, data points. The data were analyzed using the F-test followed by Student's t test. Data are represented as mean ± S.D. values (error bars) (n = 30–40 cells). *, p < 0.05.
Figure 3.
Figure 3.
Effects of OGT overexpression or OGT deficiency on the phosphorylation of STIM1 at ERK1/2 target sites. A, STIM1-KO-HEK cells cotransfected with mock/STIM1-mKATE-WT or OGT/STIM1-mKATE-WT plasmids were treated with 1 μm TG for 30 min. The cell lysates were subjected to Western blotting analyses with antibodies against OGT, O-GlcNAc, phospho-Ser575-STIM1, phospho-Ser608-STIM1, phospho-Ser621-STIM1, and total-STIM1. α-Tubulin served as the loading control. B, relative abundance of STIM1 phosphorylation at Ser575, Ser608, and Ser621 in relation to total STIM1 was quantified as shown in A, and the control levels (Mock) were set at 1.0. Dots, data points. The data were analyzed using one-way ANOVA, followed by Tukey's test. Data are represented as mean ± S.D. values (error bars) (n = 3). *, p < 0.05. C, STIM1-KO-HEK cells cotransfected with siControl/STIM1-mKATE-WT or siOGT/STIM1-mKATE-WT plasmids were treated with 1 μm TG for 30 min. The cell lysates were subjected to Western blotting analyses using antibodies against OGT, O-GlcNAc, phospho-Ser575-STIM1, phospho-Ser608-STIM1, phospho-Ser621-STIM1, and total-STIM1. α-Tubulin served as the loading control. D, relative abundance of STIM1 phosphorylation at Ser575, Ser608, and Ser621 in relation to total STIM1 was quantified as shown in C, and the control levels (siControl) were set at 1.0. Dots, data points. The data were analyzed using one-way ANOVA, followed by Tukey's test. Data are represented as mean ± S.D. values (n = 3). *, p < 0.05. E, relative abundance of OGT in siOGT-transfected cells was quantified after normalization to the loading control, α-tubulin, as shown in A, and the control levels (siControl) were set at 1.0. The data were analyzed using the F-test followed by Student's t test. Data are represented as mean ± S.D. values (error bars) (n = 3). *, p < 0.05.
Figure 4.
Figure 4.
Identification of potential O-GlcNAcylated sites within the Ser/Pro-rich domain of STIM1. A, schematic illustration of the STIM1 domains. The potential O-GlcNAcylation sites (Ser621 and Thr626) on the STIM1 Ser/Pro-rich domain are shown by black arrowheads. The ERK1/2 target sites (Ser575, Ser608, and Ser621) are shown by white arrowheads. EF, EF-hand; SAM, sterile α motif; TM, transmembrane; SOAR, STIM-Orai–activated region; S/P, serine/proline-rich; TRIP, threonine-arginine-isoleucine-proline region. B, STIM1-KO-HEK cells cotransfected with STIM1-mKATE-WT, STIM1-mKATE-S621A, STIM1-mKATE-T626A, or STIM1-mKATE-S621A/T626A—with or without siOGT—were incubated for 48 h at 37 °C. The cell lysates were subjected to co-immunoprecipitation with anti-STIM1 antibody. The OGT, O-GlcNAc, and STIM1 expression levels in the cell lysates, and the O-GlcNAc and STIM1 expression levels in the immunoprecipitates were then determined by Western blotting analyses performed using OGT, O-GlcNAc, and STIM1 antibodies. α-Tubulin served as the loading control. C, relative abundance of O-GlcNAcylated STIM1 was quantified as shown in B. Dots, data points. The data were analyzed using one-way ANOVA followed by Tukey's test. Data are represented as mean ± S.D. values (error bars) (n = 3). *, p < 0.05. D, STIM1-KO-HEK cells cotransfected with STIM1-mKATE-WT, STIM1-mKATE-S621A, STIM1-mKATE-T626A, or STIM1-mKATE-S621A/T626A—with or without TMG—were incubated for 48 h at 37 °C. The cell lysates were subjected to co-immunoprecipitation with anti-STIM1 antibody. The O-GlcNAc, STIM1, and phospho-Ser621-STIM1 expression levels in the cell lysates and the O-GlcNAc and STIM1 expression levels in the immunoprecipitates were then determined by Western blotting analyses performed using O-GlcNAc, STIM1 and phospho-Ser621-STIM1 antibodies, respectively. GAPDH served as the loading control. E, relative abundance of O-GlcNAcylated STIM1 was quantified as shown in D. Dots, data points. The data were analyzed using one-way ANOVA followed by Tukey's test. Data are represented as mean ± S.D. values (n = 3). *, p < 0.05. F, relative abundance of phosphorylated STIM1 at Ser621 in relation to total STIM1 was quantified as shown in D, and the control levels (WT with TMG) were set at 1.0. Dots, data points. The data were analyzed using one-way ANOVA, followed by Tukey's test. Data are represented as mean ± S.D. values (n = 3). *, p < 0.05.
Figure 5.
Figure 5.
Effects of non-O-GlcNAcylation of the STIM1 Ser/Pro-rich domain on SOCE activity. A, STIM1-KO-HEK cells transfected with the STIM1-mKATE-WT, STIM1-mKATE-S621A, or STIM1-mKATE-T626A plasmids were incubated at 37 °C for 48 h, and the SOCE activity was measured. The black, gray, and light gray lines indicate STIM1-mKATE-WT–, STIM1-mKATE-S621A–, and STIM1-mKATE-T626A–transfected cells, respectively. B, peak SOCE activity in each cell type after Ca2+ addition was evaluated from the results shown in A. Dots, data points. The data were analyzed using one-way ANOVA followed by Tukey's test (n = 30–40 cells). *, p < 0.05. C, STIM1-KO-HEK293 cells transfected with the STIM1-mKATE-T626A plasmid were incubated with or without 5 μm TMG for 48 h at 37 °C, and the SOCE activity was measured. Black and gray lines indicate DMSO- and TMG-treated cells, respectively. D, peak SOCE activity in each cell type after Ca2+ addition, as evaluated from the results shown in C. Dots, data points. The data were analyzed using one-way ANOVA followed by Tukey's test (n = 30–40 cells). *, p < 0.05. E, STIM1-KO-HEK cells transfected with the STIM1-mKATE-WT, STIM1-mKATE-T626A, STIM1-mKATE-S575E/T626A, STIM1-mKATE-S608E/T626A, or STIM1-mKATE-S621E/T626A plasmids were incubated at 37 °C for 48 h, and the SOCE activity was measured. Black, deep gray, dark gray, gray, and light gray lines indicate STIM1-mKATE-WT–, STIM1-mKATE-T626A–, STIM1-mKATE-S575E/T626A–, STIM1-mKATE-S608E/T626A–, and STIM1-mKATE-S621E/T626A–transfected cells, respectively. F, peak SOCE activity in each cell type after Ca2+ addition, evaluated from the results shown in E. Dots, data points. The data were analyzed using one-way ANOVA followed by Tukey's test (n = 30–40 cells). *, p < 0.05.
Figure 6.
Figure 6.
Effects of non-O-GlcNAcylation of the STIM1 Ser/Pro-rich domain on puncta formation of STIM1. A, B, and C, STIM1-KO-HEK cells transfected with STIM1-mKATE-WT, STIM1-mKATE-S621A, or STIM1-mKATE-T626A plasmids were incubated at 37 °C for 48 h—with or without 10 μm TMG—and the cells were treated with 1 μm TG for 10 min, fixed, and stained with anti-STIM1 antibody. Representative images of the cells are shown (n = 10–15 cells). Scale bar, 20 μm.
Figure 7.
Figure 7.
Effects of non-O-GlcNAcylation of the STIM1 Ser/Pro-rich domain on interaction of STIM1 with EB1 and Orai1. A, STIM1-KO cells transfected with the STIM1-mKATE-WT, STIM1-mKATE-S621A, or STIM1-mKATE-T626A plasmids were grown with 5 μm TMG for 24 h and treated with 1 μm TG for another 30 min. The cell lysates were subjected to co-immunoprecipitation with the anti-STIM1 antibody. The EB1, STIM1, and O-GlcNAc expression levels in the cell lysates and the EB1, Orai1, and STIM1 expression levels in immunoprecipitates were then determined by Western blotting analyses. α-Tubulin served as the loading control. B, relative abundance of co-precipitated EB1 was quantified as shown in A. Dots, data points. The data were analyzed using one-way ANOVA followed by Tukey's test. Data are represented as mean ± S.D. values (error bars) (n = 3). *, p < 0.05. C, relative abundance of co-precipitated Orai1 was quantified as shown in A. Dots, data points. The data were analyzed using one-way ANOVA followed by Tukey's test. Data are represented as mean ± S.D. values (error bars) (n = 3). *, p < 0.05.
Figure 8.
Figure 8.
Cartoon of the proposed mechanism by which SOCE function is regulated by fluctuation in STIM1 O-GlcNAcylation. At a normal O-GlcNAc level, STIM1 is dissociated from EB1 and interacts with Orai1 to induce SOCE activation by ER Ca2+ depletion because of O-GlcNAcylation at the Thr626 residue of STIM1, which promotes Ser621 phosphorylation. At a low O-GlcNAc level, the ER Ca2+ depletion–induced dissociation of STIM1 from EB1 and interaction with Orai1 are reduced because of decreased O-GlcNAcylation at the Thr626 residue of STIM1. At a high O-GlcNAc level, the ER Ca2+ depletion–induced dissociation of STIM1 from EB1 and interaction with Orai1 are decreased because of increased O-GlcNAcylation at the Ser621 residue of STIM1, which competes with Ser621 phosphorylation.

Similar articles

Cited by

References

    1. Holt, G. D., Haltiwanger, R. S., Torres, C. R., and Hart, G. W. (1987) Erythrocytes contain cytoplasmic glycoproteins: O-linked GlcNAc on Band 4.1. J. Biol. Chem. 262, 14847–14850 - PubMed
    1. Hart, G. W., Housley, M. P., and Slawson, C. (2007) Cycling of O-linked β-N-acetylglucosamine on nucleocytoplasmic proteins. Nature 446, 1017–1022 10.1038/nature05815 - DOI - PubMed
    1. Zachara, N. E., O'Donnell, N., Cheung, W. D., Mercer, J. J., Marth, J. D., and Hart, G. W. (2004) Dynamic O-GlcNAc modification of nucleocytoplasmic proteins in response to stress: a survival response of mammalian cells. J. Biol. Chem. 279, 30133–30142 10.1074/jbc.M403773200 - DOI - PubMed
    1. McClain, D. A. (2002) Hexosamines as mediators of nutrient sensing and regulation in diabetes. J. Diabetes Complications 16, 72–80 10.1016/S1056-8727(01)00188-X - DOI - PubMed
    1. Gao, Y., Wells, L., Comer, F. I., Parker, G. J., and Hart, G. W. (2001) Dynamic O-glycosylation of nuclear and cytosolic proteins: cloning and characterization of a neutral, cytosolic β-N-acetylglucosaminidase from human brain. J. Biol. Chem. 276, 9838–9845 10.1074/jbc.M010420200 - DOI - PubMed

Publication types