. 2020 Dec 3;10(12):4553-4563.
doi: 10.1534/g3.120.401824.

A Novel Mapping Strategy Utilizing Mouse Chromosome Substitution Strains Identifies Multiple Epistatic Interactions That Regulate Complex Traits

Affiliations

A Novel Mapping Strategy Utilizing Mouse Chromosome Substitution Strains Identifies Multiple Epistatic Interactions That Regulate Complex Traits

Anna K Miller et al. G3 (Bethesda). .

Abstract

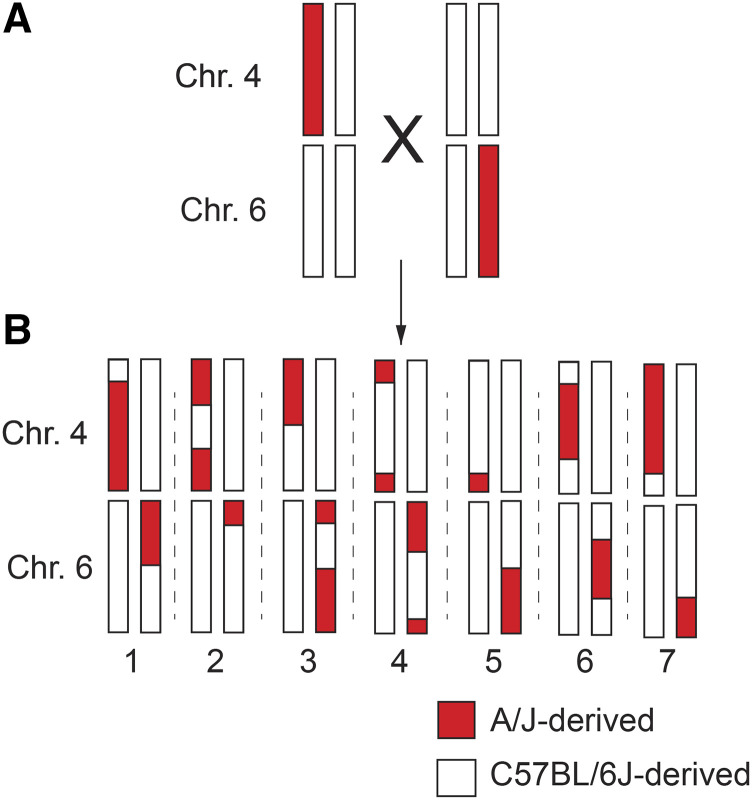
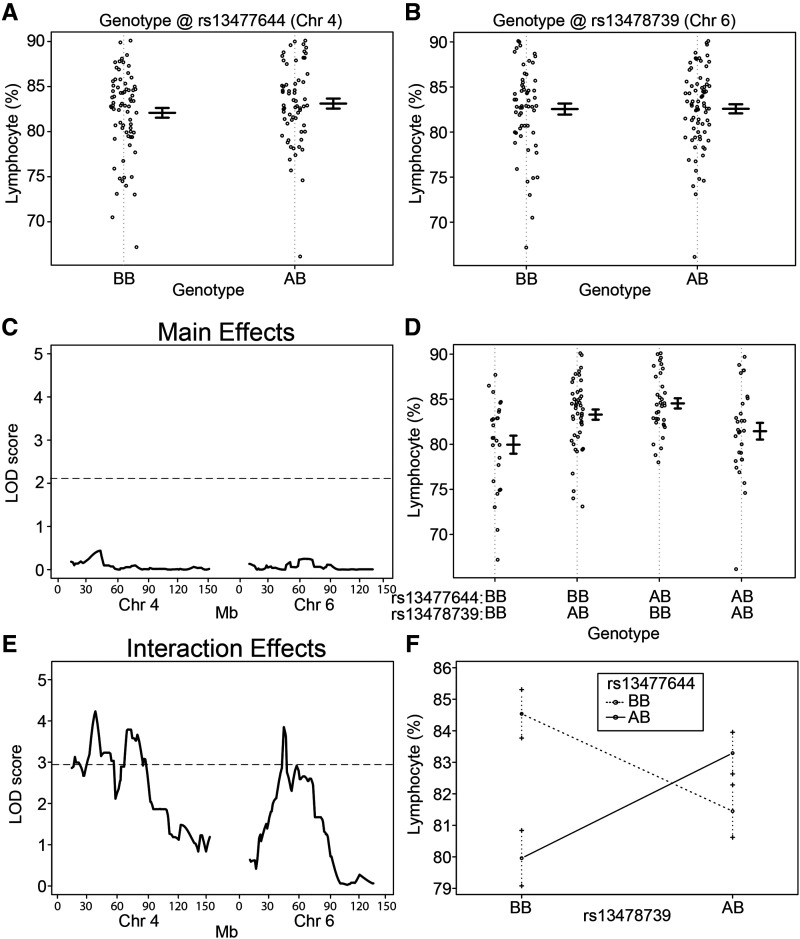
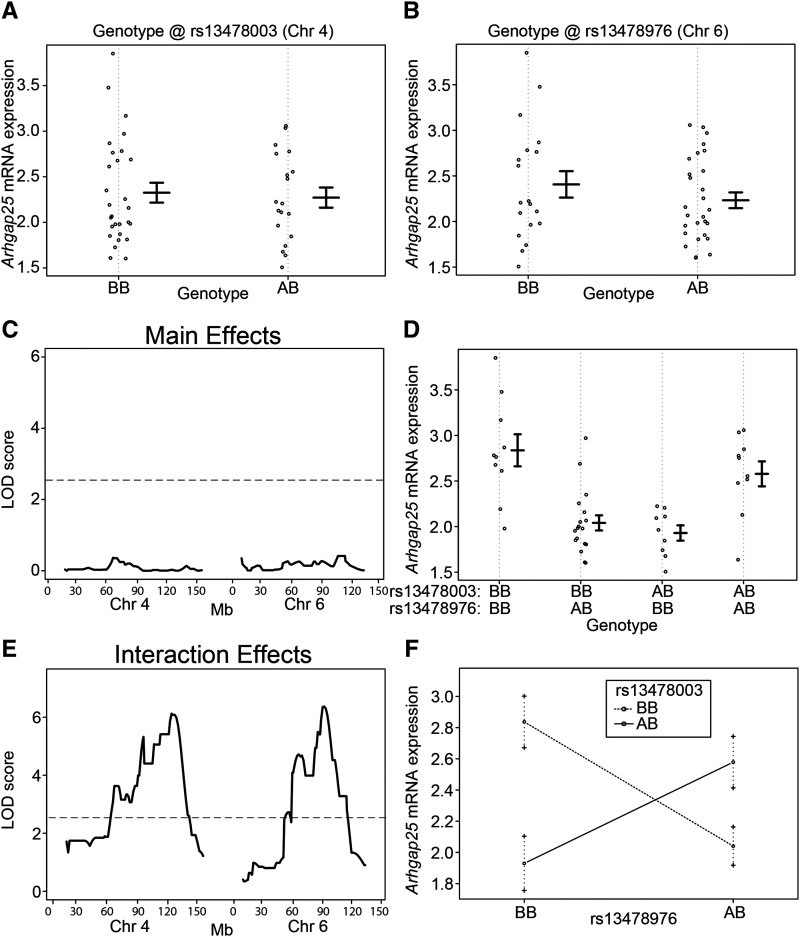
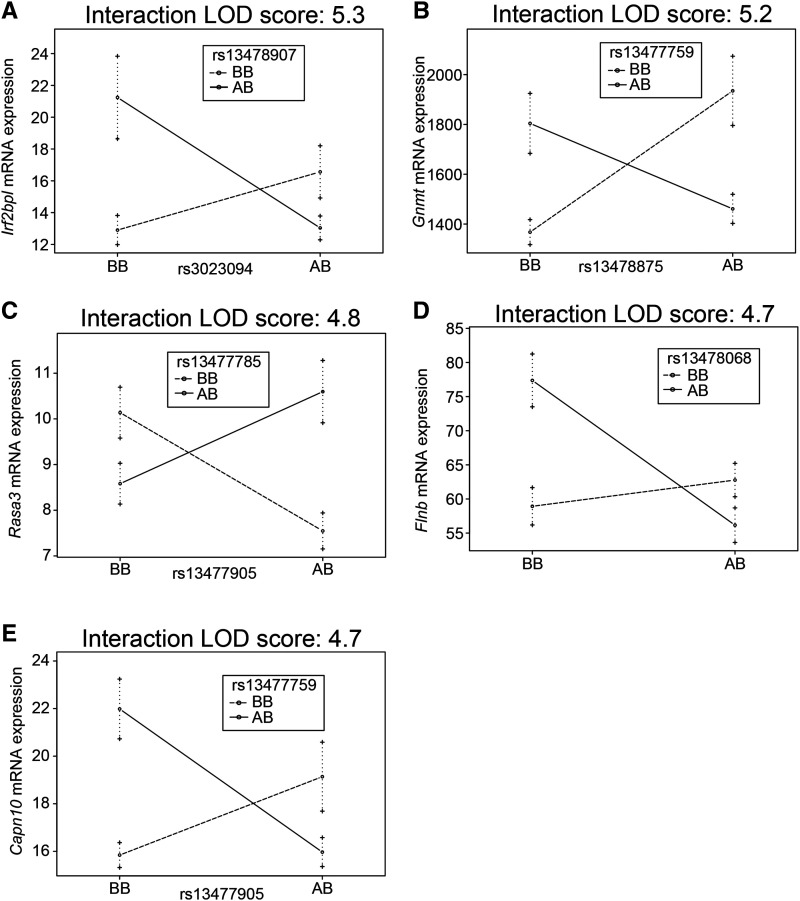
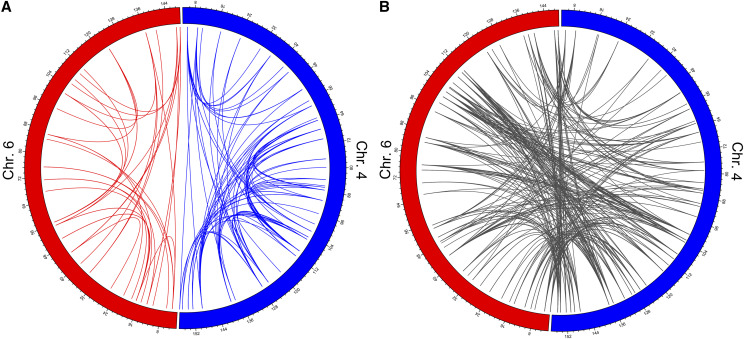
The genetic contribution of additive vs. non-additive (epistatic) effects in the regulation of complex traits is unclear. While genome-wide association studies typically ignore gene-gene interactions, in part because of the lack of statistical power for detecting them, mouse chromosome substitution strains (CSSs) represent an alternate approach for detecting epistasis given their limited allelic variation. Therefore, we utilized CSSs to identify and map both additive and epistatic loci that regulate a range of hematologic- and metabolism-related traits, as well as hepatic gene expression. Quantitative trait loci (QTL) were identified using a CSS-based backcross strategy involving the segregation of variants on the A/J-derived substituted chromosomes 4 and 6 on an otherwise C57BL/6J genetic background. In the liver transcriptomes of offspring from this cross, we identified and mapped additive QTL regulating the hepatic expression of 768 genes, and epistatic QTL pairs for 519 genes. Similarly, we identified additive QTL for fat pad weight, platelets, and the percentage of granulocytes in blood, as well as epistatic QTL pairs controlling the percentage of lymphocytes in blood and red cell distribution width. The variance attributed to the epistatic QTL pairs was approximately equal to that of the additive QTL; however, the SNPs in the epistatic QTL pairs that accounted for the largest variances were undetected in our single locus association analyses. These findings highlight the need to account for epistasis in association studies, and more broadly demonstrate the importance of identifying genetic interactions to understand the complete genetic architecture of complex traits.

Keywords: QTL; complex trait; epistasis; genetic architecture; missing heritability.


Figures

Figure 1
Figure 1
Diagram of the CSS backcross strategy to map epistatic QTL pairs. (A) (B6.A4 x B6)F1 mice were crossed with (B6 x B6.A6)F1 mice to generate 149 “N2” offspring. (B) Seven hypothetical “N2” offspring are shown. The recombinant chromosomes 4 and 6 are derived from A/J or C57BL/6J as indicated. All other chromosomes are B6- derived in all mice and therefore lack any allelic variation in this cross.
Figure 2
Figure 2
Epistatic interaction between loci on chromosomes 4 and 6 regulate the percentage of lymphocyte cells in blood. Lymphocyte % based on genotype at SNP markers (A) rs13477644 on chromosome 4 and (B) rs13478739 on chromosome 6. Each dot represents one mouse. (C) QTL mapping results for main effects on chromosomes 4 and 6. The LOD threshold for significance (P < 0.05) was calculated by permutation testing (n = 10,000) and is indicated by a horizontal line. Mb position is indicated for both chromosomes 4 and 6 along the x-axis. No significant main effect QTL were detected. (D) Lymphocyte % based on the combined genotypes at rs13477644 on chromosome 4 and rs13478739 on chromosome 6. (E) QTL mapping results for interaction effects on chromosomes 4 and 6. The LOD threshold for significance (P < 0.05) was calculated by permutation testing (n = 10,000) and is indicated by a horizontal line. The most significant interaction QTL pairs were detected with peaks centered at rs13477644 (17.3 Mb) and rs13478739 (22.6 Mb), with a potentially second peak on chromosome 4 centered at rs13477796 (37.6 Mb). Mb position is indicated for both chromosomes 4 and 6 along the x-axis. (F) Context-dependent effects of the BB and AB genotypes at markers rs13477644 and rs13478739. Mean and standard error are shown for each genotype combination. An “A” genotype indicates A/J-derived. A “B” genotype indicates C57BL/6J-derived.
Figure 3
Figure 3
Little overlap between main effect QTL and epistatic QTL pairs. (A,B) LOD scores for peak SNPs defining significant epistatic QTL pairs were plotted against the corresponding main effect LOD scores for each SNP within the epistatic pair. (C) LOD scores for peak SNPs defining significant main effect QTL were plotted against the most significant interaction LOD score for that SNP. The solid horizontal red line in panels A and B indicates the threshold level for significance for epistatic QTL pairs and the vertical dashed red line in panel C indicates the threshold level for significance for main effect QTL.
Figure 4
Figure 4
Epistatic interaction between loci on chromosomes 4 and 6 regulates Arhgap25 mRNA expression. Arhgap25 mRNA expression based on genotype at SNP markers (A) rs13478003 on chromosome 4 and (B) rs13478976 on chromosome 6. Each dot represents one mouse. (C) QTL mapping results for main effects on chromosomes 4 and 6. The LOD threshold for significance (P < 0.05) was calculated using R/qtl and is indicated by a horizontal line. Mb position is indicated for both chromosomes 4 and 6 along the x-axis. No significant QTL were detected. (D) Arhgap25 mRNA expression based on the combined genotypes at rs13478003 on chromosome 4 and rs13478976 on chromosome 6. (E) QTL mapping results for interaction effects on chromosomes 4 and 6. The LOD threshold for significance (P < 0.05) was calculated by R/qtl using 10,000 permutations and is indicated by a horizontal line. The most significant interaction QTL were detected with peaks at rs13478003 (69.1 Mb) and rs13478976 (52.2 Mb). Mb position is indicated for both chromosomes 4 and 6 along the x-axis. (F) Context- dependent effects of the BB and AB genotypes at rs13478003 and rs13478976. Mean and standard error are shown for each genotype combination. An “A” genotype indicates A/J-derived. A “B” genotype indicates C57BL/6J-derived.
Figure 5
Figure 5
Epistatic interactions control gene expression. Context dependent effects on gene expression for (A) Irf2bpl, (B) Gnmt, (C) Rasa3, (D) Flnb, and (E) Capn10. The y-axis represents the number of unique sequencing reads per gene after normalizing read depth across samples. Mean and standard error are shown for each genotype combination. An “A” genotype indicates A/J-derived. A “B” genotype indicates C57BL/6J-derived.
Figure 6
Figure 6
Inter-chromosomal and intra-chromosomal epistatic interactions that control gene expression are widely distributed along chromosomes 4 and 6. (A) The circos plots illustrates the location along chromosomes 4 and 6 for the peak SNPs for all epistatic QTL pairs regulating gene expression. Chromosome 6 and the intra-chromosomal epistatic QTL pairs on that chromosome (n = 37) are shown in red. Chromosome 4 and the intra-chromosomal epistatic QTL pairs on that chromosome (n = 149) are shown in blue. Numbering around the circle plots indicates the Mb position on each chromosome. (B) Inter-chromosomal epistatic QTL pairs between chromosomes 4 and 6 (n = 333) are shown in gray.

References

    1. Adler, D. M. D., 2019 rgl: 3D Visualization Using OpenGL. R package version 0.100.30. https://CRAN.R-project.org/package=rgl.
    1. Al-Sinani S., Woodhouse N., Al-Mamari A., Al-Shafie O., Al-Shafaee M. et al. , 2015. Association of gene variants with susceptibility to type 2 diabetes among Omanis. World J. Diabetes 6: 358–366. 10.4239/wjd.v6.i2.358 - DOI - PMC - PubMed
    1. Anders S., Pyl P. T., and Huber W., 2015. HTSeq–a Python framework to work with high-throughput sequencing data. Bioinformatics 31: 166–169. 10.1093/bioinformatics/btu638 - DOI - PMC - PubMed
    1. Andrews S., 2010. FastQC: a quality control tool for high throughput sequence data. Available online at: http://www.bioinformatics.babraham.ac.uk/projects/fastqc.
    1. Baier L. J., Permana P. A., Yang X., Pratley R. E., Hanson R. L. et al. , 2000. A calpain-10 gene polymorphism is associated with reduced muscle mRNA levels and insulin resistance. J. Clin. Invest. 106: R69–R73. 10.1172/JCI10665 - DOI - PMC - PubMed