. 2020 Oct 20;117(42):26438-26447.
doi: 10.1073/pnas.2009838117. Epub 2020 Oct 6.

Metformin rescues Parkinson's disease phenotypes caused by hyperactive mitochondria

Affiliations

Metformin rescues Parkinson's disease phenotypes caused by hyperactive mitochondria

Danielle E Mor et al. Proc Natl Acad Sci U S A. .

Abstract

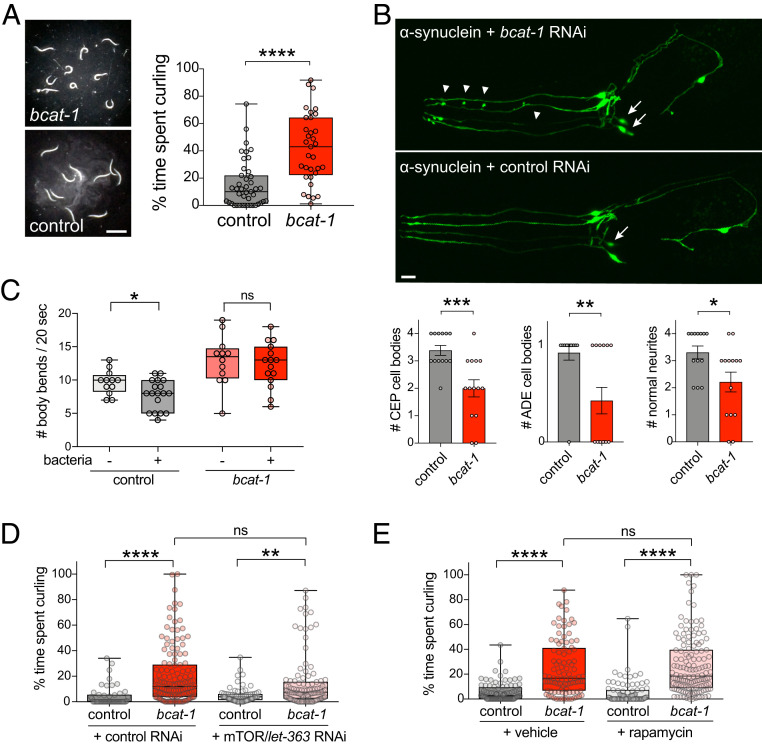
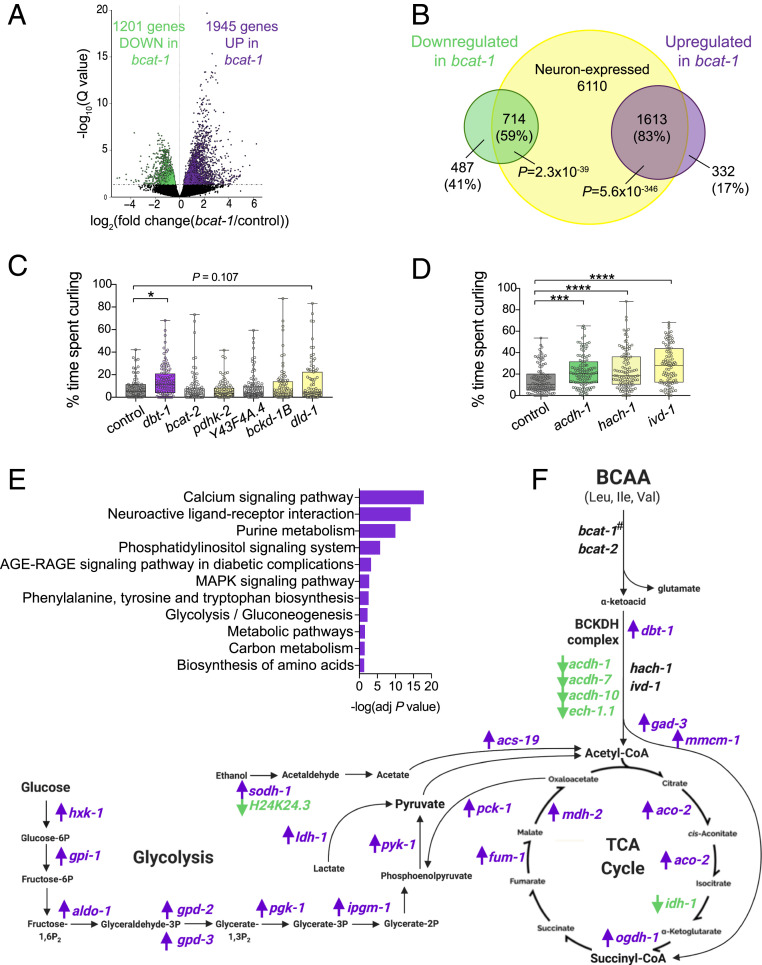
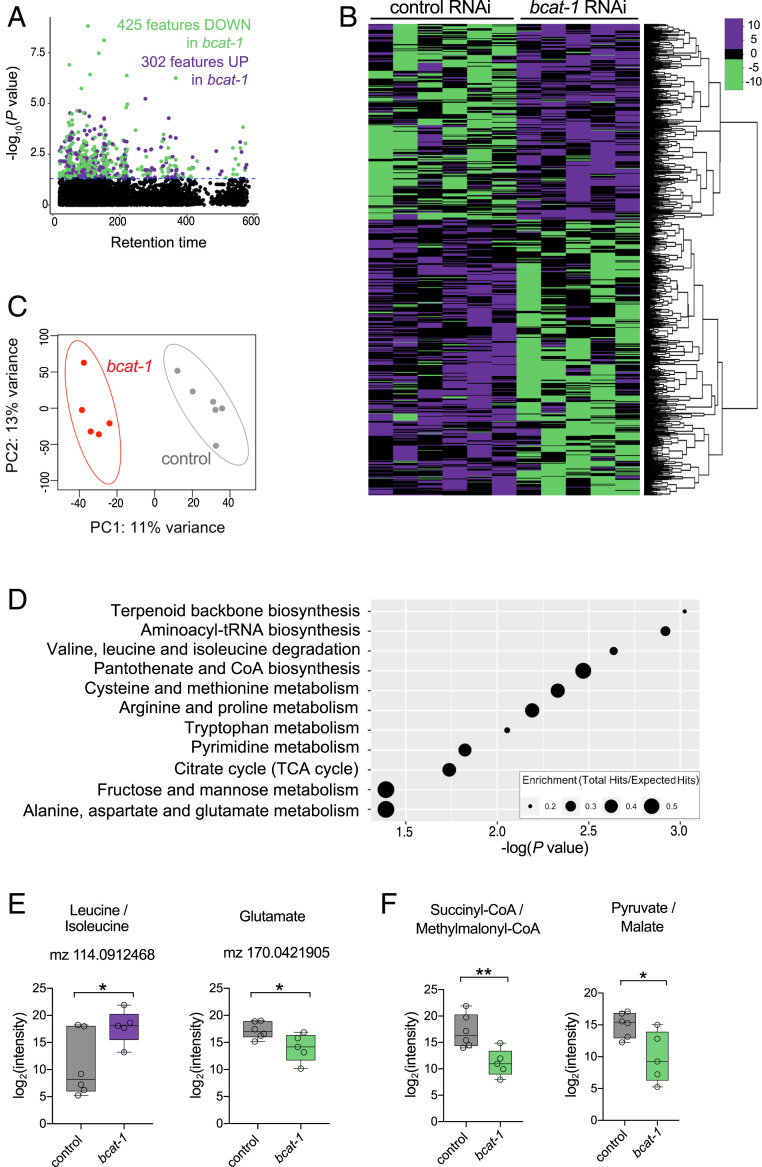
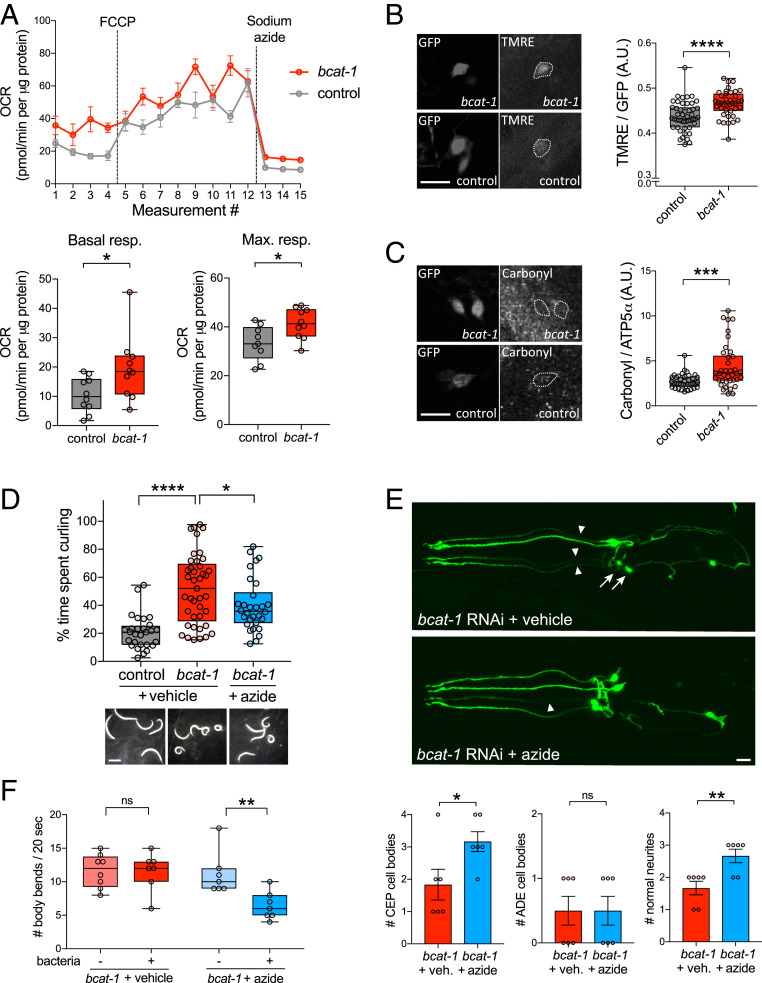
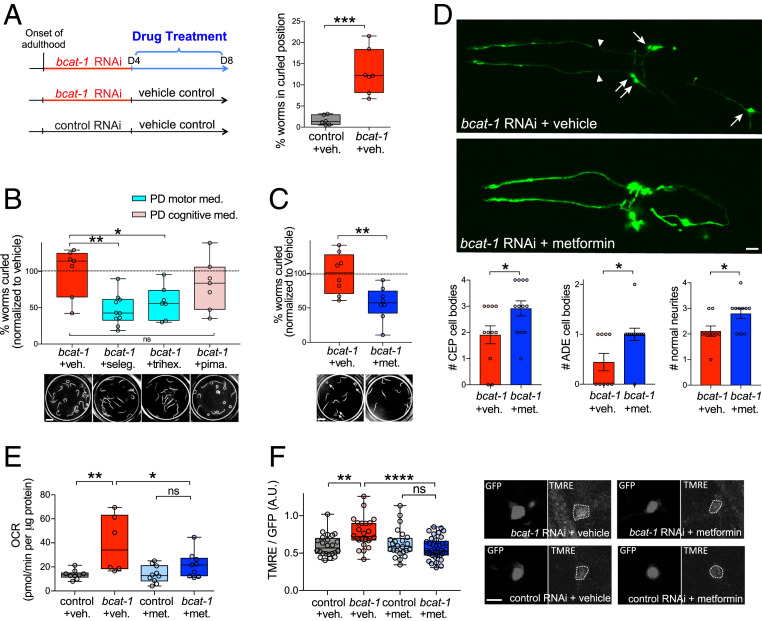
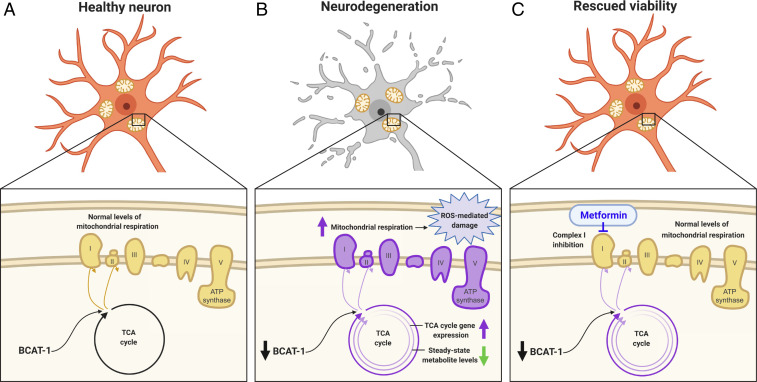
Metabolic dysfunction occurs in many age-related neurodegenerative diseases, yet its role in disease etiology remains poorly understood. We recently discovered a potential causal link between the branched-chain amino acid transferase BCAT-1 and the neurodegenerative movement disorder Parkinson's disease (PD). RNAi-mediated knockdown of Caenorhabditis elegans bcat-1 is known to recapitulate PD-like features, including progressive motor deficits and neurodegeneration with age, yet the underlying mechanisms have remained unknown. Using transcriptomic, metabolomic, and imaging approaches, we show here that bcat-1 knockdown increases mitochondrial respiration and induces oxidative damage in neurons through mammalian target of rapamycin-independent mechanisms. Increased mitochondrial respiration, or "mitochondrial hyperactivity," is required for bcat-1(RNAi) neurotoxicity. Moreover, we show that post-disease-onset administration of the type 2 diabetes medication metformin reduces mitochondrial respiration to control levels and significantly improves both motor function and neuronal viability. Taken together, our findings suggest that mitochondrial hyperactivity may be an early event in the pathogenesis of PD, and that strategies aimed at reducing mitochondrial respiration may constitute a surprising new avenue for PD treatment.

Keywords: Caenorhabditis elegans; Parkinson’s disease; branched-chain amino acid metabolism; metformin; mitochondria.


Conflict of interest statement

Competing interest statement: The method used for automated quantification of curling motor behavior was filed under Patent #62/989,317: C.T.M., S.S., D.E.M., R.K., W.K., “Novel High-Throughput Screening Method for Parkinson’s Phenotypes Using C. elegans.” This patent is specifically for the screening method, not for metformin treatment of Parkinson’s disease phenotypes.

Figures

Fig. 1.
Fig. 1.
bcat-1 knockdown causes motor dysfunction and promotes neurodegeneration via mTOR-independent mechanisms. (A) Adult- and neuron-specific RNAi-mediated bcat-1 knockdown results in severe spasm-like “curling” motor dysfunction in aged (day 8 adult) animals. n = 43 for control, 33 for bcat-1(RNAi). Two-tailed t test. (Scale bar: 1 mm.) (B) In neuronal RNAi-sensitive worms expressing α-synuclein in dopaminergic neurons, bcat-1 knockdown accelerates degeneration of CEP and ADE dopaminergic cell bodies (arrows) and neurites (arrowheads) measured on day 6. n = 13 for control, 14 for bcat-1(RNAi). Two-tailed t test. Data are mean ± SEM. (Scale bar: 10 μm.) (C) While dopaminergic-dependent basal slowing behavior is still intact on day 5 in worms expressing α-synuclein in dopaminergic neurons, it is absent with additional knockdown of bcat-1. n = 12 each for (−)bacteria, 18 for control (+)bacteria, 15 for bcat-1 (+)bacteria. Two-tailed t tests. (D and E) Curling on day 8 is unaffected by mTOR/let-363 knockdown (D) or rapamycin treatment (E) in neuronal RNAi-sensitive worms (strain TU3311) with bcat-1 knockdown. In D, n = 48 for control, 134 for bcat-1 control, 72 for control let-363, 106 for bcat-1 let-363. Two-way ANOVA with Tukey’s post hoc test. In E, n = 92 for control vehicle, 97 for bcat-1 vehicle, 87 for control rapamycin, 139 for bcat-1 rapamycin. Two-way ANOVA with Tukey’s post hoc test. ns, not significant. *P < 0.05; **P < 0.01; ***P < 0.001; ****P < 0.0001. Boxplots show minimum, 25th percentile, median, 75th percentile, and maximum.
Fig. 2.
Fig. 2.
bcat-1-related PD phenotypes are associated with neuronal up-regulation of glycolysis and TCA cycle genes. Neurons were isolated on day 5 from neuronal RNAi-sensitive worms with adult-specific bcat-1 knockdown and were RNA-sequenced. (A) Volcano plot showing up-regulated (purple) and down-regulated (green) genes in bcat-1(RNAi) neurons (false discovery rate < 0.05). (B) Venn diagram confirming that the majority of differentially expressed genes are expressed in neurons. P values: hypergeometric distributions. (C and D) Adult-specific knockdown of BCAA pathway components in neuronal RNAi-sensitive worms (strain TU3311) shows that disruption of dbt-1 (C), acdh-1, hach-1, or ivd-1 (D) caused curling on day 8. n = 70 in C and 99 in D for controls, 100 for dbt-1, 95 for bcat-2, 91 for pdhk-2, 111 for Y43F4A.4, 85 for bckd-1B, 90 for dld-1, 111 for acdh-1, 107 for hach-1, and 96 for ivd-1. One-way ANOVA with Dunnett’s post hoc test. (E) KEGG analysis of genes up-regulated in bcat-1(RNAi) neurons. (F) BCAA, glycolysis, and TCA cycle pathway schematic with genes up-regulated (purple) and down-regulated (green) in bcat-1(RNAi) neurons. #bcat-1 expression could not be measured due to RNA-sequencing of the bcat-1 RNAi itself. n = 5 independent collections/group. *P < 0.05; ***P < 0.001; ****P < 0.0001. Boxplots show minimum, 25th percentile, median, 75th percentile, and maximum.
Fig. 3.
Fig. 3.
Metabolomics analysis reveals a depletion of TCA cycle metabolites in bcat-1(RNAi) worms. Neuronal RNAi-sensitive worms were collected for metabolomics on day 5 following adult-specific bcat-1 knockdown. (A and B) Manhattan plot (A) and heat map (B) showing features that were increased (purple) and decreased (green) (P < 0.05) in bcat-1(RNAi) worms. The color values in B represent relative intensities of features that have been log2-transformed and centered. (C) Partial least squares-discriminant analysis. (D) Pathway analysis using the mummichog algorithm. (E) As expected, features putatively annotated as leucine/isoleucine and glutamate were increased and decreased, respectively, in bcat-1(RNAi) worms. (F) TCA cycle metabolites/precursors were decreased in bcat-1(RNAi) worms. n = 6 independent collections for control, 5 for bcat-1. Two-tailed t tests. *P < 0.05; **P < 0.01. Boxplots show minimum, 25th percentile, median, 75th percentile, and maximum.
Fig. 4.
Fig. 4.
bcat-1(RNAi) neurotoxicity is dependent on increased mitochondrial respiration and is associated with oxidative damage. (A) Mitochondrial respiration was increased on day 5 in neuronal RNAi-sensitive bcat-1(RNAi) worms (strain CF512). n = 10 wells totaling 102 worms for control basal, 9 wells totaling 92 worms for control maximum, 10 wells totaling 100 worms per bcat-1 condition. Two-tailed t tests. max., maximal; resp., respiration. (B) Mitochondrial activity, as measured by TMRE fluorescence, was increased on day 5 in CEP α-synuclein–expressing dopaminergic neurons with bcat-1 knockdown. n = 15 worms totaling 47 CEPs for control, 11 worms totaling 39 CEPs for bcat-1. Two-tailed t test. (Scale bar: 10 μm.) (C) Protein carbonylation was increased on day 8 in CEP α-synuclein–expressing dopaminergic neurons with bcat-1 knockdown. (Scale bar, 10 μm.) n = 10 worms totaling 37 CEPs for control, 10 worms totaling 38 CEPs for bcat-1. Two-tailed t test. (D) bcat-1(RNAi) worms (strain CF512) treated with 100 μM sodium azide starting on day 4 had reduced curling motor dysfunction on day 8. n = 28 worms for control, 41 for bcat-1+vehicle, 30 for bcat-1+azide. One-way ANOVA with Tukey’s post hoc test. (Scale bar: 0.5 mm.) (E) Azide treatment starting on day 4 reduced neurodegeneration of α-synuclein–expressing CEP dopaminergic cell bodies (arrows) and neurites (arrowheads) with bcat-1 knockdown, as measured on day 8. n = 6 worms per group. Two-tailed t tests. Data are mean ± SEM. veh., vehicle. (Scale bar: 10 μm.) (F) Azide treatment starting on day 3 restored basal slowing on day 5 in bcat-1(RNAi) worms expressing α-synuclein in dopaminergic neurons. n = 7 per group except n = 8 for bcat-1 + vehicle (−)bacteria. Two-tailed t tests. A.U., arbitrary units. ns, not significant. *P < 0.05; **P < 0.01; ***P < 0.001; ****P < 0.0001. Boxplots show minimum, 25th percentile, median, 75th percentile, and maximum.
Fig. 5.
Fig. 5.
Metformin reduces neurodegeneration and restores normal levels of mitochondrial respiration in bcat-1(RNAi) worms. (A) Experimental design for drug treatments. Neuronal RNAi-sensitive worms (strain CF512) were fed bcat-1 or control RNAi as adults until day 4, then transferred to heat-killed OP50 E. coli and 50 μM drug or vehicle. Vehicle-treated bcat-1(RNAi) worms curled on day 8, as measured using our automated system. n = 6 wells totaling 91 worms for control, 7 wells totaling 57 worms for bcat-1. Two-tailed t test. (B) PD medications prescribed for motor symptoms (selegiline [seleg.] and trihexyphenidyl [trihex.]) reduced curling in bcat-1(RNAi) worms on day 8, whereas the antipsychotic pimavanserin (pima.) did not. n = 7 wells totaling 142 worms for bcat-1, 10 wells totaling 149 worms for selegiline, 7 wells totaling 86 worms for trihexyphenidyl, 7 wells totaling 103 worms for pimavanserin. One-way ANOVA with Dunnett’s post hoc test. (Scale bar: 1 mm.) (C) Metformin reduced curling (arrows) on day 8 in bcat-1(RNAi) worms expressing α-synuclein in dopaminergic neurons. n = 8 wells totaling 65 worms for vehicle, 8 wells totaling 121 worms for metformin. Two-tailed t test. (Scale bar: 1 mm.) (D) Metformin reduced neurodegeneration of α-synuclein–expressing dopaminergic cell bodies (arrows) and neurites (arrowheads) with bcat-1 knockdown, as measured on day 8. n = 11 for CEP vehicle, 12 each for CEP and ADE metformin, 9 each for ADE and neurites vehicle, 10 for neurites metformin. Two-tailed t tests. Data are mean ± SEM. (Scale bar: 10 μm.) (E) Metformin reduced basal mitochondrial respiration in bcat-1(RNAi) worms (strain CF512) on day 8. n = 9 wells totaling 144 worms for control vehicle, 6 wells totaling 50 worms for bcat-1 vehicle, 10 wells totaling 128 worms for control metformin, 9 wells totaling 113 worms for bcat-1 metformin. Two-way ANOVA with Tukey’s post hoc test. (F) Metformin reduced mitochondrial activity in α-synuclein–expressing CEP dopaminergic neurons with bcat-1 knockdown, as measured on day 6. n = 8 worms totaling 24 CEPs for control vehicle, 7 worms totaling 24 CEPs for bcat-1 vehicle, 9 worms totaling 24 CEPs for control metformin, 10 worms totaling 37 CEPs for bcat-1 metformin. Two-way ANOVA with Tukey’s post hoc. (Scale bar: 5 μm.) A.U., arbitrary units. met., metformin. ns, not significant. veh., vehicle. *P < 0.05, **P < 0.01, ***P < 0.001, ****P < 0.0001. Boxplots show minimum, 25th percentile, median, 75th percentile, and maximum.
Fig. 6.
Fig. 6.
Model. (A) In a healthy neuron, BCAT-1 normally provides metabolic input into the TCA cycle, giving rise to normal levels of mitochondrial respiration. (B) With a reduction of BCAT-1, TCA cycle gene expression is increased and steady-state levels of TCA cycle metabolites are decreased, possibly due to greater TCA cycle turnover. This leads to increased mitochondrial respiration and reactive oxygen species-mediated damage, ultimately causing neurodegeneration. (C) Metformin treatment restores mitochondrial homeostasis and rescues neuronal viability, potentially through complex I inhibition.

References

    1. Van Den Eeden S. K. et al. ., Incidence of Parkinson’s disease: Variation by age, gender, and race/ethnicity. Am. J. Epidemiol. 157, 1015–1022 (2003). - PubMed
    1. de Lau L. M., Breteler M. M., Epidemiology of Parkinson’s disease. Lancet Neurol. 5, 525–535 (2006). - PubMed
    1. Forno L. S., Neuropathology of Parkinson’s disease. J. Neuropathol. Exp. Neurol. 55, 259–272 (1996). - PubMed
    1. Spillantini M. G. et al. ., Alpha-synuclein in Lewy bodies. Nature 388, 839–840 (1997). - PubMed
    1. Klein C., Westenberger A., Genetics of Parkinson’s disease. Cold Spring Harb. Perspect. Med. 2, a008888 (2012). - PMC - PubMed

Publication types

MeSH terms