. 2020 Oct 6;5(5):e00771-20.
doi: 10.1128/mSystems.00771-20.

End-to-End Protocol for the Detection of SARS-CoV-2 from Built Environments

Affiliations

End-to-End Protocol for the Detection of SARS-CoV-2 from Built Environments

Ceth W Parker et al. mSystems. .

Abstract

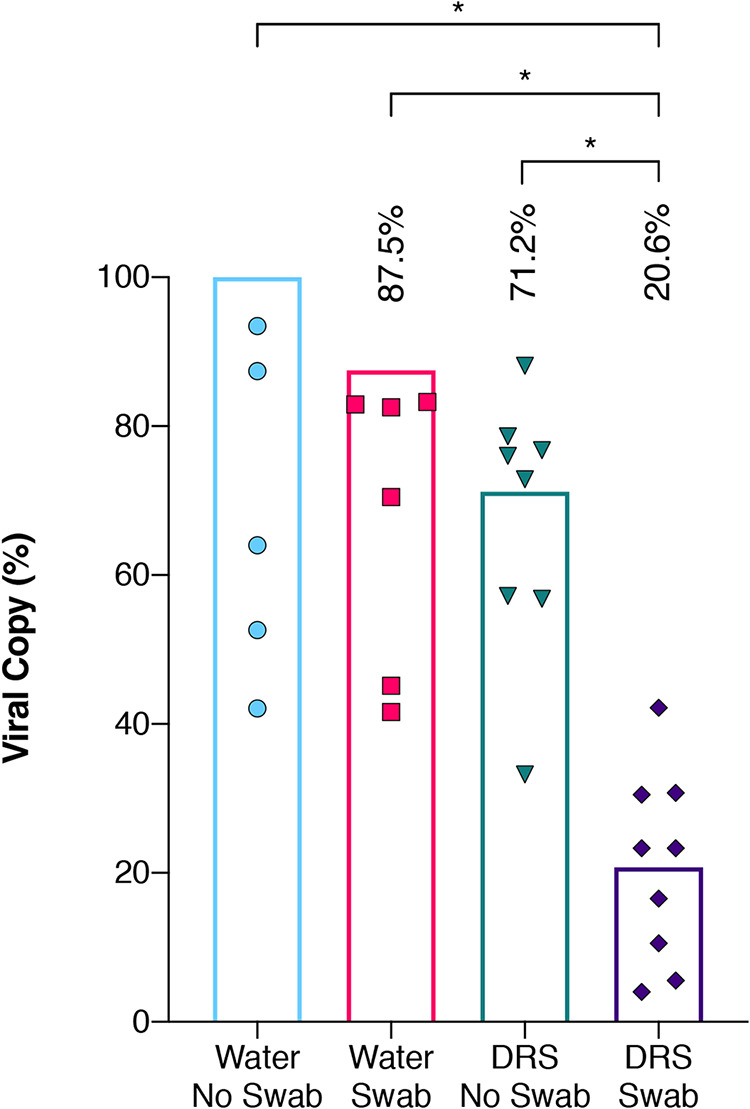
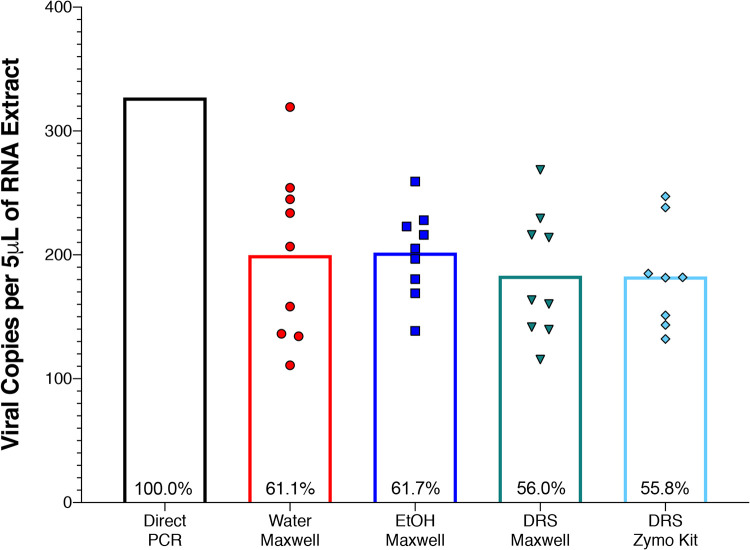
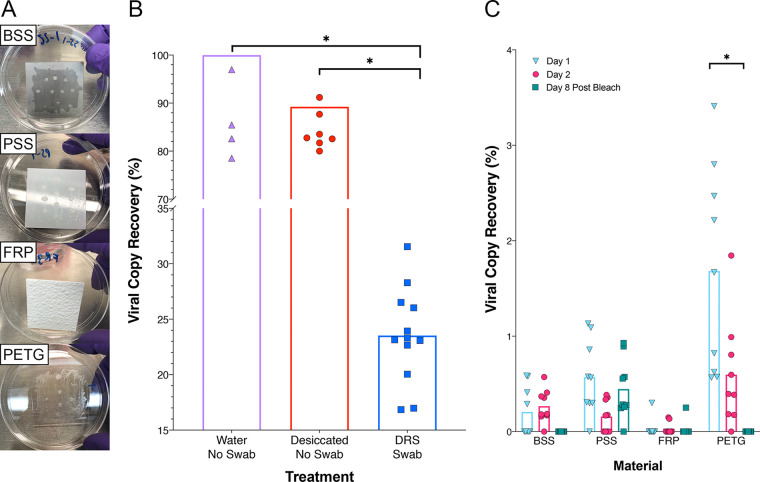
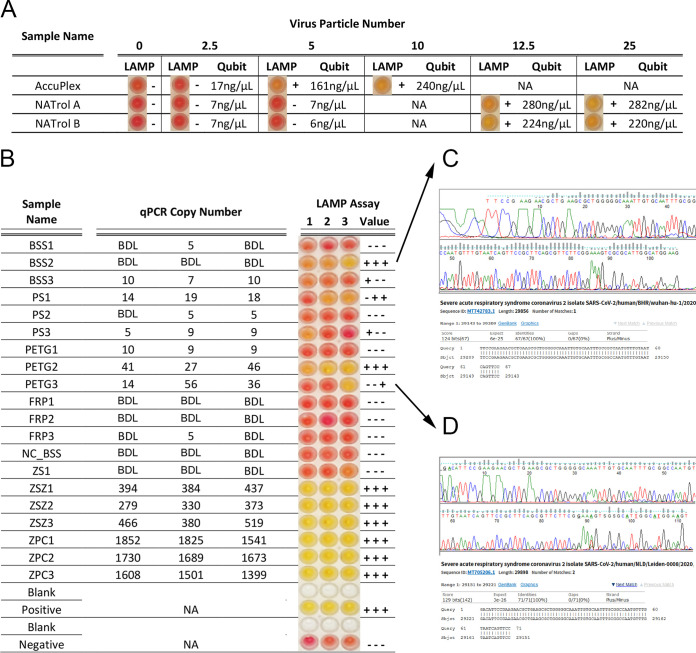
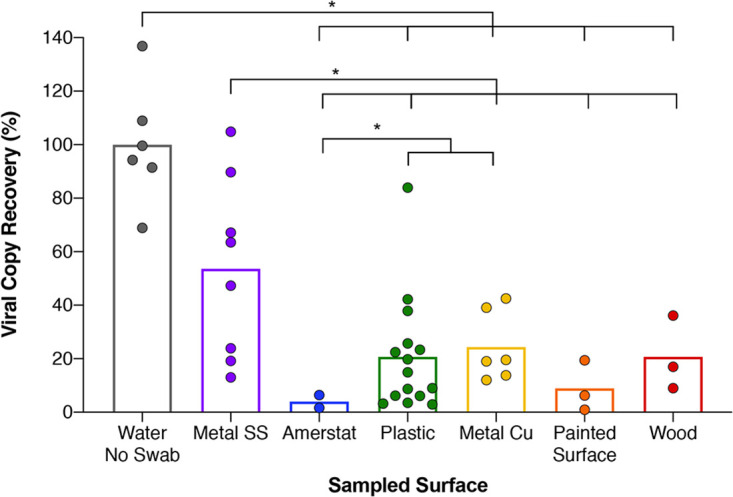
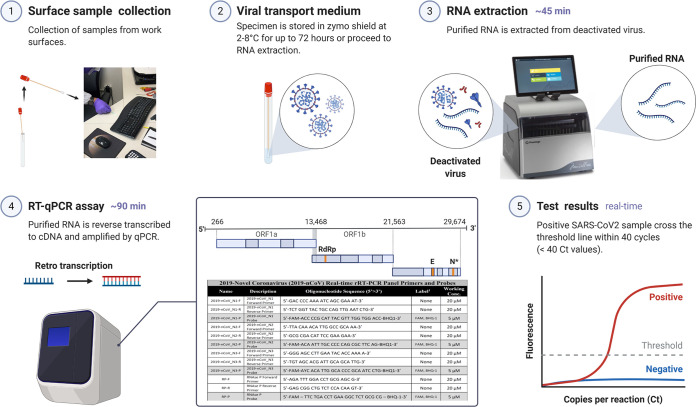
Severe acute respiratory syndrome coronavirus 2 (SARS-CoV-2), the virus that causes coronavirus disease 2019, is a respiratory virus primarily transmitted person to person through inhalation of droplets or aerosols, laden with viral particles. However, as recent studies have shown, virions can remain infectious for up to 72 h on surfaces, which can lead to transmission through contact. Thus, a comprehensive study was conducted to determine the efficiency of protocols to recover SARS-CoV-2 from surfaces in built environments. This end-to-end (E2E) study showed that the effective combination for monitoring SARS-CoV-2 on surfaces includes using an Isohelix swab collection tool, DNA/RNA Shield as a preservative, an automated system for RNA extraction, and reverse transcriptase quantitative PCR (RT-qPCR) as the detection assay. Using this E2E approach, this study showed that, in some cases, noninfectious viral fragments of SARS-CoV-2 persisted on surfaces for as long as 8 days even after bleach treatment. Additionally, debris associated with specific built environment surfaces appeared to inhibit and negatively impact the recovery of RNA; Amerstat demonstrated the highest inhibition (>90%) when challenged with an inactivated viral control. Overall, it was determined that this E2E protocol required a minimum of 1,000 viral particles per 25 cm2 to successfully detect virus from test surfaces. Despite our findings of viral fragment longevity on surfaces, when this method was employed to evaluate 368 samples collected from various built environmental surfaces, all samples tested negative, indicating that the surfaces were either void of virus or below the detection limit of the assay.IMPORTANCE The ongoing severe acute respiratory syndrome coronavirus 2 (SARS-CoV-2) (the virus responsible for coronavirus disease 2019 [COVID-19]) pandemic has led to a global slowdown with far-reaching financial and social impacts. The SARS-CoV-2 respiratory virus is primarily transmitted from person to person through inhalation of infected droplets or aerosols. However, some studies have shown that virions can remain infectious on surfaces for days and can lead to human infection from contact with infected surfaces. Thus, a comprehensive study was conducted to determine the efficiency of protocols to recover SARS-CoV-2 from surfaces in built environments. This end-to-end study showed that the effective combination for monitoring SARS-CoV-2 on surfaces required a minimum of 1,000 viral particles per 25 cm2 to successfully detect virus from surfaces. This comprehensive study can provide valuable information regarding surface monitoring of various materials as well as the capacity to retain viral RNA and allow for effective disinfection.

Keywords: COVID-19; LAMP; RT-qPCR; SARS-CoV-2; built environments; coronavirus; end-to-end; fomites; high-touch surface; surface sampling.


Figures

FIG 1
FIG 1
Influence of swab and DRS on viral RNA extraction efficiency. Equal quantities of the inactivated AccuPlex viral particles were extracted using a variety of initial extraction conditions and then quantified using RT-qPCR assay. The extraction conditions encompassed water with no swab (blue circles), water with Isohelix swab (red squares), DNA/RNA Shield (DRS) with no swab (green inverted triangles), and DRS with Isohelix swab (purple diamonds). Each extraction condition was then divided by the average copy numbers generated from the water with no swab (theoretical highest yield) to get percent recovery and plotted with columns representing their mean percentage. Welch’s t test was used to determine significant differences between extraction conditions, and significance (P < 0.05) is denoted by asterisks.
FIG 2
FIG 2
Extraction kit efficiency. RNA extraction from AccuPlex viral particles was examined using direct PCR (black column) and compared to four different combinations of storage liquids and extraction kits including Maxwell RSC viral extraction kit with water (red circles), ethanol (EtOH; blue squares), and DRS (green inverted triangles), as well as Zymo Quick-DNA/RNA viral kit with DRS (turquoise diamonds), followed by quantification using RT-qPCR assay. Values are expressed as nucleocapsid (N1) copy numbers in 5 μl of RNA extract; all replicates are plotted as individual points, with means presented as columns. Direct PCR was treated as 100% to calculate the extraction efficiency of the other extraction methods (recorded within the columns). Significant differences were determined by Welch’s t test, and significance (P < 0.05) is denoted by asterisks.
FIG 3
FIG 3
Viral particle recovery from built environment surface materials. (A) Image of the inoculated plates (BSS, PSS, FRP, and PETG) where inactivated viral particles (10 μl of NATtrol) were aliquoted 10 times onto four separate materials in triplicate. (B) Viral particles were either kept overnight at room temperature as liquid (Eppendorf tube was closed; Water No Swab, purple triangles) or desiccated overnight at room temperature in tubes (No Swab Desiccated, red circles) which were then sacrificed to extract RNA directly without removing from the surface. In addition, aliquots of viral particles that were not desiccated but inoculated in DRS and swab materials were also processed (DRS Swab, blue squares). (C) Viral particles were collected from the seeded surfaces with Isohelix swabs and DRS, extracted on the Maxwell RSC, and quantified using RT-qPCR assay. Viral RNA copy number for each condition was divided by an extraction control to calculate percent recovery for day 1 (blue inverted triangles), day 2 (red circles), and day 8 post-bleach (green squares). Statistical significance was determined by Welch’s t test with significance (P < 0.05) denoted by asterisks.
FIG 4
FIG 4
Comparison of RT-LAMP and RT-qPCR assays. (A) RT-LAMP assay for limit of detection was carried out for AccuPlex and NATtrol standards with both the colorimetric changes seen in the reaction (RT-LAMP assay output) and the Qubit quantifications presented across a dilution series of viral particle number. The qualitative RT-LAMP assay output was determined based on color change from red to yellow in the presence of the target sequence, whereas RNA measurements of RT-LAMP assay reactions using Qubit gave semi-quantitative values. Qubit values that were below 150 ng/μl were denoted as minus signs, and Qubit values that were above 150 ng/μl were recorded as plus signs. (B) Viral particles collected from built environment surface materials (Fig. 3, day 1) were analyzed with the RT-LAMP and RT-qPCR assays. RT-LAMP assay colorimetric output is presented alongside Qubit +/− result value and RT-qPCR quantities. Values that were not tested were marked as not applicable (NA), and values that were undetectable were recorded as BDL. A BSS coupon that remained uninoculated (NC_BSS) and was processed alongside as a negative control; a swab negative control in DRS (ZS1); a swab with 5,000 copies of NATtrol in DRS (ZSZ1-ZSZ3); 5,000 copies of NATtrol control extracted directly from Maxwell (ZPC1-ZPC3). Sanger sequence chromatograms and associated National Center for Biotechnology Information BLAST results for BSS2 (C) and PETG3 (D) are also included.
FIG 5
FIG 5
Inhibition by field-collected built environment surface samples after RNA extraction. Field swab collection of diverse built environment surface samples which had their DRS vials spiked with inactivated viral AccuPlex particles prior to RNA extraction and quantification with RT-qPCR. Differential amplification of stainless steel (Metal SS) (purple circles), Amerstat (blue circles), plastic (green circles), copper (Metal Cu) (yellow circles), painted surface (orange circles), and wood (red circles) was compared to a positive control (gray circles) and reported as percent recovery compared to that positive-control mean. Each column represents average percent recovery for the respective surface type. Significance (P < 0.05) is denoted by asterisks, based on Welch’s t test.
FIG 6
FIG 6
Environmental surface testing using E2E protocol. The optimized E2E protocol for detecting SARS-CoV-2 virus on surfaces is a 5-part procedure: (1) surface sample collection, (2) viral transport medium, (3) RNA extraction, (4) RT-qPCR assay, and (5) test results.

References

    1. Kashir J, Yaqinuddin A. 2020. Loop mediated isothermal amplification (LAMP) assays as a rapid diagnostic for COVID-19. Med Hypotheses 141:109786. doi:10.1016/j.mehy.2020.109786. - DOI - PMC - PubMed
    1. Ru H, Yang E, Zou K. 2020. What do we learn from SARS-CoV-1 to SARS-CoV-2: evidence from global stock markets. Available at SSRN 3569330. doi:10.2139/ssrn.3569330. - DOI
    1. de Oliveira Araújo FJ, de Lima LSA, Cidade PIM, Nobre CB, Neto MLR. 2020. Impact of SARS-CoV-2 and its reverberation in global higher education and mental health. Psychiatry Res 288:112977. doi:10.1016/j.psychres.2020.112977. - DOI - PMC - PubMed
    1. Han Q, Lin Q, Ni Z, You L. 2020. Uncertainties about the transmission routes of 2019 novel coronavirus. Influenza Other Respir Viruses 14:470–471. doi:10.1111/irv.12735. - DOI - PMC - PubMed
    1. West R, Michie S, Rubin GJ, Amlôt R. 2020. Applying principles of behaviour change to reduce SARS-CoV-2 transmission. Nat Hum Behav 4:451–459. doi:10.1038/s41562-020-0887-9. - DOI - PubMed

LinkOut - more resources