. 2020 Oct 6;11(10):828.
doi: 10.1038/s41419-020-03020-9.

Intracellular amyloid toxicity induces oxytosis/ferroptosis regulated cell death

Affiliations

Intracellular amyloid toxicity induces oxytosis/ferroptosis regulated cell death

Ling Huang et al. Cell Death Dis. .

Abstract

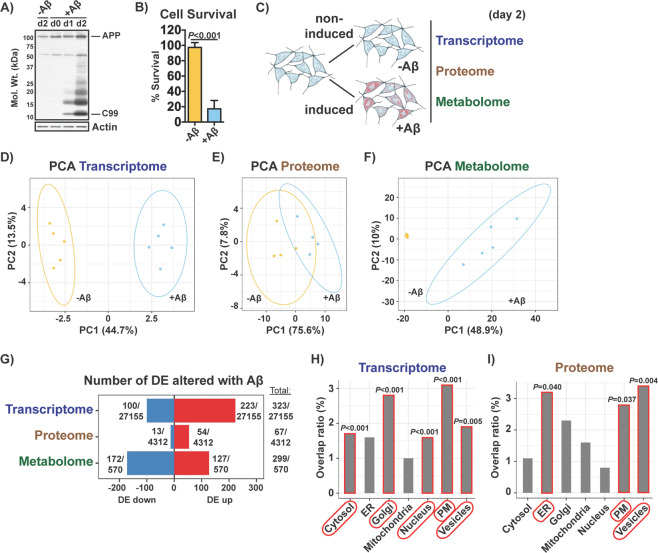
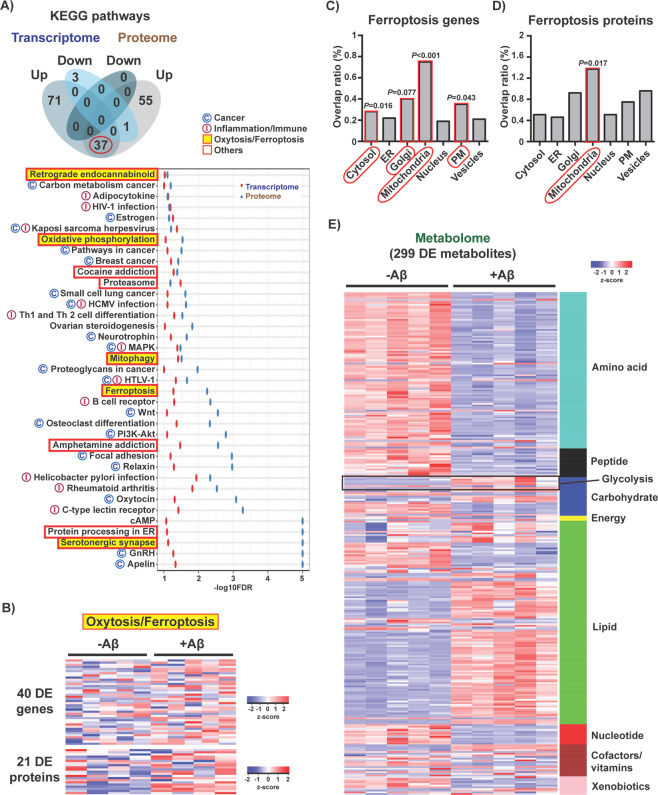
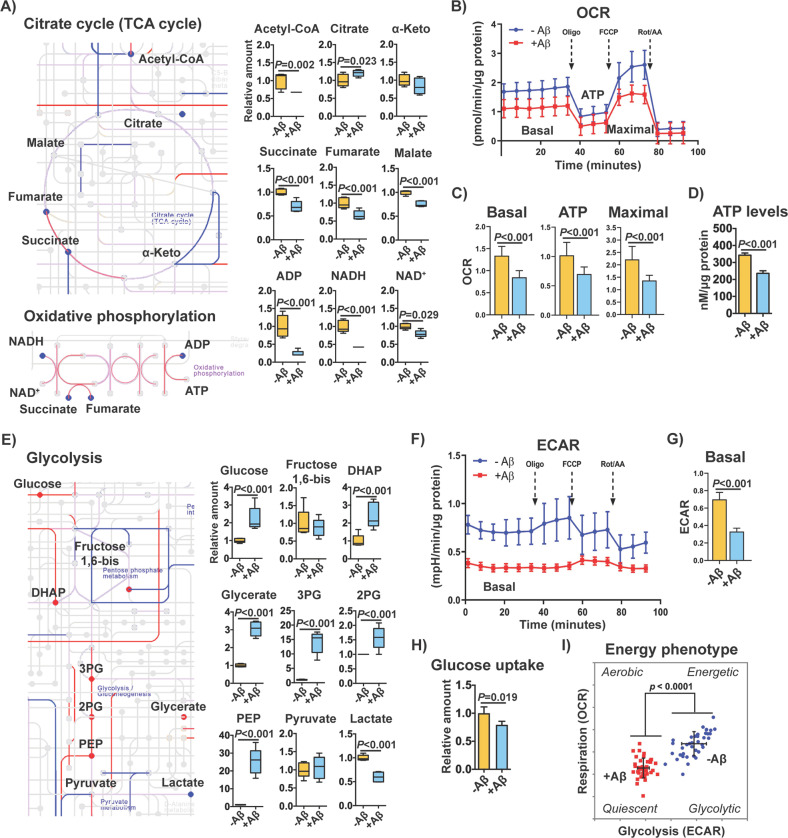
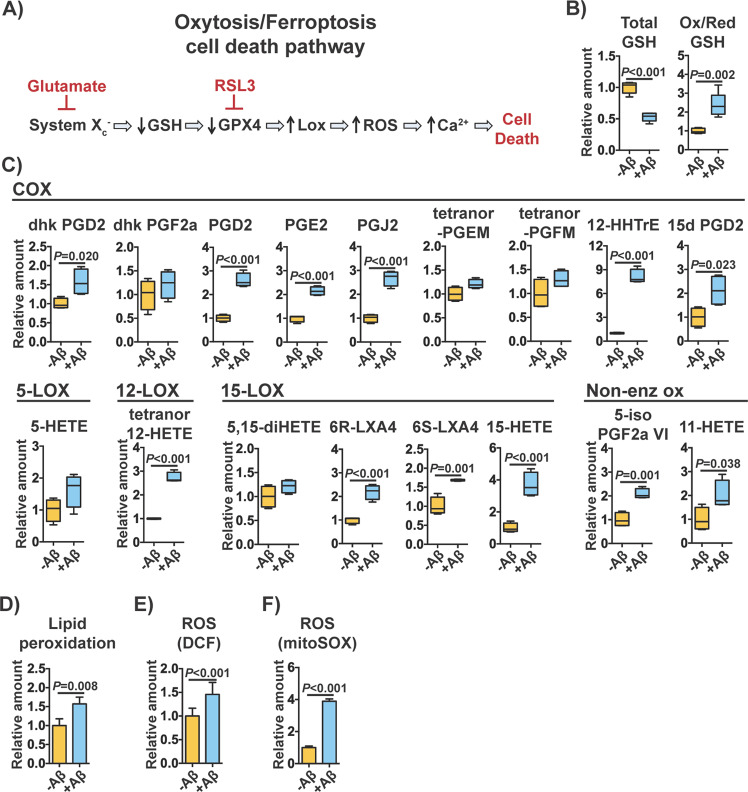
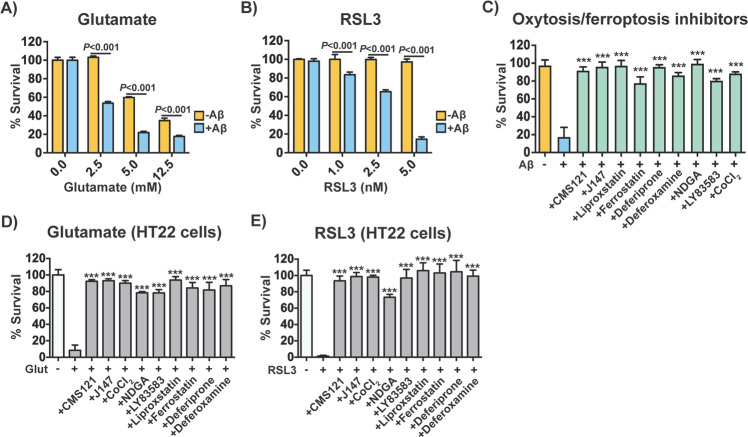
Amyloid beta (Aβ) accumulates within neurons in the brains of early stage Alzheimer's disease (AD) patients. However, the mechanism underlying its toxicity remains unclear. Here, a triple omics approach was used to integrate transcriptomic, proteomic, and metabolomic data collected from a nerve cell model of the toxic intracellular aggregation of Aβ. It was found that intracellular Aβ induces profound changes in the omics landscape of nerve cells that are associated with a pro-inflammatory, metabolic reprogramming that predisposes cells to die via the oxytosis/ferroptosis regulated cell death pathway. Notably, the degenerative process included substantial alterations in glucose metabolism and mitochondrial bioenergetics. Our findings have implications for the understanding of the basic biology of proteotoxicity, aging, and AD as well as for the development of future therapeutic interventions designed to target the oxytosis/ferroptosis regulated cell death pathway in the AD brain.


Conflict of interest statement

The authors declare that they have no conflict of interest.

Figures

Fig. 1
Fig. 1. Global effects of intracellular Aβ on the transcriptome, proteome and metabolome of MC65 nerve cells.
a Aβ aggregation in induced (+Aβ) MC65 nerve cells was confirmed by Western blotting at days 0, 1 and 2 and compared to non-induced (-Aβ) cells. Bars indicate C99 and full-length APP. b Cell survival was assayed on day 3. Unpaired two-tailed t-test (n = 3/group), data are mean ± SD. c Diagram illustrating the experimental approach. At day 2, non-induced (-Aβ) and induced (+Aβ) MC65 nerve cells were harvested for transcriptomic, proteomic and metabolomic analysis. PCA of the (d) top 500 most expressed genes (n = 5/group), (e) top 500 most expressed proteins (n = 4/group) and (f) total metabolites (n = 5/group). Ellipses show the 95% confidence interval of a t-distribution. Fold change levels and respective adjusted P values for all parameters can be found in supplementary Tables S1, S2 and S3. g Number of DE genes, DE proteins and DE metabolites upregulated (up) and downregulated (down) with Aβ. Number of total genes, proteins and metabolites detected/measured is indicated as the denominator. DE cutoff for the three parameters was FDR < 0.05 and absolute logFC > 0.5. Distribution of the (h) DE genes and (i) DE proteins per major subcellular compartment according to the Human Protein Atlas. Overlap ratio is the number of DE genes or DE proteins found altered per total genes or proteins described to be present in a given compartment. P values calculated by 1000 bootstrap are indicated.
Fig. 2
Fig. 2. Identification of the cellular pathways associated with Aβ toxicity.
a Venn diagram illustrating shared and uniquely affected KEGG pathways identified by GSEA that were upregulated (up) or downregulated (down) with Aβ. The red circle indicates the 37 KEGG pathways that were commonly altered in both transcriptomic and proteomic data. A list of those 37 pathways ordered by averaged enrichment score (-log10FDR) is shown. Pathways are grouped by biological process (cancer, inflammation/immune, oxytosis/ferroptosis and others). b Heatmap of the fold expression of the 40 DE genes (n = 5/group) and 21 DE proteins (n = 4/group) associated with the KEGG pathway ferroptosis. z-score = row-wise normalized log-transformed FPKM values for genes or batch-corrected log-transformed normalized average spectrum values for proteins. Distribution of the (c) 40 DE genes and (d) 21 DE proteins associated with ferroptosis per major subcellular compartment according to the Human Protein Atlas. Overlap ratio is the number of DE genes or DE proteins found altered per total genes or proteins described to be present in a given compartment. P values calculated by 1000 bootstrap are indicated. e Heatmap of the 299 DE metabolites organized by biological class (n = 5/group). z-score = row-wise normalized Metabolon normalized imputed spectrum values.
Fig. 3
Fig. 3. Effects of intracellular Aβ on central carbohydrate metabolism.
a Extracts from the biochemical chart in Fig. S1 depicting the TCA cycle and oxidative phosphorylation biochemical pathways. Upregulated genes and proteins are shown in red lines, and downregulated genes and proteins in blue lines. The color is purple when genes and proteins did not show the same direction of change. Upregulated and downregulated metabolites are indicated in red and blue circles, respectively. DE cutoff for the three parameters was FDR < 0.05 and absolute logFC > 0.5. Graphs with levels of the different metabolites measured are also shown (n = 5/group). The metabolites citrate, malate and NAD+ had an absolute logFC < 0.5 but are also represented. b Mitochondrial oxygen consumption rates (OCR) in non-induced (-Aβ) and induced (+Aβ) MC65 nerve cells after 2 days. c The graphs for respective basal respiration, ATP production and maximal respiration are indicated. Unpaired two-tailed t-test (n = 40/group). d Total ATP levels in non-induced (-Aβ) and induced (+Aβ) MC65 nerve cells. Unpaired two-tailed t-test (n = 3/group). e Extract from Fig. S1 depicting the glycolysis biochemical pathway, with respective changes in genes, proteins and metabolites. DE cutoff for the three parameters was FDR < 0.05 and absolute logFC > 0.5. Graphs with levels of the glycolytic metabolites measured are shown (n = 5/group). f Extracellular acidification rate (ECAR) in MC65 nerve cells after 2 days of Aβ induction. g Basal ECAR. Unpaired two-tailed t-test (n = 40/group). h Glucose uptake at day 2 after Aβ induction. Unpaired two-tailed t-test (n = 4/group). i Cellular energy phenotype, determined by plotting the basal levels of OCR versus ECAR. Aerobic: cells rely predominantly in mitochondrial respiration. Glycolytic: cells utilize predominantly glycolysis. Energetic: cells utilize both metabolic pathways. Quiescent: cells are not very energetic via either metabolic pathway. All data are mean ± SD.
Fig. 4
Fig. 4. Main features of oxytosis/ferroptosis in MC65 nerve cells exposed to Aβ toxicity.
a Diagram illustrating the molecular cascade characteristic of the oxytosis/ferroptosis cell death program. b Levels of total and oxidized/reduced GSH in MC65 nerve cells after 2 days of Aβ induction (n = 5/group). c Levels of eicosanoids derived from enzymatic (COX, 5-LOX, 12-LOX, 15-LOX) and non-enzymatic oxidation of AA measured at day 2. 13,14-dihydro-15-keto-prostaglandin D2 (dhk PGD2); 13,14-dihydro-15-keto-prostaglandin F2 alpha (dhk PGF2a); prostaglandin D2 (PGD2); prostaglandin E2 (PGE2); prostaglandin J2 (PGJ2); tetranor-prostaglandin EM (tetranor-PGEM); tetranor-prostaglandin EM (tetranor-PGFM); 12-hydroxyheptadecatrenoic acid (12-HHTrE); 15-deoxy-delta 12,14-prostaglandins D2 (15d PGD2); (5-HETE); tetranor-12-hydroxyeicosatetraenoic acid (tetranor 12-HETE); 5,15-dihydroxyeicosatetraenoic acid (5,15-diHETE); 6R-lipoxin A4 (6R-LXA4); 6S-lipoxin A4 (6S-LXA4); 15-hydroxyeicosatetraenoic acid (15-HETE); prostaglandin F2 alpha VI (5-iso PGF2aVI); 11-hydroxyeicosatetraenoic acid (11-HETE). Unpaired two-tailed t-test (n = 4/group). d Global lipid peroxidation at day 2. Unpaired two-tailed t-test (n = 3–4/group). e Whole cell ROS production at day 2. Unpaired two-tailed t-test (n = 11/group). f Mitochondrial superoxide production day 2. Unpaired two-tailed t-test (n = 3/group). All data are mean ± SD.
Fig. 5
Fig. 5. Induction and inhibition of oxytosis/ferroptosis in MC65 nerve cells.
Susceptibility of non-induced and induced MC65 nerve cells to (a) glutamate and (b) RSL3 assessed at day 2 after induction of Aβ. Two-way repeated measures ANOVA and Tukey post hoc corrected t-test (n = 3/group). c Effects of oxytosis/ferroptosis inhibitors in non-induced and induced MC65 nerve cells on day 3. The inhibitors tested included: CMS121 (1 μM), J147 (1 μM), liproxstatin (10 μM), ferrostatin (10 μM), deferiprone (75 μM), deferoxamine (20 μM), NDGA (0.5 μM), LY83583 (1 μM), and CoCl2 (25 μM). Two-way repeated measures ANOVA and Tukey post hoc corrected t-test (n = 6/group). Effects of oxytosis/ferroptosis inhibitors in HT22 nerve cells exposed to (d) glutamate (10 mM) and (e) RSL3 (100 nM). The oxytosis/ferroptosis inhibitors included: CMS121 (1 μM), J147 (1 μM), liproxstatin (5 μM), ferrostatin (5 μM), deferiprone (75 μM), deferoxamine (50 μM), NDGA (10 μM), LY83583 (0.5 μM), and CoCl2 (100 μM). Two-way repeated measures ANOVA and Tukey post hoc corrected t-test (n = 6/group). ***P < 0.001. All data are mean ± SD.

References

    1. Makin S. The amyloid hypothesis on trial. Nature. 2018;559:S4–S7. doi: 10.1038/d41586-018-05719-4. - DOI - PubMed
    1. Gouras GK, Almeida CG, Takahashi RH. Intraneuronal Abeta accumulation and origin of plaques in Alzheimer’s disease. Neurobiol. Aging. 2005;26:1235–1244. doi: 10.1016/j.neurobiolaging.2005.05.022. - DOI - PubMed
    1. LaFerla FM, Green KN, Oddo S. Intracellular amyloid-beta in Alzheimer’s disease. Nat. Rev. Neurosci. 2007;8:499–509. doi: 10.1038/nrn2168. - DOI - PubMed
    1. Takahashi RH, Nagao T, Gouras GK. Plaque formation and the intraneuronal accumulation of beta-amyloid in Alzheimer’s disease. Pathol. Int. 2017;67:185–193. doi: 10.1111/pin.12520. - DOI - PubMed
    1. Wirths O, Multhaup G, Bayer TA. A modified beta-amyloid hypothesis: intraneuronal accumulation of the beta-amyloid peptide–the first step of a fatal cascade. J. Neurochem. 2004;91:513–520. doi: 10.1111/j.1471-4159.2004.02737.x. - DOI - PubMed

Publication types

Substances