. 2020 Oct 6;11(1):5012.
doi: 10.1038/s41467-020-18783-0.

Changing travel patterns in China during the early stages of the COVID-19 pandemic

Collaborators, Affiliations

Changing travel patterns in China during the early stages of the COVID-19 pandemic

Hamish Gibbs et al. Nat Commun. .

Abstract

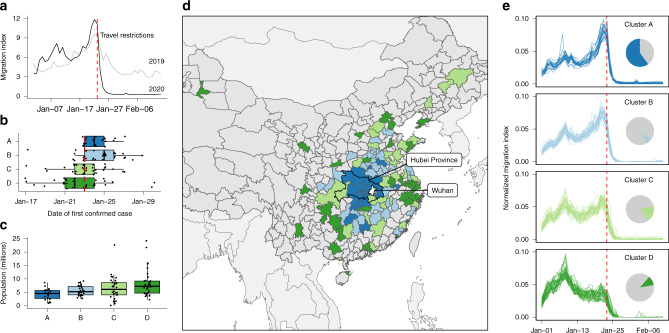
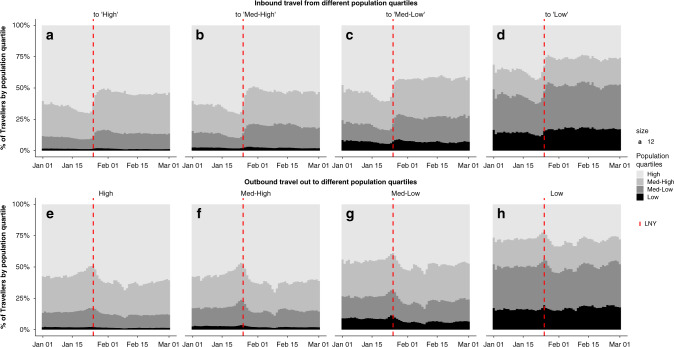
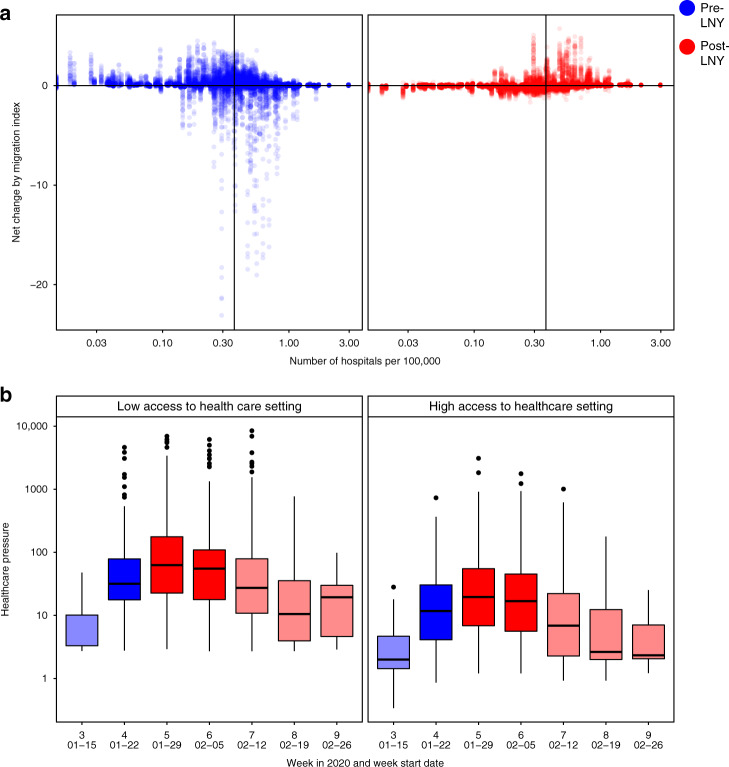
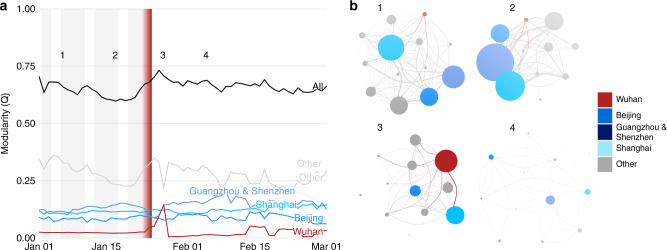
Understanding changes in human mobility in the early stages of the COVID-19 pandemic is crucial for assessing the impacts of travel restrictions designed to reduce disease spread. Here, relying on data from mainland China, we investigate the spatio-temporal characteristics of human mobility between 1st January and 1st March 2020, and discuss their public health implications. An outbound travel surge from Wuhan before travel restrictions were implemented was also observed across China due to the Lunar New Year, indicating that holiday travel may have played a larger role in mobility changes compared to impending travel restrictions. Holiday travel also shifted healthcare pressure related to COVID-19 towards locations with lower healthcare capacity. Network analyses showed no sign of major changes in the transportation network after Lunar New Year. Changes observed were temporary and did not lead to structural reorganisation of the transportation network during the study period.


Conflict of interest statement

The authors declare no competing interests.

Figures

Fig. 1
Fig. 1. Travel patterns between Wuhan and other connected prefectures.
The identified patterns of outbound travel from Wuhan: (a) the daily total outbound travel from Wuhan in 2019 and 2020; (b) timing of first case detection stratified by clusters of similar time series; (c) distribution of resident population sizes of individual prefectures (points); (d) map of prefectures and province-level cities showing the spatial distribution of timeseries clusters; (e) outbound travel trends from Wuhan to the most connected prefectures in China, stratified by clusters with similar time series. The clusters are defined by k-means clustering of the timeseries of outbound travel volume (see “Methods” section). For clusters in panels b and c, n = 22 (Cluster A), 34 (Cluster B) 33 (Cluster C), 36 (Cluster D). Boxplots in panels b and c display Median, IQR, and whiskers +/− 1.5 times IQR. The timeseries have been normalised by the total flow of each, to allow comparison of the profile. Inset pie charts show the total travel flux out of Wuhan prefecture by destinations in each cluster. The red dashed lines in panels a, b and e mark the beginning of LNY holidays. The colours in panels b, c, d and e indicate cluster membership (Cluster A, B, C or D).
Fig. 2
Fig. 2. Contribution of each population quartile to inbound and outbound travel.
Shading marks the population quartile with highest population quartiles in the lightest shade. The red dashed line shows the first day of LNY (25th January 2020). The figure displays the proportion of travel from all quartiles to High (a), Medium-high (b), Medium-low (c) and Low (d) population quartiles, as well as the proportion of travel to all quartiles originating from High (e), Medium-high (f), Medium-low (g) and Low (h) population quartiles.
Fig. 3
Fig. 3. Healthcare service availability and COVID-19-related healthcare pressure.
a The changes in traveller volume before (blue) and after (red) LNY. Net change is defined as inbound migration index minus outbound migration index. Thus, a negative change indicates more travellers leave than arrive while a positive value indicates more travellers arrive than leave. A solid line indicates the median level of healthcare capacity. b The changes in the healthcare pressure (log10 scale) related to COVID-19 each week in low and high healthcare capacity prefectures. Healthcare capacity is measured by the number of hospitals per 100,000 residents (nlow = 157, nhigh = 153). Healthcare pressure is measured by confirmed COVID-19 cases divided by healthcare capacity. Darker shade represents weeks when low healthcare capacity settings experienced significantly higher pressure than high healthcare capacity settings; lighter shade represents when differences are not statistically significant based on Mann–Whitney U test (5% type I error rate). The comparison for week 7 has p-value = 0.06. The boxplots in panel b display Median, IQR and whiskers +/− 1.5 times IQR.
Fig. 4
Fig. 4. Community structure of the movement network.
Community structure is measured through modularity, a metric defining the strength of connections within vs. between communities. The members of communities are determined by the Leiden algorithm. a The time series of total and sub-community modularity, and (b) snapshots of the community networks on days before and after the cordon sanitaire. The communities for Wuhan (red) and several major cities (blues) are highlighted in a and b in both the community and edges between communities. The time series shows working week (grey bars; missing after nation-wide social distancing measures), as well as the initiation and enforcement of restrictions in Wuhan (red gradient) over 23rd to 24th January. The communities (circles) are sized according to within-community migration index, while their connections are sized according to their between-community migration index.

References

    1. Wang, X., Liu, C., Mao, W., Hu, Z. & Gu, L. Tracing the largest seasonal migration on earth. Preprint at https://arxiv.org/abs/1411.0983 (2014).
    1. An, B. & Hu, L. This Year’s Spring Festival 2.99 Billion Passengers Will Travel. Xinhua Net (2019).
    1. Hao, Y. Go Home Early on the First Day of the Spring Festival. Xinhua Net (2020).
    1. Shi P, Keskinocak P, Swann JL, Lee BY. The impact of mass gatherings and holiday traveling on the course of an influenza pandemic: a computational model. BMC Public Health. 2010;10:778. doi: 10.1186/1471-2458-10-778. - DOI - PMC - PubMed
    1. Huang, H. Diary of Pneumonia|January 23: Wuhan is fully ‘closing the city’ to fully contain the epidemic. Caixin (2020).

Publication types