. 2020 Oct;4(10):1080-1090.
doi: 10.1038/s41562-020-00969-7. Epub 2020 Oct 6.

State-level needs for social distancing and contact tracing to contain COVID-19 in the United States

Affiliations

State-level needs for social distancing and contact tracing to contain COVID-19 in the United States

Weihsueh A Chiu et al. Nat Hum Behav. 2020 Oct.

Abstract

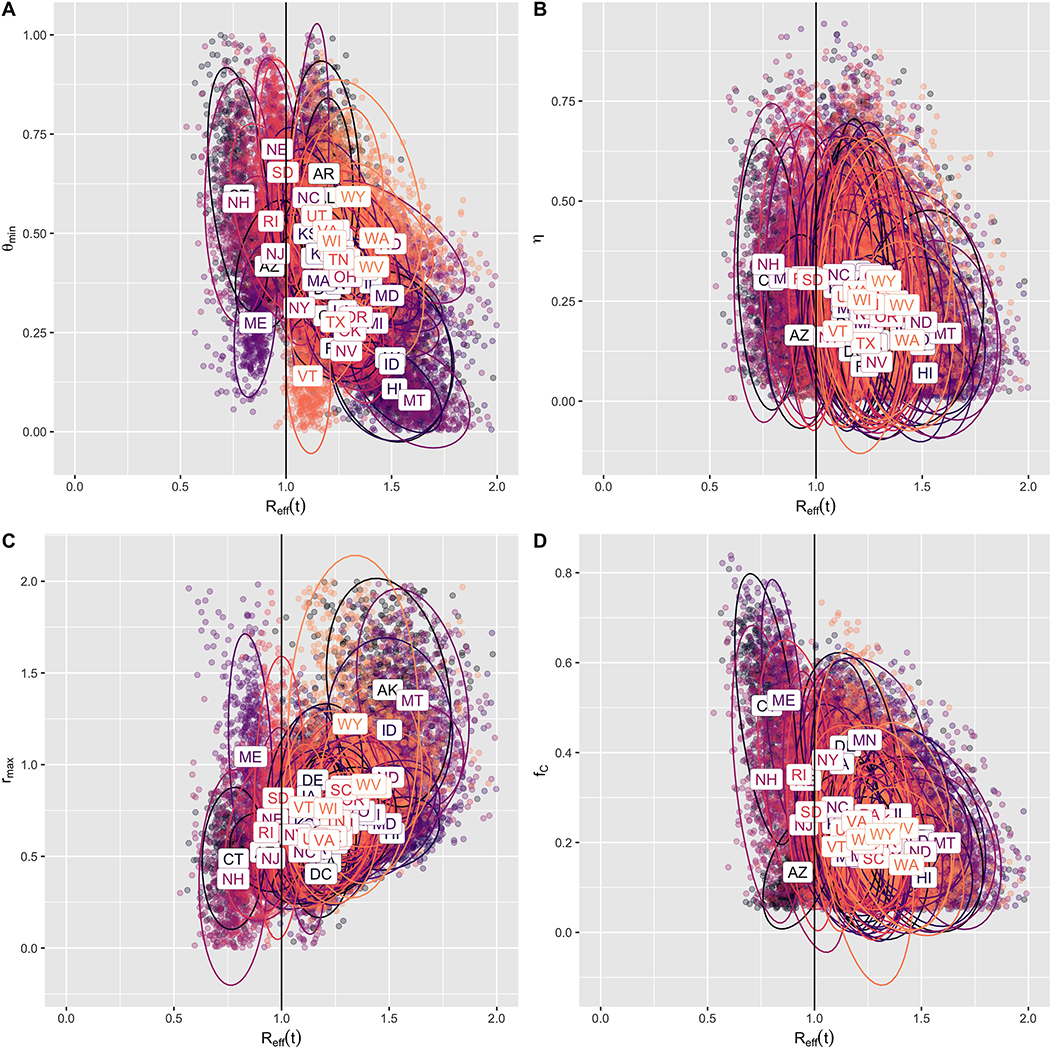
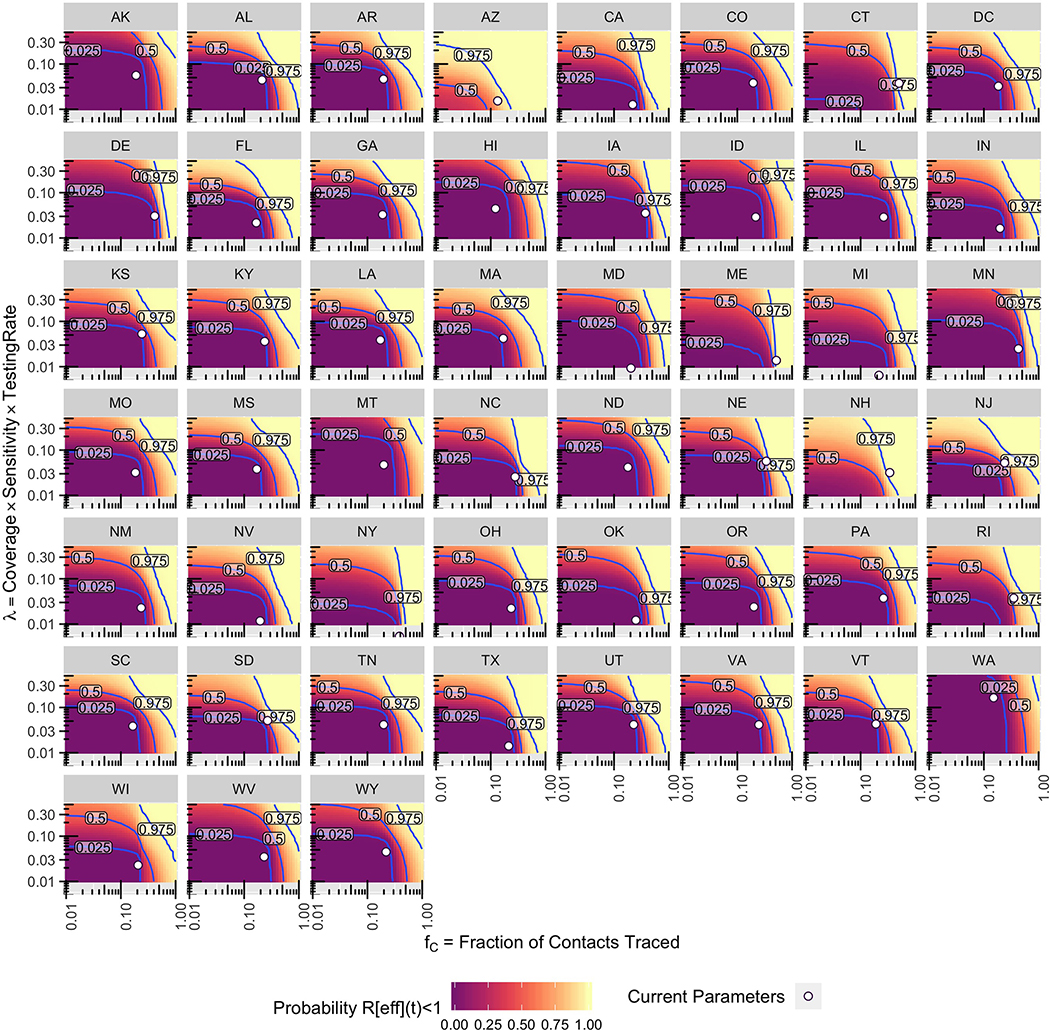
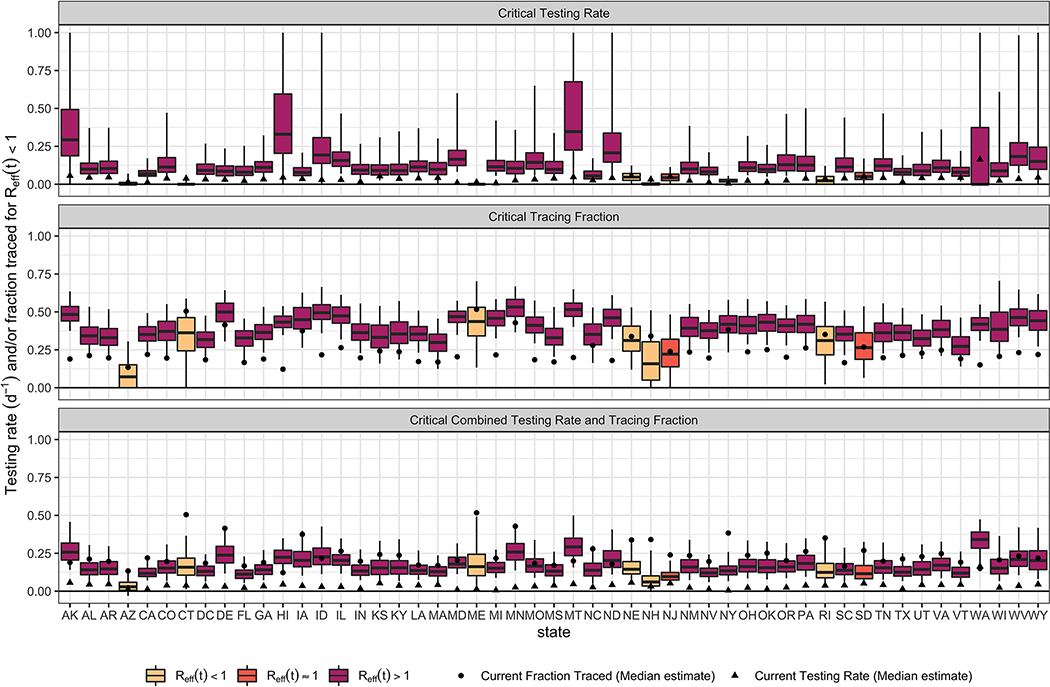
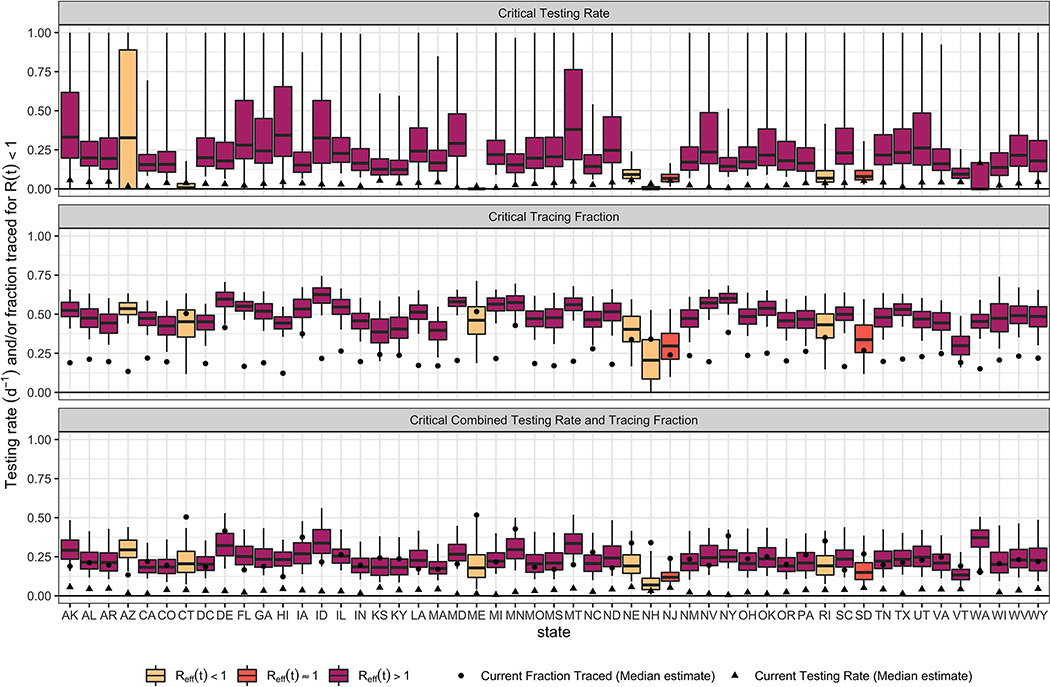
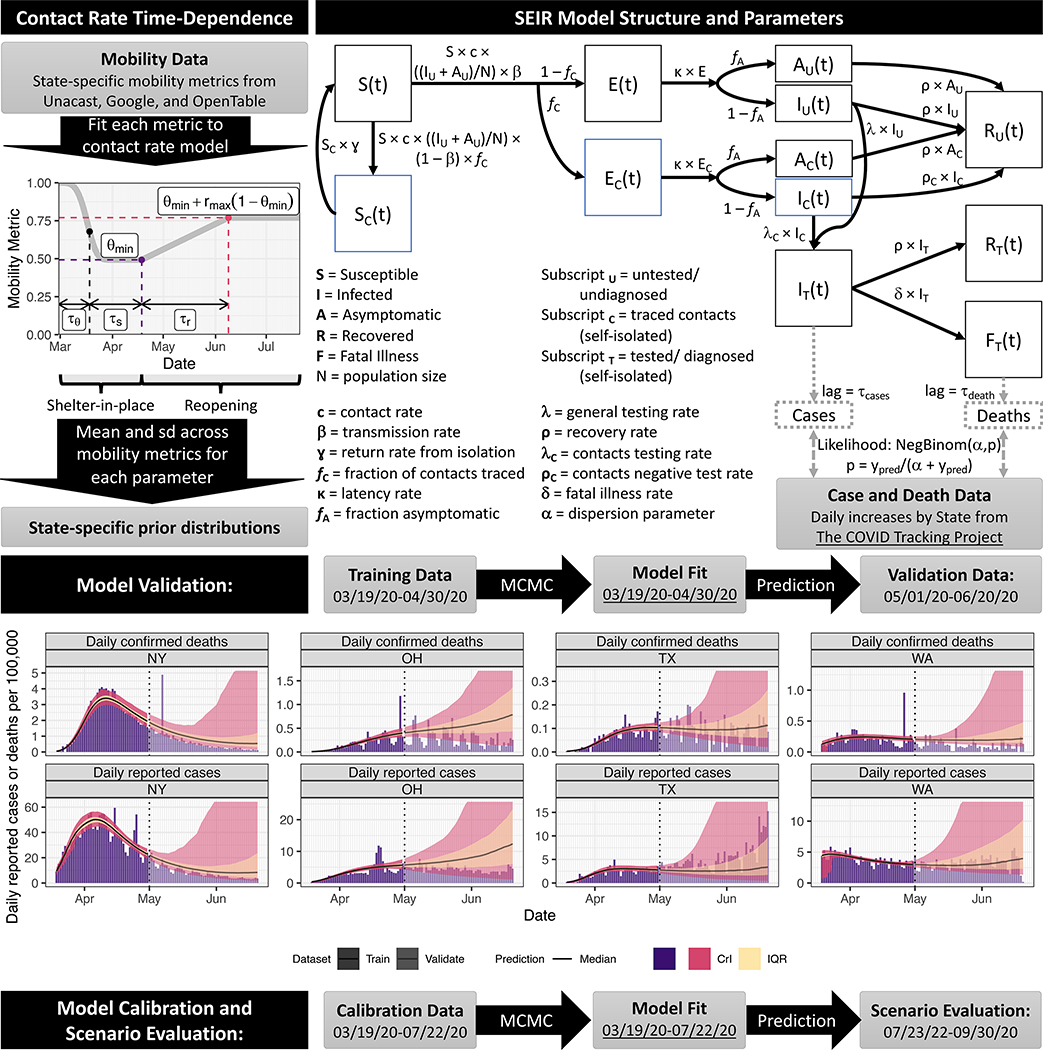
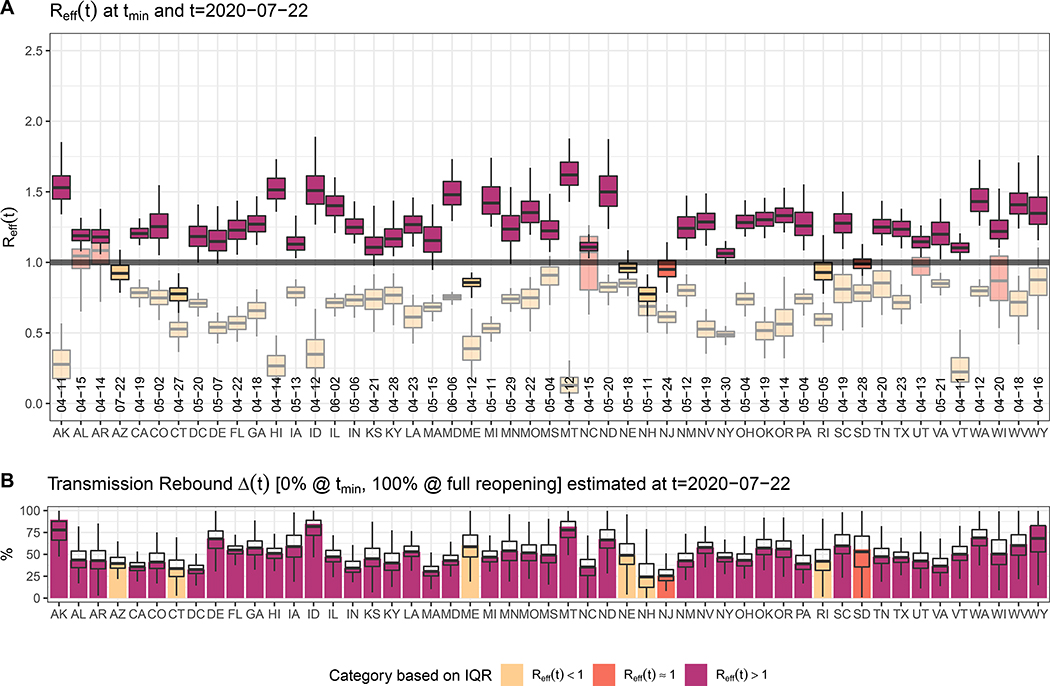
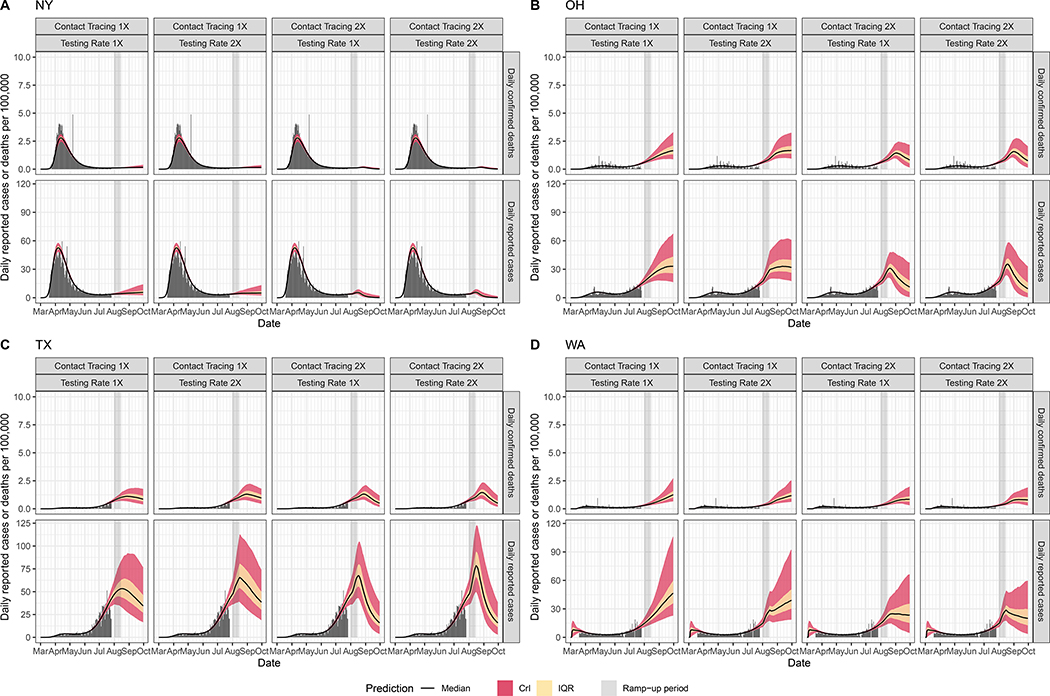
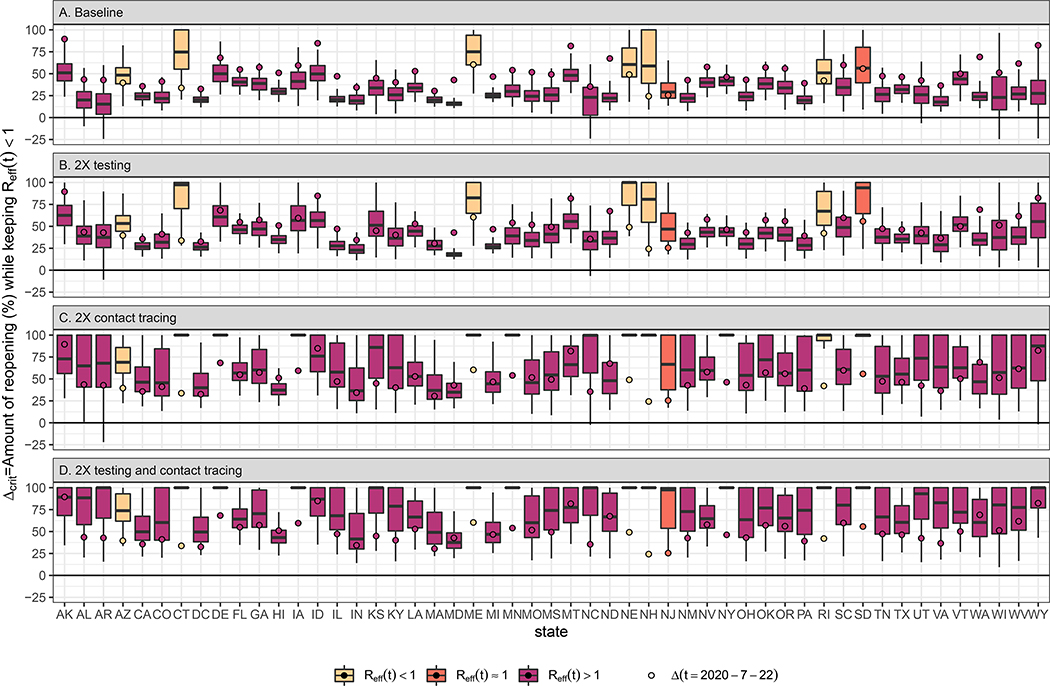
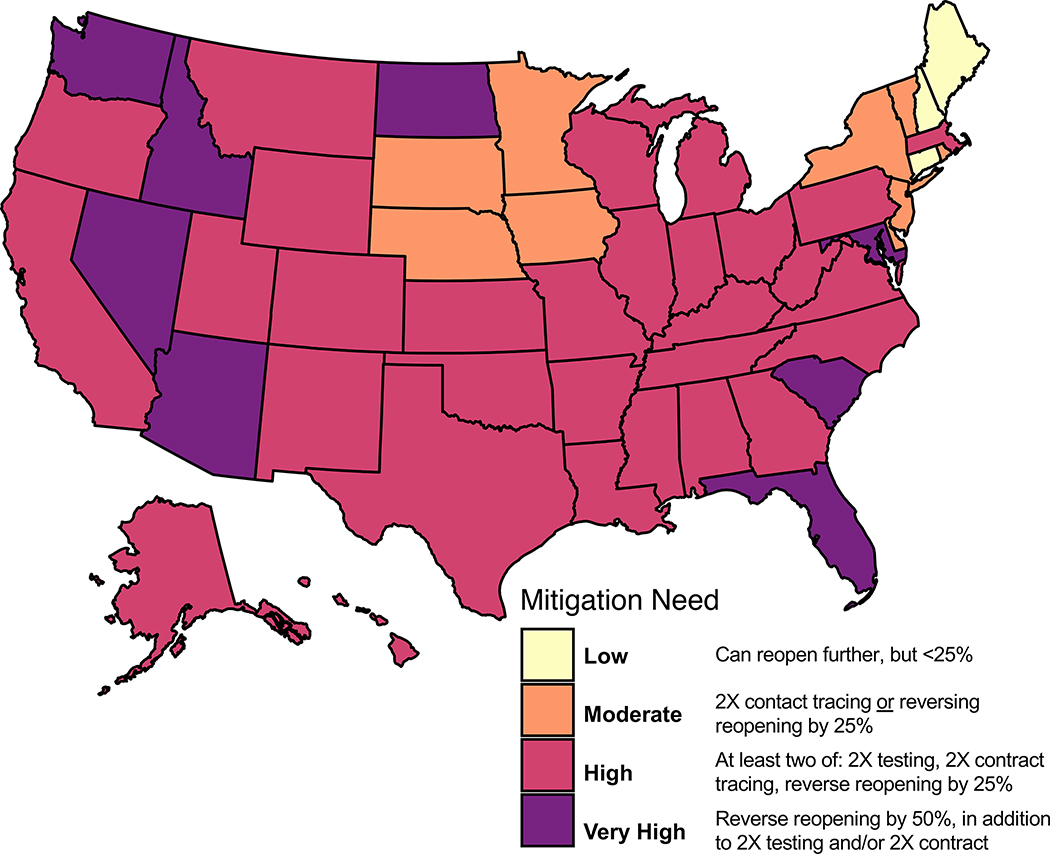
Starting in mid-May 2020, many US states began relaxing social-distancing measures that were put in place to mitigate the spread of COVID-19. To evaluate the impact of relaxation of restrictions on COVID-19 dynamics and control, we developed a transmission dynamic model and calibrated it to US state-level COVID-19 cases and deaths. We used this model to evaluate the impact of social distancing, testing and contact tracing on the COVID-19 epidemic in each state. As of 22 July 2020, we found that only three states were on track to curtail their epidemic curve. Thirty-nine states and the District of Columbia may have to double their testing and/or tracing rates and/or rolling back reopening by 25%, while eight states require an even greater measure of combined testing, tracing and distancing. Increased testing and contact-tracing capacity is paramount for mitigating the recent large-scale increases in US cases and deaths.


Conflict of interest statement

Competing interests

The authors declare no competing interests.

Figures

Extended Data Fig. 1:
Extended Data Fig. 1:. Correlations across states between Reff(t) and (A) θmin, (B) η, (C) Δ, and (D) fC.
For each state, 500 posterior samples are shown. Substantial state-to-state heterogeneity is evident in all parameters, with η,θmin, rmax, and fC contribute over 50% of the variance in Reff(t) under a linear model (estimated from ANOVA table [Table S1] using the sum-of-squares relative to the total sum-of-squares). For θmin, while lower values appear to be associated with greater current values of Reff(t) in a univariate model (linear model coefficient = −0.54, t statistic = −78.14, p < 2.2e-16, 95% CI = [−0.56,−0.53]), the correlation is positive in the multivariate model (coefficient = 0.11, t statistic = 13.65, p < 2.2e-16, 95% CI = [0.09, 0.13]). The other parameters correlate as expected: higher Reff(t) is correlated with lower contribution from hygiene practices (smaller η) (coefficient = −0.39, t statistic = −59.7, p < 2.2e-16, 95% CI = [−0.40,−0.38]), more reopening (larger rmax) (coefficient = 0.44, t statistic = 119.0, p < 2.2e-16, 95% CI = [0.43, 0.45]), and lower rates of contact tracing (smaller fC) (coefficient = −0.90, t statistic = −114.6, p < 2.2e-16, 95% CI = [−0.92, −0.89]).
Extended Data Fig. 2:
Extended Data Fig. 2:. Contour maps for each state of the probability that Reff(t) at different levels contact tracing fC and testing λ.
Contours are labelled as by median and 95% Credible interval, and current median estimates of fC and λ are shown by the circle.
Extended Data Fig. 3:
Extended Data Fig. 3:. Estimated testing and contact tracing rates needed for Reff(t) < 1 as of July 22, 2020.
Boxplots (line = median, box = IQR, whiskers = 95% CrI) are filled based on the estimated Reff(t) on July 22, 2020, as shown in the legend. Top panel is changing testing rate alone, the middle panel is changing contact tracing rate alone, and the bottom panel is changing both to the same value. Also shown are the current median estimates of the testing and contact tracing rates.
Extended Data Fig. 4:
Extended Data Fig. 4:. Estimated testing and contact tracing rates needed for R(t) < 1 with complete re-opening (i.e., removal of all social distancing and hygiene mitigation).
Boxplots (line = median, box = IQR, whiskers = 95% CrI) are filled based on the estimated Reff(t) on July 22, 2020, as shown in the legend. Top panel is changing testing rate alone, the middle panel is changing contact tracing rate alone, and the bottom panel is changing both to the same value. Also shown are the current median estimates of the testing and contact tracing rates.
Figure 1.
Figure 1.. SEIR model structure, parameter, data sources, and fitting/validation methods.
We used mobility data to constrain the time-dependence of the contact rate. We fitted the model to daily reported cases and confirmed deaths from March 19th to April 30th and validated its projections against data from May 1st to June 20th. On the model projections, the black solid line is the median, the pink band is the 95% credible interval (CrI) and the orange is the interquartile range (IQR). We show model fitting and validation for four states: New York (NY), Ohio (OH), Texas (TX), and Washington (WA).
Figure 2.
Figure 2.. Estimated effective reproduction number Reff and the level of reopening/rebound in transmission as of July 22nd, 2020 for all states.
(A) shows estimated Reff (median, IQR, and 95% CrI) across States. The figure shows the value of Reff on July 22nd, 2020, as well as the “minimum” value of Reff between March 19th, 2020 and July 22nd, 2020, in lighter shades of each color. It also includes the date of the minimum Reff. (B) shows the level of reopening/rebound in disease transmission in each state relative to its minimum value during state shelter-in-place (median, IQR, and 95% CrI).
Figure 3.
Figure 3.
Predicted time-course (median, IQR, and 95% CrI) of daily reported cases and deaths under different testing and contact tracing rates (1X and 2X) in New York (A), Ohio (B), Texas (C), and Washington State (D).
Figure 4.
Figure 4.. Reopening/rebound in transmission Δcrit permitted (0% = minimum shelter-in-place value, 100% = return to no restrictions) to keep Reff < 1.
(A) If testing and contact rates are unchanged, (B) testing rate is doubled, (C) contact tracing is doubled, or (D) both testing and contact tracing are doubled. Δ(t) the level of reopening/rebound in transmission on July 22nd, 2020 is shown by the circle. All boxplots show median, IQR, and 95% CrI.
Figure 5.
Figure 5.. State-specific level of mitigation needed as a July 22nd, 2020 to curtail the spread of COVID-19
(keeping R < 1 with at least 75% confidence, equivalent to the upper bound of the Interquartile range (IQR)). Categories based on evaluating scenarios with different combinations of baseline/doubling testing, baseline/doubling contact tracing, and baseline/+25%/−25% in the reopening parameter Δ. Categories are defined as follows: Very Low (no states): Can reopen further by >25% while keeping R(t)<1; Low (3 states): Can reopen further by < 25% with up to 2X increase in testing while keeping R(t)<1; Moderate (9 states): Requires 2X contact tracing or reversal of reopening by 25% to keep R(t)<1; High (30 states and DC): Requires multiple interventions (2X testing, 2X contract tracing, reversal of reopening by 25%) to keep R(t)<1; Very High (8 states): Reverse of reopening by 50%, combined with 2X testing and/or 2X contact tracing with to keep R(t)<1. The U.S. map shapefile is from the “usmap” R package, which is open source under GPL-3.

Update of

References

    1. Johns Hopkins Coronavirus Resource Center. Available at: https://coronavirus.jhu.edu/. (Accessed: 18th May 2020)
    1. Holshue ML et al. First Case of 2019 Novel Coronavirus in the United States. N. Engl. J. Med 382, 929–936 (2020). - PMC - PubMed
    1. Weiss P & Murdoch DR Clinical course and mortality risk of severe COVID-19. The Lancet 395, 1014–1015 (2020). - PMC - PubMed
    1. Wu Z & McGoogan JM Characteristics of and Important Lessons from the Coronavirus Disease 2019 (COVID-19) Outbreak in China: Summary of a Report of 72314 Cases from the Chinese Center for Disease Control and Prevention. JAMA - Journal of the American Medical Association 323, 1239–1242 (2020). - PubMed
    1. Kucharski AJ et al. Effectiveness of isolation, testing, contact tracing and physical distancing on reducing transmission of SARS-CoV-2 in different settings. medRxiv 2020.04.23.20077024 (2020). doi:10.1101/2020.04.23.20077024 - DOI - PMC - PubMed

Publication types

MeSH terms