

ATM inhibition synergizes with fenofibrate in high grade serous ovarian cancer cells
- PMID: 33024871
- PMCID: PMC7527645
- DOI: 10.1016/j.heliyon.2020.e05097
ATM inhibition synergizes with fenofibrate in high grade serous ovarian cancer cells
Abstract
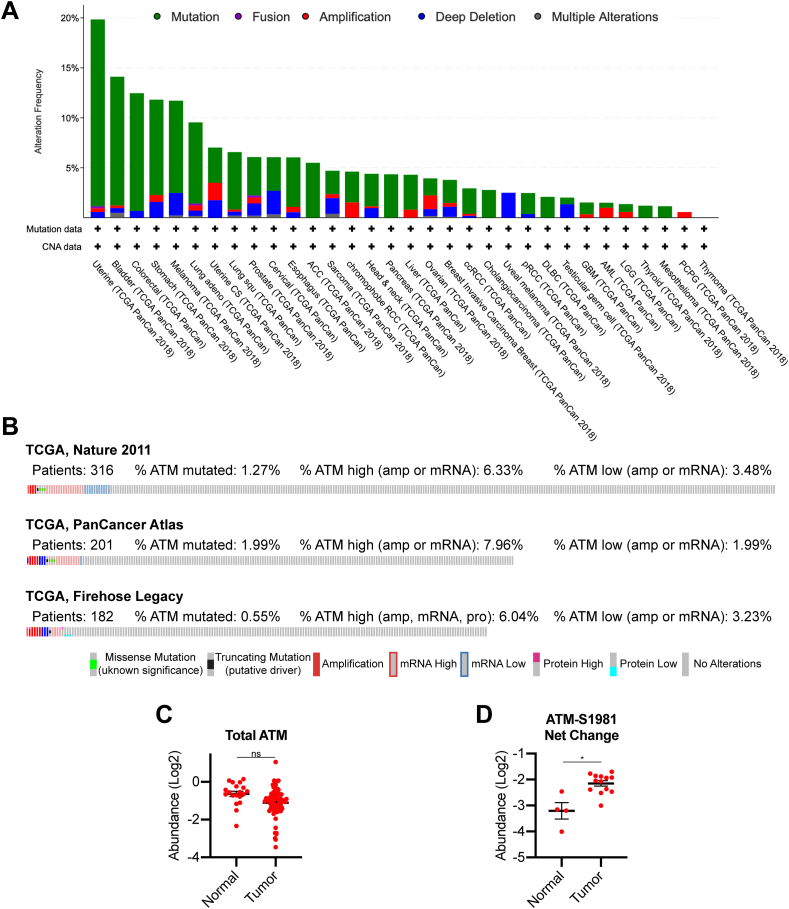
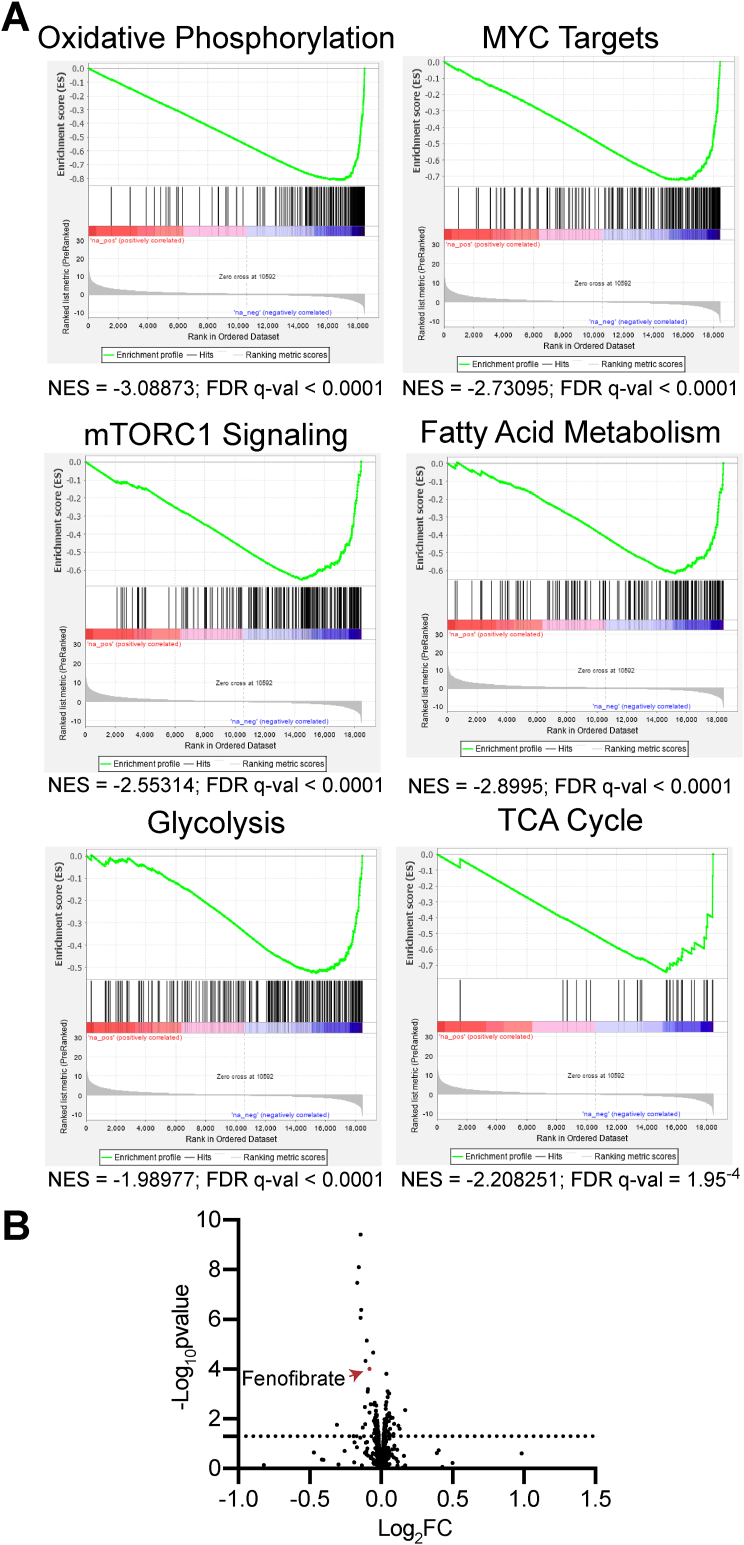
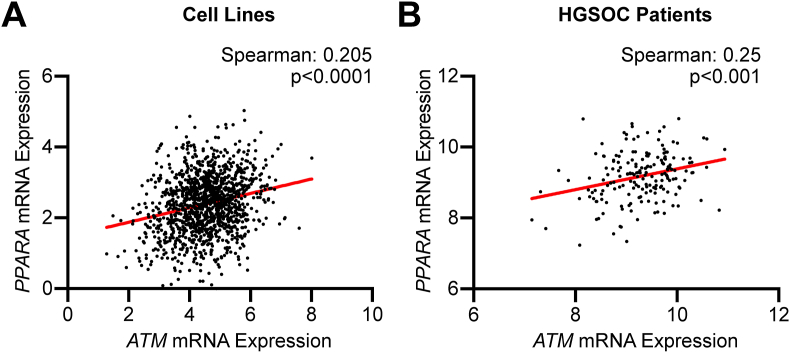
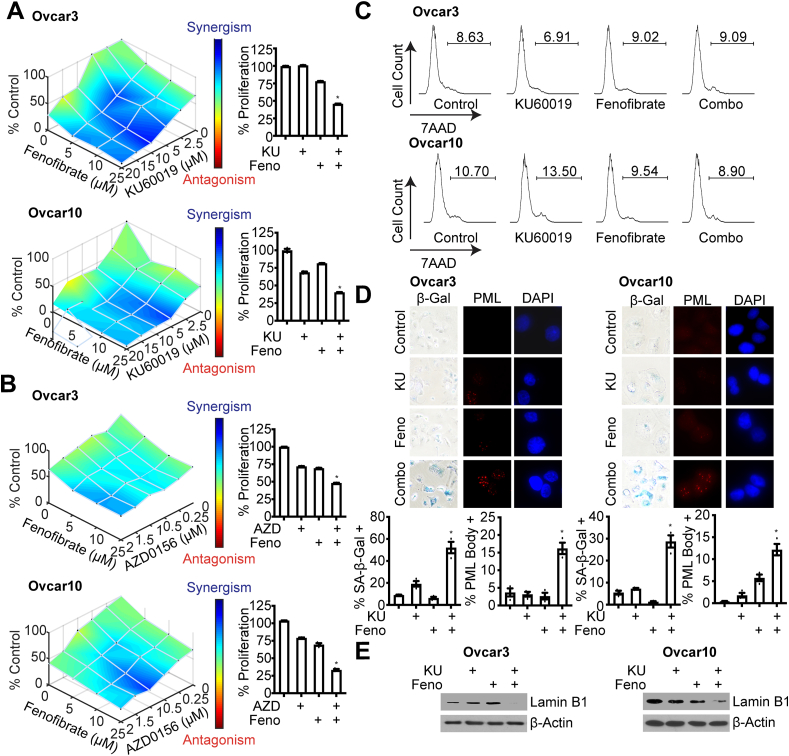
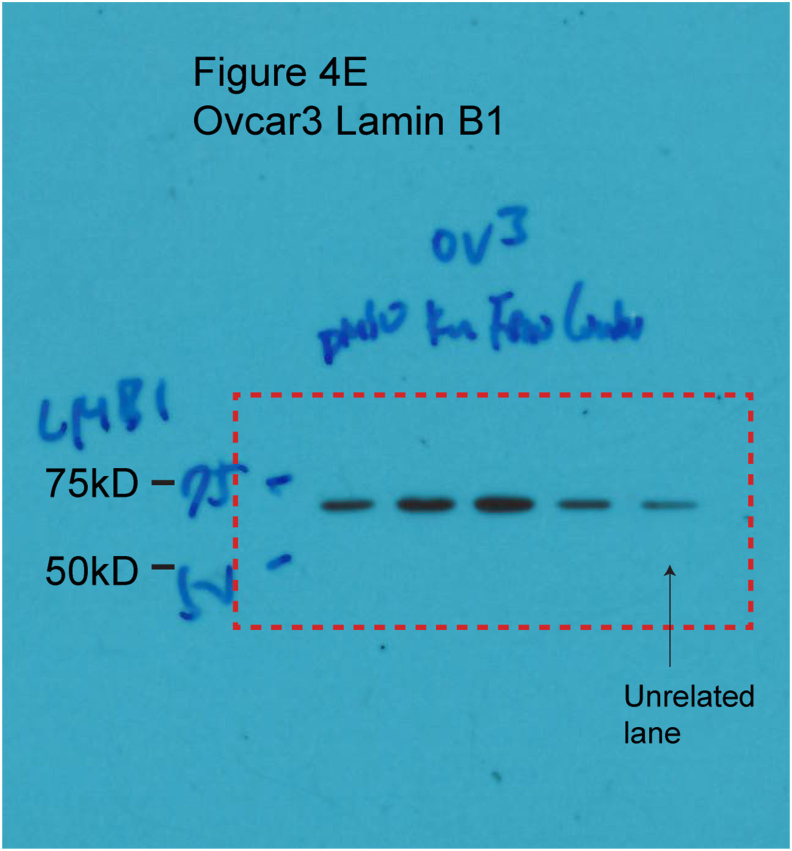
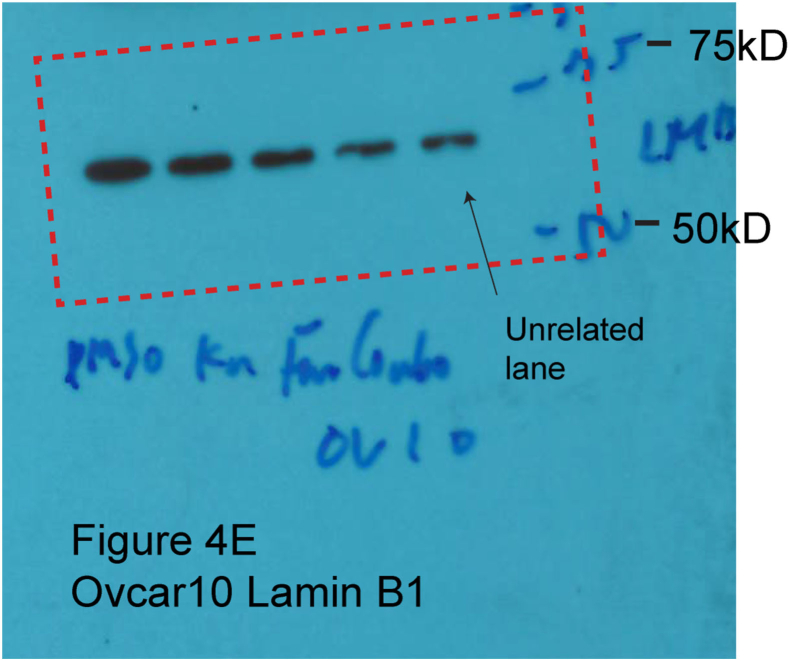
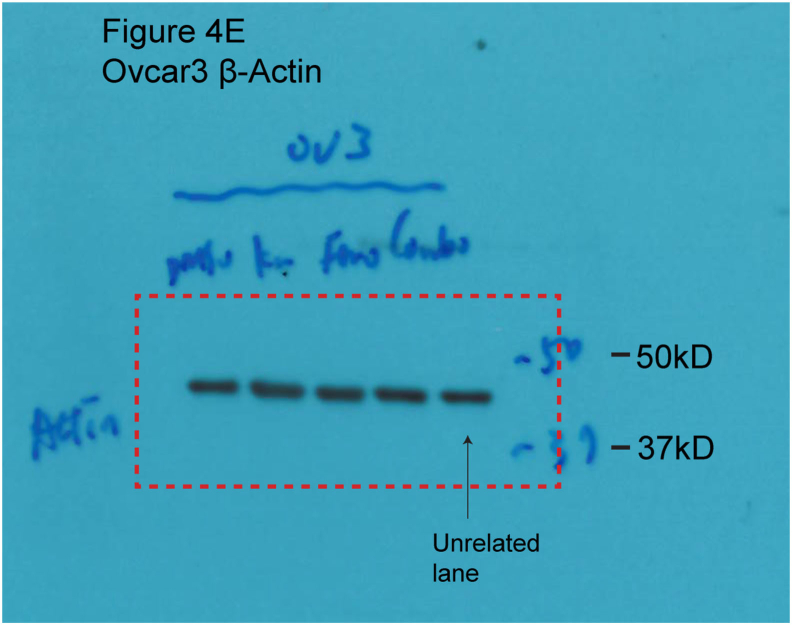
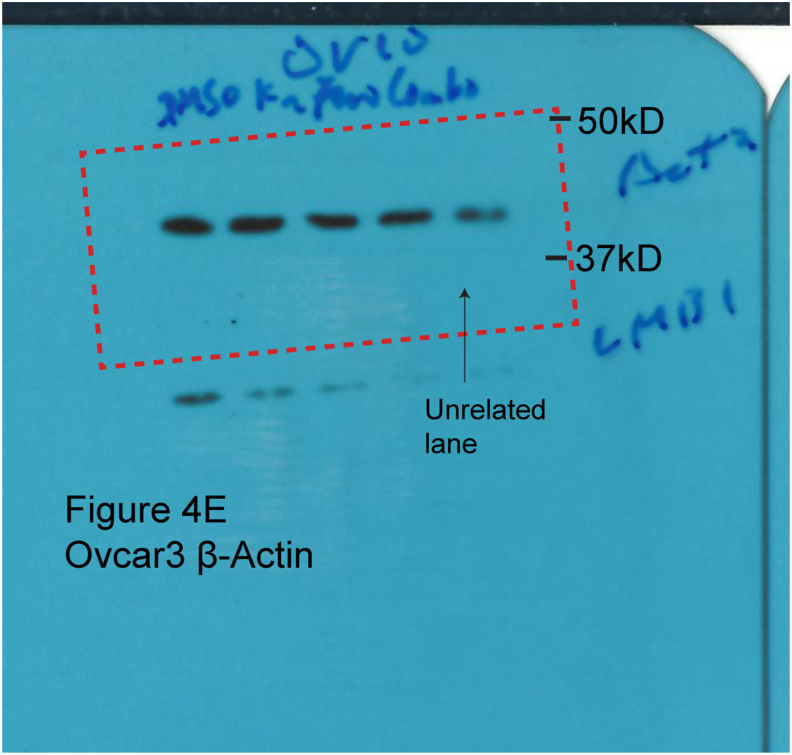
While therapies targeting deficiencies in the homologous recombination (HR) pathway are emerging as the standard treatment for high grade serous ovarian cancer (HGSOC) patients, this strategy is limited to the ~50% of patients with a deficiency in this pathway. Therefore, patients with HR-proficient tumors are likely to be resistant to these therapies and require alternative strategies. We found that the HR gene Ataxia Telangiectasia Mutated (ATM) is wildtype and its activity is upregulated in HGSOC compared to normal fallopian tube tissue. Interestingly, multiple pathways related to metabolism are inversely correlated with ATM expression in HGSOC specimens, suggesting that combining ATM inhibition with metabolic drugs would be effective. Analysis of FDA-approved drugs from the Dependency Map demonstrated that ATM-low cells are more sensitive to fenofibrate, a PPARα agonist that affects multiple cellular metabolic pathways. Consistently, PPARα signaling is associated with ATM expression. We validated that combined inhibition of ATM and treatment with fenofibrate is synergistic in multiple HGSOC cell lines by inducing senescence. Together, our results suggest that metabolic changes induced by ATM inhibitors are a potential target for the treatment of HGSOC.
Keywords: Biochemistry; Bioinformatics; Cancer research; Cell biology; Cellular metabolism; Cellular senescence; Drug combinations; Homologous recombination; Metabolite; Molecular biology; PPARa.
© 2020 Published by Elsevier Ltd.
Figures
Similar articles
-
Effects of Wee1 inhibitor adavosertib on patient-derived high-grade serous ovarian cancer cells are multiple and independent of homologous recombination status.Front Oncol. 2022 Aug 23;12:954430. doi: 10.3389/fonc.2022.954430. eCollection 2022. Front Oncol. 2022. PMID: 36081565 Free PMC article.
-
Checkpoint kinase 2 (Chk2) supports sensitivity to platinum-based treatment in high grade serous ovarian cancer.Gynecol Oncol. 2014 Jun;133(3):591-8. doi: 10.1016/j.ygyno.2014.03.557. Epub 2014 Mar 20. Gynecol Oncol. 2014. PMID: 24657486
-
Comparing mutation frequencies for homologous recombination genes in uterine serous and high-grade serous ovarian carcinomas: A case for homologous recombination deficiency testing in uterine serous carcinoma.Gynecol Oncol. 2020 Nov;159(2):381-386. doi: 10.1016/j.ygyno.2020.08.012. Epub 2020 Sep 6. Gynecol Oncol. 2020. PMID: 32900500
-
Improving PARP inhibitor efficacy in high-grade serous ovarian carcinoma: A focus on the immune system.Front Genet. 2022 Sep 9;13:886170. doi: 10.3389/fgene.2022.886170. eCollection 2022. Front Genet. 2022. PMID: 36159999 Free PMC article. Review.
-
Extracellular matrix in high-grade serous ovarian cancer: Advances in understanding of carcinogenesis and cancer biology.Matrix Biol. 2023 Apr;118:16-46. doi: 10.1016/j.matbio.2023.02.004. Epub 2023 Feb 11. Matrix Biol. 2023. PMID: 36781087 Review.
Cited by
-
Interplay between altered metabolism and DNA damage and repair in ovarian cancer.Bioessays. 2024 Aug;46(8):e2300166. doi: 10.1002/bies.202300166. Epub 2024 Jun 14. Bioessays. 2024. PMID: 38873912 Free PMC article. Review.
-
BRPF1 inhibition reduces migration and invasion of metastatic ovarian cancer cells, representing a potential therapeutic target.Sci Rep. 2025 Mar 4;15(1):7602. doi: 10.1038/s41598-025-92438-2. Sci Rep. 2025. PMID: 40038391 Free PMC article.
-
DNA Damage Response Alterations in Ovarian Cancer: From Molecular Mechanisms to Therapeutic Opportunities.Cancers (Basel). 2023 Jan 10;15(2):448. doi: 10.3390/cancers15020448. Cancers (Basel). 2023. PMID: 36672401 Free PMC article. Review.
-
Dietary fats and serum lipids in relation to the risk of ovarian cancer: a meta-analysis of observational studies.Front Nutr. 2023 Sep 14;10:1153986. doi: 10.3389/fnut.2023.1153986. eCollection 2023. Front Nutr. 2023. PMID: 37781114 Free PMC article. Review.
-
ATM inhibition drives metabolic adaptation via induction of macropinocytosis.J Cell Biol. 2023 Jan 2;222(1):e202007026. doi: 10.1083/jcb.202007026. Epub 2022 Nov 18. J Cell Biol. 2023. PMID: 36399181 Free PMC article.
References
Grants and funding
LinkOut - more resources
Full Text Sources
Molecular Biology Databases
Research Materials
Miscellaneous
