. 2020 Aug 4;4(10):1459-1476.
doi: 10.1002/hep4.1563. eCollection 2020 Oct.

Functionally Diverse Inflammatory Responses in Peripheral and Liver Monocytes in Alcohol-Associated Hepatitis

Affiliations

Functionally Diverse Inflammatory Responses in Peripheral and Liver Monocytes in Alcohol-Associated Hepatitis

Adam Kim et al. Hepatol Commun. .

Abstract

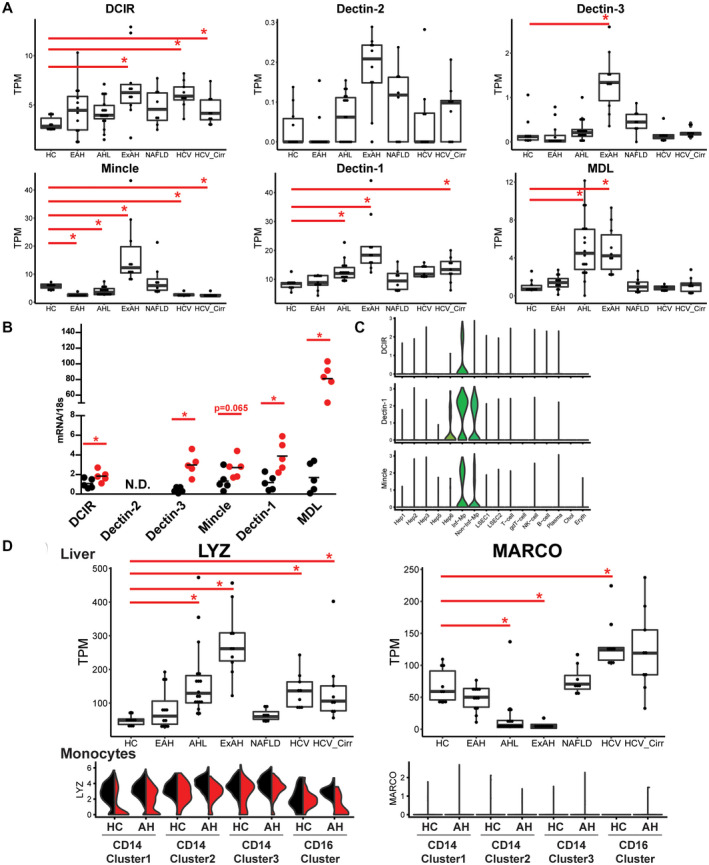
Alcohol-associated hepatitis (AH) is an acute inflammatory disease in which gut-microbial byproducts enter circulation and peripheral immune cells infiltrate the liver, leading to nonresolving inflammation and injury. Single-cell RNA sequencing of peripheral blood mononuclear cells isolated from patients with AH and healthy controls paired with lipopolysaccharide (LPS) challenge revealed how diverse monocyte responses are divided among individual cells and change in disease. After LPS challenge, one monocyte subtype expressed pro-inflammatory genes in both disease and healthy controls, while another monocyte subtype was anti-inflammatory in healthy controls but switched to pro-inflammatory in AH. Numerous immune genes are clustered within genomic cassettes, including chemokines and C-type lectin receptors (CTRs). CTRs sense byproducts of diverse microbial and host origin. Single-cell data revealed correlated expression of genes within cassettes, thus further diversifying different monocyte responses to individual cells. Monocyte up-regulation of CTRs in response to LPS caused hypersensitivity to diverse microbial and host-derived byproducts, indicating a secondary immune surveillance pathway up-regulated in a subset of cells by a closely associated genomic cassette. Finally, expression of CTR genes was higher in livers of patients with severe AH, but not other chronic liver diseases, implicating secondary immune surveillance in nonresolving inflammation in severe AH.


Figures

FIG. 1
FIG. 1
Single‐cell RNA‐seq reveals increased monocytes in AH. Patient PBMCs from 4 patients with AH and 4 healthy controls were cultured ex vivo ± low‐dose LPS (100 pg/mL) for 24 hours before scRNA‐seq. Transcriptomes from 18,433 cells were combined with publicly available PBMC data, and analyses were performed on the complete data set.33,34 (A) Dimensionality reduction using uniform manifold approximation and projection after normalization and combined in Seurat to ensure common cell types clustered without influence of disease or treatment‐specific gene‐expression differences (see Materials and Methods and Supporting Fig. S1). (B) Composition of each sample by cell type (clusters combined into broader cell types). (C) Average percentage of each cell type; error bars indicate SD. (D,E) Violin plots showing expression of monocyte genes separated by healthy control and AH. These data include basal (black) and LPS (red) treated cells. (D) Selected genes consisting of different monocyte markers, including classical monocyte markers (CD14, CD16), toll‐like receptors (TLR2, TLR4, and TLR8), CTR (MDL), complement receptor (C5AR1), and polarization gene (CD86). (E) Selected genes from the NKC organized by position on chromosome 12. Abbreviations: PDC, plasmacytoid dendritic cell; HC, healthy control; LPS, Lipopolysaccharide; UMAP, uniform manifold approximation and projection.
FIG. 2
FIG. 2
Differential gene‐expression analyses reveal the greatest effect of disease on CD14+ monocyte cluster 1A. Differential expression of genes in response to LPS was measured in all CD14+ monocyte clusters identified and characterized from the cells in Fig. 1; false discovery rate <0.01. Pathway analyses focused on genes up‐regulated by LPS in each monocyte cluster. (A) Circos plot showing commonly up‐regulated genes in response to LPS between CD14+ cluster 1 and CD14+ cluster 2 from healthy controls and patients with AH. (B) Venn diagram showing the number of overlapping genes up‐regulated by LPS between CD14+ clusters 1 and 2 in healthy controls and AH. Boxed are all genes contained in that subset. (C) Heatmap of pathway analyses of genes up‐regulated by LPS In CD14+ monocyte clusters 1 and 2. Abbreviations: AH, Alcohol‐associated Hepatitis; LPS, Lipopolysaccharide.
FIG. 3
FIG. 3
CD14+ monocyte cluster 1 shifts from anti‐inflammatory to pro‐inflammatory gene expression in AH. Violin plots showing expression of selected genes in different monocyte clusters with and without LPS in healthy controls and AH. These data include basal (black) and LPS (red) treated cells. (A) IL‐1p and CCL2 are pro‐inflammatory cytokines and chemokines not expressed in response to LPS in healthy control CD14+ monocyte cluster 1, but activated by LPS in AH. IFIT1, IFIT3, and OAS1 are antiviral genes activated by LPS in healthy‐control CD14+ monocyte cluster 1, but not expressed in AH. S100A9 is a DAMP repressed by LPS in healthy‐control CD14+ monocyte cluster 1, but activated by LPS in AH. (B) Selected pro‐inflammatory CXC‐type chemokines from the CXC‐ chemokine cassette organized by position on chromosome 4. (C) Model for AH‐induced changes in monocyte response to LPS. PBMCs have two distinct CD14+ monocyte subpopulations. In response to LPS, CD14+ monocyte cluster 1 in healthy controls expresses anti‐inflammatory genes, such as IFIT genes, and represses DAMPs such as S100A9 (not shown). Alternatively, CD14+ monocyte cluster 2 responds to LPS with pro‐inflammatory chemokine (CXCLs) and cytokine expression. Healthy control cells have a highly diverse response to LPS. However, in AH, both CD14+ clusters express pro‐inflammatory chemokines and cytokines, thus exacerbating inflammation in response to low‐dose LPS. CD14+ monocyte cluster 3 and CD16+ monocytes not shown. Abbreviations: AH, Alcohol‐associated Hepatitis; HC, healthy control; LPS, Lipopolysaccharide.
FIG. 4
FIG. 4
Cassettes of innate immune genes are coordinately regulated. Correlation analysis for the expression of genes within and around the NKC and CXC‐chemokine clusters using data for all monocytes identified. The regions of interest were ordered by chromosome position. Genes with low expression were removed. Only the upper and lower 2.5% of all correlation coefficients were plotted, representing the best correlations. In the data set, blue denotes significant positive correlations, and red denotes significant negative correlations. (A) Schematic of the entire NKC gene cluster, grouped as putative “mini‐cassettes” based on proximity. (B‐E) Combined heatmap of all pair‐wise correlation coefficients for genes from the NKC and the CXC‐chemokine cluster. NKC cluster is found at the bottom left and CXC‐chemokine cluster is found at the top right of each figure (black boxes). l (green box) denotes the NKC cassettes (including la and lb). Il (purple box) denotes the CXC‐chemokine cluster. Ill (black box) compares the NKC cassette with the CXC‐chemokine cassette. (B) Healthy control basal. (C) Healthy control with LPS. (D) AH basal. (E) AH with LPS. Abbreviations: AH, Alcohol‐associated Hepatitis; LPS, Lipopolysaccharide.
FIG. 5
FIG. 5
Cytotoxic T lymphocytes are unregulated in PBMCs from patients with AH after low‐dose LPS. (A) Schematic of the chromosomal organization of the CTR genes studied. MDL is on a separate chromosome. (B) PBMCs from patients with AH (n = 9) and age‐matched healthy controls (n = 7) were challenged with and without low‐dose LPS (100 pg/mL) for 24 hours, then messenger RNA expression was measured by quantitative PCR. Data were normalized to 18s ribosomal RNA. (C) Model for LPS‐induced secondary immune surveillance. Ethanol consumption leads to leakage of gut contents, including bacterial LPS, into portal and peripheral circulation. Peripheral monocytes, through TLR4 signaling, respond to LPS with up‐regulation of different innate immune gene cassettes. Some cells up‐regulate CXC‐chemokines, while other cells up‐regulate the NKC cluster. These CTR genes sense other gut‐derived microbial byproducts of fungal, viral, and bacterial origin. Coordinated expression of CTRs makes certain monocytes hypersensitive to these deleterious microbial byproducts. Abbreviations: AH, Alcohol‐associated Hepatitis; CTR, C‐type Lectin Receptor.
FIG. 6
FIG. 6
Cytotoxic T lymphocytes are up‐regulated in the livers of patients with severe AH. Comparison of gene‐expression results from bulk RNA‐seq of liver tissues from patients with different pathologies: healthy controls (HC, n = 10), early AH (EAH, n = 12), AH with liver failure (AHL, n = 18), explant tissue from patients with severe AH with emergency liver transplants (ExAH, n = 10), NAFLD (n = 8), HCV (n = 9), and HCV with cirrhosis (HCV Cirr, n = 9). Gene expression was measured by transcripts per million. (A) Boxplots of average expression for CTR genes in different disease groups; error bars indicate SD. Red stars indicate q <0.05 in comparison to healthy controls. (B) Quantitative PCR of CTR genes from liver‐explant tissue from patients with AH and healthy donor tissue. P < 0.05. (C) Violin plots of scRNA‐seq data from MacParland et al., showing the expression of CTRs in different liver cell types. (D) Top: Boxplots of average expression of different macrophage subset markers (LYZ, inflammatory macrophage; MARCO, noninflammatory macrophage) in different disease groups. Bottom: Expression of these markers in scRNA‐seq data from peripheral monocytes. Statistical significance for RNA‐seq was determined using the likelihood ratio test in Sleuth. Quantitative PCR was determined by least‐square means. Abbreviations: Chol, cholangiocyte; CTL, cytotoxic T lymphocyte; HEP, hepatocyte; Inf‐Mp, inflammatory macrophage; LSEC, liver sinusoidal endothelial cell; Non‐Inf‐Mp, noninflammatory macrophage; TPM, transcripts per million.
FIG. 7
FIG. 7
Mincle up‐regulation by low‐dose LPS causes sensitivity to the synthetic Mincle agonist TDB. PBMCs from patients with AH (n = 9) and age‐matched healthy controls (n = 7) were challenged with low‐dose LPS (1 pg/mL) for 24 hours then subsequently treated with the synthetic Mincle agonist TDB. Messenger RNA expression was measured by quantitative PCR. IL‐6 expression (A) and IL‐1p (B) expression; P < 0.05. Statistical significance for quantitative PCR was determined by least‐square means.

Similar articles

Cited by

References

    1. Brown GD, Willment JA, Whitehead L. C‐type lectins in immunity and homeostasis. Nat Rev Immunol 2018;18:374‐389. - PubMed
    1. Hoving JC, Wilson GJ, Brown GD. Signalling C‐type lectin receptors, microbial recognition and immunity. Cell Microbiol 2014;16:185‐194. - PMC - PubMed
    1. Gong T, Liu L, Jiang W, Zhou R. DAMP‐sensing receptors in sterile inflammation and inflammatory diseases. Nat Rev Immunol 2020;20:95‐112. - PubMed
    1. Irvine KM, Ratnasekera I, Powell EE, Hume DA. Causes and consequences of innate immune dysfunction in cirrhosis. Front Immunol 2019;10:293. - PMC - PubMed
    1. Zhou Z, Zhong W. Targeting the gut barrier for the treatment of alcoholic liver disease. Liver Res 2017;1:197‐207. - PMC - PubMed