Deficiency of miR-208a Exacerbates CCl4-Induced Acute Liver Injury in Mice by Activating Cell Death Pathways
- PMID: 33024918
- PMCID: PMC7527689
- DOI: 10.1002/hep4.1540
Deficiency of miR-208a Exacerbates CCl4-Induced Acute Liver Injury in Mice by Activating Cell Death Pathways
Abstract
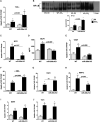
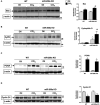
Acute liver injury (ALI) is associated with multiple cellular events such as necrosis, apoptosis, oxidative stress and inflammation, which can lead to liver failure. In this study, we demonstrate a new role of microRNA (miR)-208a in ALI. ALI was induced in wild-type (WT) and miR-208a knockout (KO) mice by CCl4 administration. Increased alanine aminotransferase and decreased hepatic miR-208a levels were found in WT mice after acute CCl4 treatment. Histopathological evaluations revealed increased necrosis and decreased inflammation in miR-208a KO compared with WT mice after CCl4 treatment. CCl4 treatment induced a higher alanine aminotransferase elevation and increased numbers of circulating extracellular vesicles (exosomes and microvesicles) in miR-208a KO compared with WT mice. We found increased CCl4-induced nuclear factor kappa B activation and tumor necrosis factor-α induction and decreased monocyte chemoattractant protein 1 levels in miR-208a KO compared with WT mice. Terminal deoxynucleotidyl transferase-mediated deoxyuridine triphosphate nick-end labeling assay indicated aggravated hepatic apoptosis and necrosis in CCl4 -treated miR-208a KO compared with WT mice. CCl4 treatment induced a greater increase in cleaved caspase-8, p18, and caspase-3 in miR-208a KO compared with WT mice. p53 is involved in various cell death pathways, including necrosis and apoptosis. Our in silico analysis revealed p53 as a predicted miR-208a target, and we found enhanced p53 and cyclophilin D protein expressions in miR-208a KO mice after CCl4 treatment. Increased liver injury in miR-208a KO mice was further associated with increased Bax (B cell lymphoma 2-associated X protein) and p21 expression. Our in vitro results indicated a role of miR-208a in cell death. We found that CCl4-induced cytotoxicity was partially rescued by miR-208a overexpression in RAW macrophages. Altogether, our results revealed a role of miR-208a in ALI in mice and suggest a role for miR-208a in regulating cell death.
© 2020 The Authors. Hepatology Communications published by Wiley Periodicals LLC, on behalf of the American Association for the Study of Liver Diseases.
Figures


Similar articles
-
Cav-1 deficiency promotes liver fibrosis in carbon tetrachloride (CCl4)-induced mice by regulation of oxidative stress and inflammation responses.Biomed Pharmacother. 2018 Jun;102:26-33. doi: 10.1016/j.biopha.2018.03.016. Epub 2018 Mar 14. Biomed Pharmacother. 2018. PMID: 29549726
-
Glycyrrhizic acid attenuates CCl₄-induced hepatocyte apoptosis in rats via a p53-mediated pathway.World J Gastroenterol. 2013 Jun 28;19(24):3781-91. doi: 10.3748/wjg.v19.i24.3781. World J Gastroenterol. 2013. PMID: 23840116 Free PMC article.
-
Protective Effect of Polydeoxyribonucleotide Against CCl4-Induced Acute Liver Injury in Mice.Int Neurourol J. 2020 Nov;24(Suppl 2):88-95. doi: 10.5213/inj.2040430.215. Epub 2020 Nov 23. Int Neurourol J. 2020. PMID: 33271005 Free PMC article.
-
Caveolin-1 Deficiency Protects Mice Against Carbon Tetrachloride-Induced Acute Liver Injury Through Regulating Polarization of Hepatic Macrophages.Front Immunol. 2021 Aug 9;12:713808. doi: 10.3389/fimmu.2021.713808. eCollection 2021. Front Immunol. 2021. PMID: 34434195 Free PMC article.
-
The involvement of Nrf2 in the protective effects of diallyl disulfide on carbon tetrachloride-induced hepatic oxidative damage and inflammatory response in rats.Food Chem Toxicol. 2014 Jan;63:174-85. doi: 10.1016/j.fct.2013.11.006. Epub 2013 Nov 15. Food Chem Toxicol. 2014. PMID: 24246655
Cited by
-
Dimeric Histidine as a Novel Free Radical Scavenger Alleviates Non-Alcoholic Liver Injury.Antioxidants (Basel). 2021 Sep 27;10(10):1529. doi: 10.3390/antiox10101529. Antioxidants (Basel). 2021. PMID: 34679664 Free PMC article.
-
Diagnostic and Prognostic Significance of microRNA-208a in Acute Myocardial Infarction.Dis Markers. 2022 May 14;2022:7030722. doi: 10.1155/2022/7030722. eCollection 2022. Dis Markers. 2022. PMID: 35607440 Free PMC article.
-
Exosomal microRNAs as diagnostic and therapeutic biomarkers in non-malignant liver diseases.Arch Pharm Res. 2021 Jun;44(6):574-587. doi: 10.1007/s12272-021-01338-2. Epub 2021 Jun 24. Arch Pharm Res. 2021. PMID: 34165701 Free PMC article. Review.
-
Extracellular vesicles in inflammation: Focus on the microRNA cargo of EVs in modulation of liver diseases.J Leukoc Biol. 2022 Jan;111(1):75-92. doi: 10.1002/JLB.3MIR0321-156R. Epub 2021 Nov 10. J Leukoc Biol. 2022. PMID: 34755380 Free PMC article. Review.
-
Protective effect of LNA-anti-miR-132 therapy on liver fibrosis in mice.Mol Ther Nucleic Acids. 2021 May 14;25:155-167. doi: 10.1016/j.omtn.2021.05.007. eCollection 2021 Sep 3. Mol Ther Nucleic Acids. 2021. PMID: 34458001 Free PMC article.
References
-
- van Rooij E, Sutherland LB, Qi X, Richardson JA, Hill J, Olson EN. Control of stress‐dependent cardiac growth and gene expression by a microRNA. Science 2007;316:575‐579. - PubMed
-
- Oliveira‐Carvalho V, Carvalho VO, Bocchi EA. The emerging role of miR‐208a in the heart. DNA Cell Biol 2013;32:8‐12. - PubMed
-
- Sun X, Jiang S, Liu J, Wang H, Zhang Y, Tang SC, et al. MiR‐208a stimulates the cocktail of SOX2 and beta‐catenin to inhibit the let‐7 induction of self‐renewal repression of breast cancer stem cells and formed miR208a/let‐7 feedback loop via LIN28 and DICER1. Oncotarget 2015;6:32944‐32954. - PMC - PubMed
Grants and funding
LinkOut - more resources
Full Text Sources
Research Materials
Miscellaneous

