. 2021 Jan;141(1):101-116.
doi: 10.1007/s00401-020-02230-x. Epub 2020 Oct 6.

Epigenomic, genomic, and transcriptomic landscape of schwannomatosis

Affiliations

Epigenomic, genomic, and transcriptomic landscape of schwannomatosis

Sheila Mansouri et al. Acta Neuropathol. 2021 Jan.

Erratum in

  • Correction to: Epigenomic, genomic, and transcriptomic landscape of schwannomatosis.
    Mansouri S, Suppiah S, Mamatjan Y, Paganini I, Liu JC, Karimi S, Patil V, Nassiri F, Singh O, Sundaravadanam Y, Rath P, Sestini R, Gensini F, Agnihotri S, Blakeley J, Ostrow K, Largaespada D, Plotkin SR, Stemmer-Rachamimov A, Ferrer MM, Pugh TJ, Aldape KD, Papi L, Zadeh G. Mansouri S, et al. Acta Neuropathol. 2021 Jan;141(1):117. doi: 10.1007/s00401-020-02241-8. Acta Neuropathol. 2021. PMID: 33112994 Free PMC article. No abstract available.

Abstract

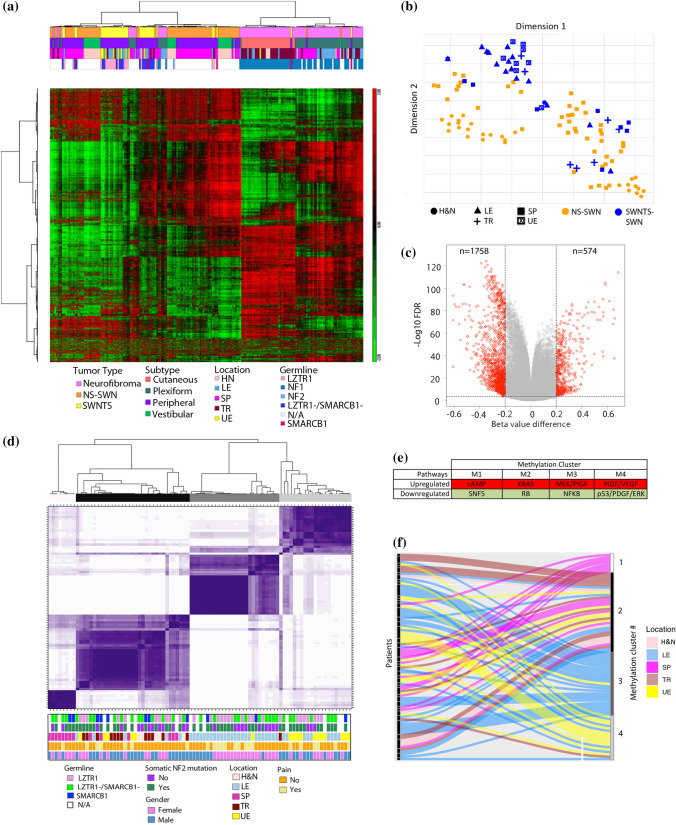
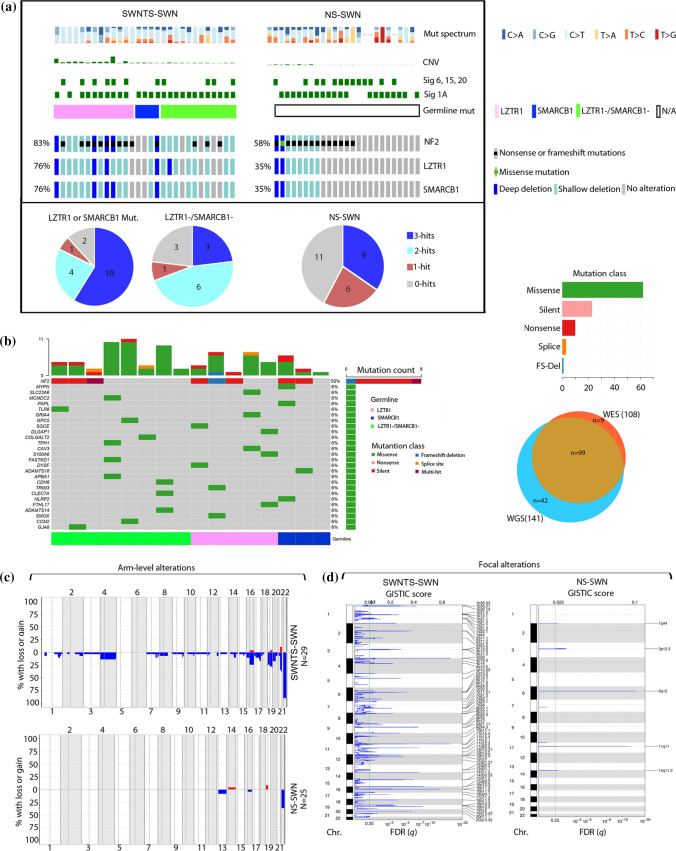
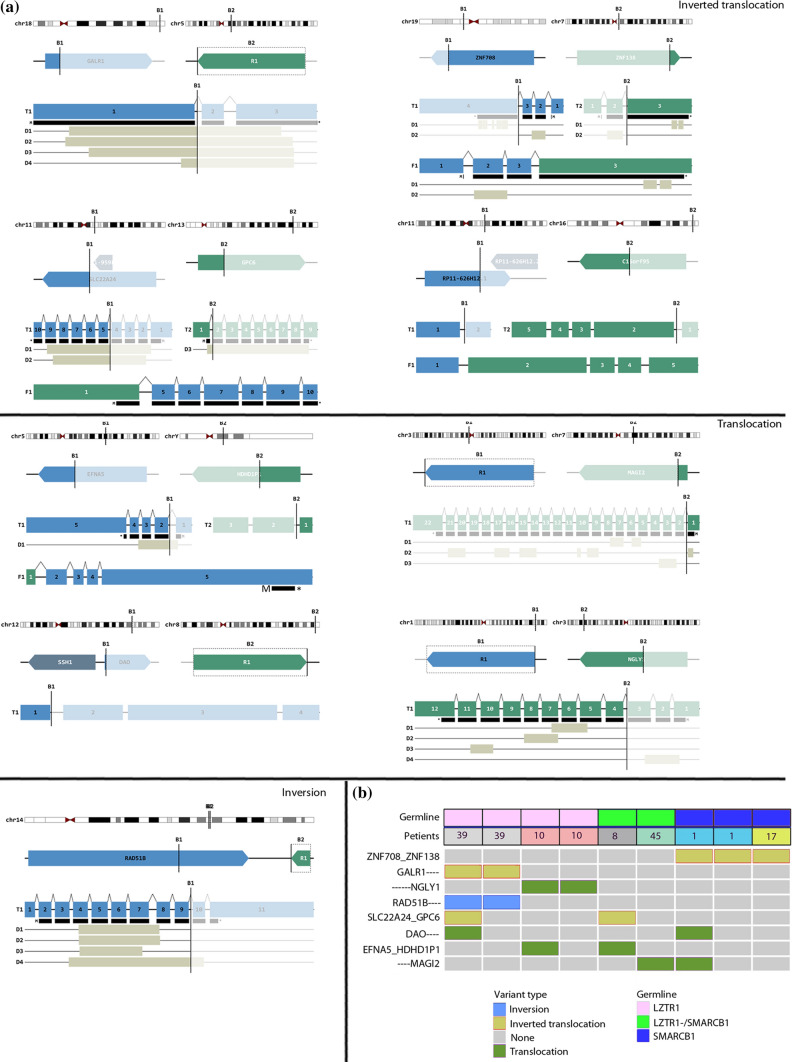
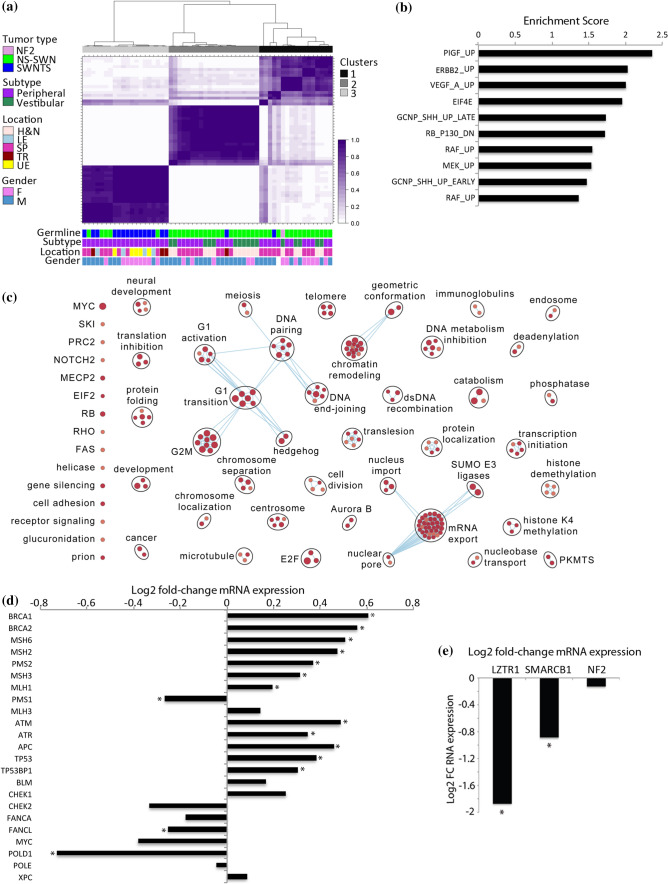
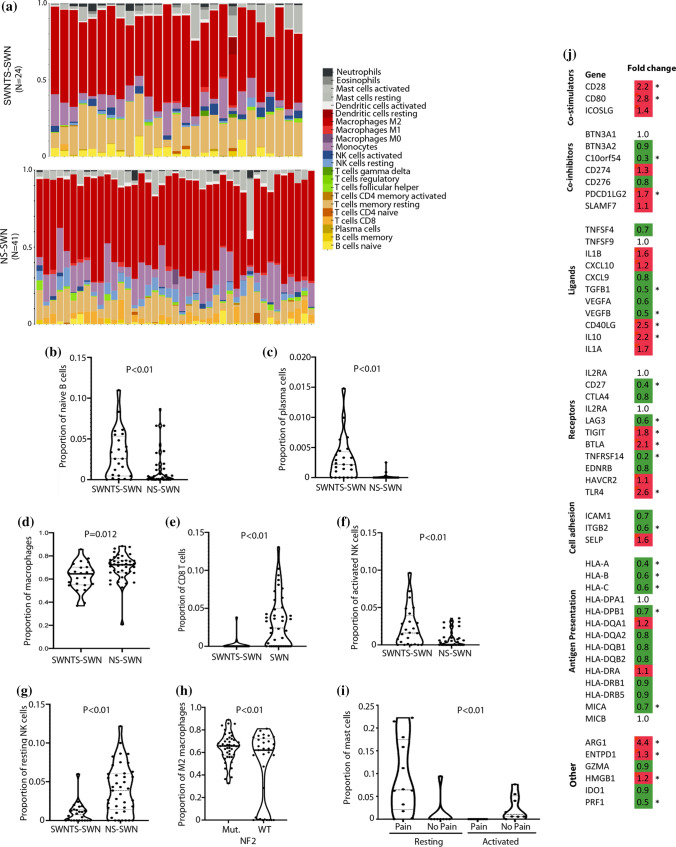
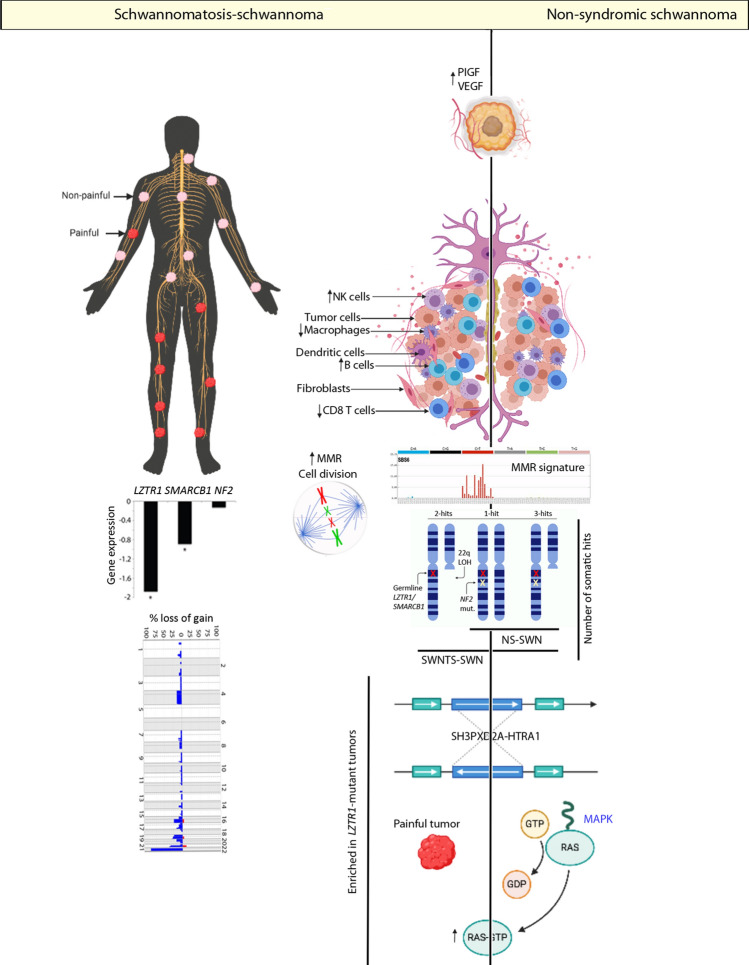
Schwannomatosis (SWNTS) is a genetic cancer predisposition syndrome that manifests as multiple and often painful neuronal tumors called schwannomas (SWNs). While germline mutations in SMARCB1 or LZTR1, plus somatic mutations in NF2 and loss of heterozygosity in chromosome 22q have been identified in a subset of patients, little is known about the epigenomic and genomic alterations that drive SWNTS-related SWNs (SWNTS-SWNs) in a majority of the cases. We performed multiplatform genomic analysis and established the molecular signature of SWNTS-SWNs. We show that SWNTS-SWNs harbor distinct genomic features relative to the histologically identical non-syndromic sporadic SWNs (NS-SWNS). We demonstrate the existence of four distinct DNA methylation subgroups of SWNTS-SWNs that are associated with specific transcriptional programs and tumor location. We show several novel recurrent non-22q deletions and structural rearrangements. We detected the SH3PXD2A-HTRA1 gene fusion in SWNTS-SWNs, with predominance in LZTR1-mutant tumors. In addition, we identified specific genetic, epigenetic, and actionable transcriptional programs associated with painful SWNTS-SWNs including PIGF, VEGF, MEK, and MTOR pathways, which may be harnessed for management of this syndrome.

Keywords: Genomics; LZTR1; MAPK; Pain; Peripheral nerve sheath tumors; Schwannomatosis.


Conflict of interest statement

The authors declare no competing interests.

Figures

Fig. 1
Fig. 1
DNA methylation landscape of SWNTS-SWNs in the spectrum of benign PNSTs. a Unsupervised hierarchical clustering of the top 2000 most variably methylated CpG sites in SWNTS-SWNs (N = 42), NS-SWNs (N = 73), NF2-SWNs (N = 2), and NF (N = 90). Color codes to the right denote features including tumor type, anatomic location, and germline mutations. b tSNE plot generated using the top 10,000 most variably methylated CpG sites in SWNTS-SWNs and NS-SWNs. Symbols denote anatomic location associated with each tumor. c Supervised analysis shows differentially methylated CpG sites between SWNTS-SWNs and NS-SWNs (absolute mean beta value difference > 0.2, q < 0.0005) presented as a volcano plot. d Consensus clustering of the 2000 most variably methylated CpG sites in SWNTS-SWNs (N = 88) showing four stable clusters. Color codes to the right denote germline mutations status, tumor location, somatic mutations in NF2, sex, and pain reported by the patients. e Key pathways differentially regulated in each methylation cluster based on GSEA C6 analysis. f Sankey plot showing the distribution of tumors from different anatomic locations resected from same individuals across the four methylation clusters. Tumor location codes: LE lower extremity, UE upper extremity, SP spinal, TR truncal, H&N head and neck
Fig. 2
Fig. 2
Landscape of somatic alterations in SWNTS-SWNs. a Oncoprint showing results from WES analysis of 29 SWNTS-SWNs and 25 NS-SWNs. Mutation spectrum and CNV fraction are plotted on the top. COSMIC signatures 1A, 6, 15, and 20 in each cohort are also depicted. Somatic mutations and deletions in NF2, LZTR1, and SMARCB1 are shown. Distribution of zero, one, two, or three somatic hits across the two cohorts are shown as pie charts below. b Oncoprint showing top deleterious somatic variants (based on SIFT and PolyPhen2) identified by both WES and WGS methods in 16 overlapping samples. Clinical and molecular annotations are depicted above and below the oncoprint. Venn diagram to the right shows the number of variants called by both WES and WGS. c Plots showing compounded arm-level CNV in SWNTS-SWNs versus NS-SWNs. d GISTIC plots showing significant focal deletions in SWNTS-SWNs and NS-SWNs
Fig. 3
Fig. 3
Structural variants in SWNTS-SWNs. a Diagrams showing the SVs identified in SWNTS-SWNs using WGS data on 22 tumors. Only recurrent SVs present in at least 2 samples are shown. The breakpoints are given by B1 and B2. The top level depicts the breakpoint positions in each chromosome, the second level down shows breakpoints within the related genes, and the third level shows the transcripts. The predicted fusion product is shown at the bottom. Domains (D) are shown below the transcript and the bar immediately underneath each transcript (labeled with M and *) represents the open reading frame. b Oncoprint shows selected recurrent SVs in at least two samples. Color codes denote germline mutation status and SV type
Fig. 4
Fig. 4
Transcriptome hallmarks of SWNTS-SWNs. a Consensus clustering of top 2500 differentially expressed genes in SWNTS (N = 18) and NS-SWNs (N = 41) using Spearman correlation and Ward linkage. Annotations are depicted to the left and below the diagram. b Plot showing the top ten highest enrichment scoring pathways (p < 0.0001) based on GSEA C6 analysis of DEGs in SWNTS versus NS-SWNs. c Analysis of top differentially regulated pathways in SWNTS-SWNs (N = 24) versus NS-SWNs (N = 41). Upregulated pathways are labeled in red. Pathways with high degree of gene overlap are connected with blue lines. d Fold-change expression of DDR related genes in SWNTS-SWN versus NS-SWN (* denotes p < 0.01). e Plot showing log2 fold-change in expression of LZTR1, SMARCB1, and NF2 in SWNTS-SWNs (N = 24) versus NS-SWNs (N = 41)
Fig. 5
Fig. 5
Immune gene signature of SWNTS-SWNs. a Estimated proportion of different immune cell types in SWNTS-SWNs and NS-SWNs based on RNAseq data. b Plots showing significantly different proportions of naïve B cells, c plasma cells, d macrophages, e CD8+ T cells, f activated NK, and g resting NK cells in SWNTS-SWNs versus NS-SWNs. h Plot showing proportion of M2 macrophages in NF2-mutant (N = 16) versus NF2-wild-type (N = 7) SWNTS-SWNs. i Plot showing proportion of resting and activated mast cells in painful (N = 12) versus non-painful (N = 8) SWNTS-SWNs. j Analysis of mRNA expression of immune regulatory genes in SWNTS-SWNs (N = 24) versus NS-SWNs (N = 41)
Fig. 6
Fig. 6
Summary of key molecular alterations in SWNTS-SWNs. Diagram showing key genomic alterations detected in SWNTS-SWNs and in comparison with NS-SWNs. These include differences in immune cell proportions, CNV, somatic alterations in chromosome 22q, and anatomic location associated with pain in SWNTS-SWNs. We also depicted similarities among SWNTS-SWNs and NS-SWNs with respect to COSMIC MMR signatures, presence of SH3PXD2A-HTRA1 gene fusion, and activation of key oncogenic pathways

References

    1. Abe T, Umeki I, Kanno S, Inoue SI, Niihori T, Aoki Y. LZTR1 facilitates polyubiquitination and degradation of RAS-GTPases. Cell Death Differ. 2019 doi: 10.1038/s41418-019-0395-5. - DOI - PMC - PubMed
    1. Agnihotri S, Jalali S, Wilson MR, Danesh A, Li M, Klironomos G, et al. The genomic landscape of schwannoma. Nat Genet. 2016 doi: 10.1038/ng.3688. - DOI - PubMed
    1. Antinheimo J, Sankila R, Carpen O, Pukkala E, Sainio M, Jaaskelainen J. Population-based analysis of sporadic and type 2 neurofibromatosis-associated meningiomas and schwannomas. Neurology. 2012 doi: 10.1212/wnl.54.1.71. - DOI - PubMed
    1. Aryee MJ, Jaffe AE, Corrada-Bravo H, Ladd-Acosta C, Feinberg AP, Hansen KD, et al. Minfi: a flexible and comprehensive bioconductor package for the analysis of infinium DNA methylation microarrays. Bioinformatics. 2014 doi: 10.1093/bioinformatics/btu049. - DOI - PMC - PubMed
    1. Bigenzahn JW, Collu GM, Kartnig F, Pieraks M, Vladimer GI, Heinz LX, et al. LZTR1 is a regulator of RAS ubiquitination and signaling. Science (80-) 2018 doi: 10.1126/science.aap8210. - DOI - PMC - PubMed

Publication types

MeSH terms

Substances

Supplementary concepts