

Different retinopathy phenotypes in type 2 diabetes predict retinopathy progression
- PMID: 33025221
- PMCID: PMC7889686
- DOI: 10.1007/s00592-020-01602-9
Different retinopathy phenotypes in type 2 diabetes predict retinopathy progression
Abstract
Purpose: To characterize the progression in retinopathy severity of different phenotypes of mild nonproliferative diabetic retinopathy (NPDR) in patients with type 2 diabetes.
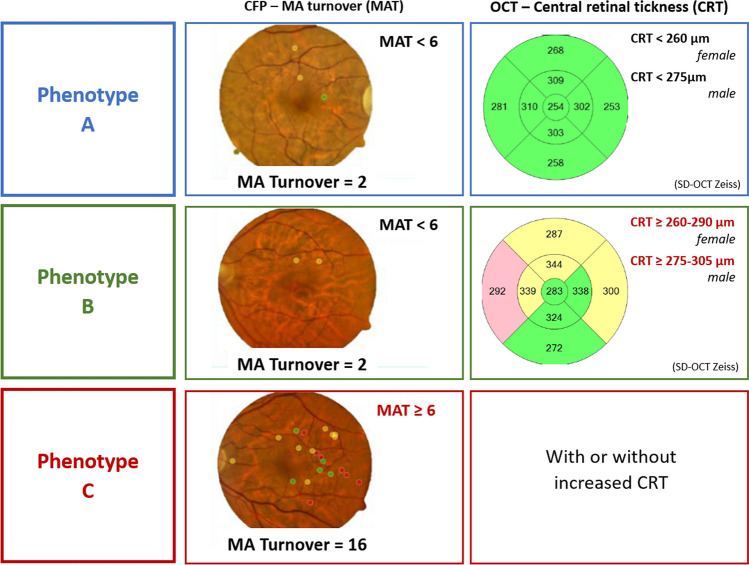
Design and methods: Patients with type 2 diabetes and mild NPDR (ETDRS 20 or 35) were followed in a 5-year longitudinal study. Examinations, including color fundus photography (CFP) and optical coherence tomography (OCT and OCTA), were performed at baseline, 6 months and then annually. Phenotype classification was performed based on microaneurysm turnover (MAT, on CFP) and central retinal thickness (CRT, on OCT). Phenotype A is characterized by low MAT (< 6) and normal CRT; Phenotype B by low MAT (< 6) and increased CRT; and Phenotype C by higher MAT (≥ 6) with or without increased CRT. ETDRS grading of seven fields CFP was performed at the initial and last visits.
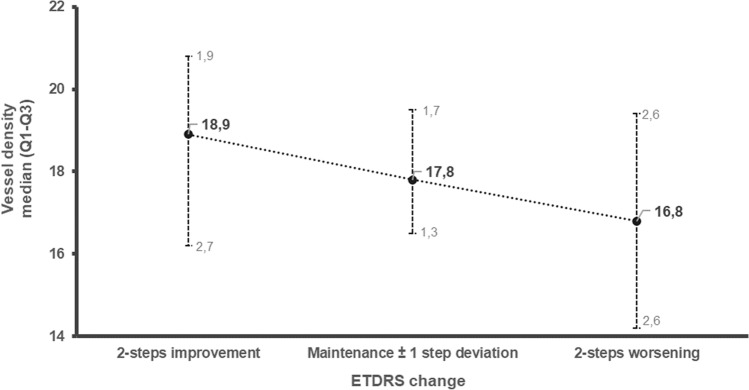
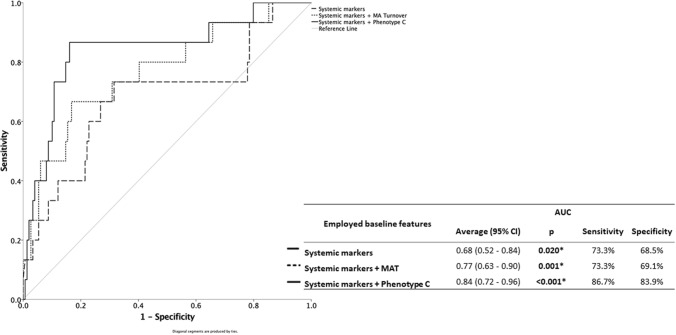
Results: Analysis of ETDRS grade step changes showed significant differences in diabetic retinopathy (DR) progression between the different phenotypes (p < 0.001). Of the 66 participants with phenotype A only 2 eyes (3%) presented 2-or-more-step worsening. None of the 50 participants characterized as phenotype B developed 2-step worsening, whereas 13 eyes (23.2%) characterized as phenotype C had 2-or-more-steps worsening. Phenotype C presents the higher risk for 2-or-more step worsening (OR: 15.94 95% CI: 3.45-73.71; p < 0.001) and higher sensitivity, correctly identifying 86.7% of cases at risk (AUC: 0.84 95% CI: 0.72-0.96; p < 0.001). Diabetic retinopathy severity progression was associated with HbA1c (p = 0.019), LDL levels (p = 0.043), and ocular factors as MAT (p = 0.010), MA formation rate (p = 0.014) and MA disappearance rate (p = 0.005). Capillary closure at 5-year follow-up, identified by lower vessel density (VD) on OCTA, was also associated with diabetic DR severity progression (p = 0.035).
Conclusions: Different DR phenotypes in type 2 diabetes show different risks of retinopathy progression. Phenotype C is associated with increased HbA1c values and presents a higher risk of a 2-or-more-step worsening of the ETDRS severity score.
Keywords: Biomarkers; Microaneurysm; Phenotypes; Retinal thickness; Retinopathy; Type 2 diabetes.
Conflict of interest statement
IP.M., M.H.M., A.L.M., T.S. A.C.-V.M and DS. do not have financial disclosures. J.F.: member of Advisory board for Alimera, Allergan, Bayer, Boehringer, and Novartis; J.C.-V. reports grants from Carl Zeiss Meditec outside the submitted work and is consultant for Alimera Sciences, Allergan, Bayer, Gene Signal, Novartis, Pfizer, Precision Ocular Ltd., Roche, Sanofi-Aventis, Vifor Pharma, and Carl Zeiss Meditec.
Figures
References
-
- Ferris FL (1993) Diabetic retinopathy. In: Diabetes Care - PubMed
-
- Early Treatment Diabetic Retinopathy Study Research Group Grading diabetic retinopathy from stereoscopic color fundus photographsl an extension of the modified airlie house classification: ETDRS report number 10. Ophthalmology. 2020;127(4S):S99–S119. doi: 10.1016/j.ophtha.2020.01.030. - DOI - PubMed
MeSH terms
Grants and funding
LinkOut - more resources
Full Text Sources
Medical
Research Materials
Miscellaneous
