. 2020 Oct 7:9:e56533.
doi: 10.7554/eLife.56533.

Biofilms deform soft surfaces and disrupt epithelia

Affiliations

Biofilms deform soft surfaces and disrupt epithelia

Alice Cont et al. Elife. .

Abstract

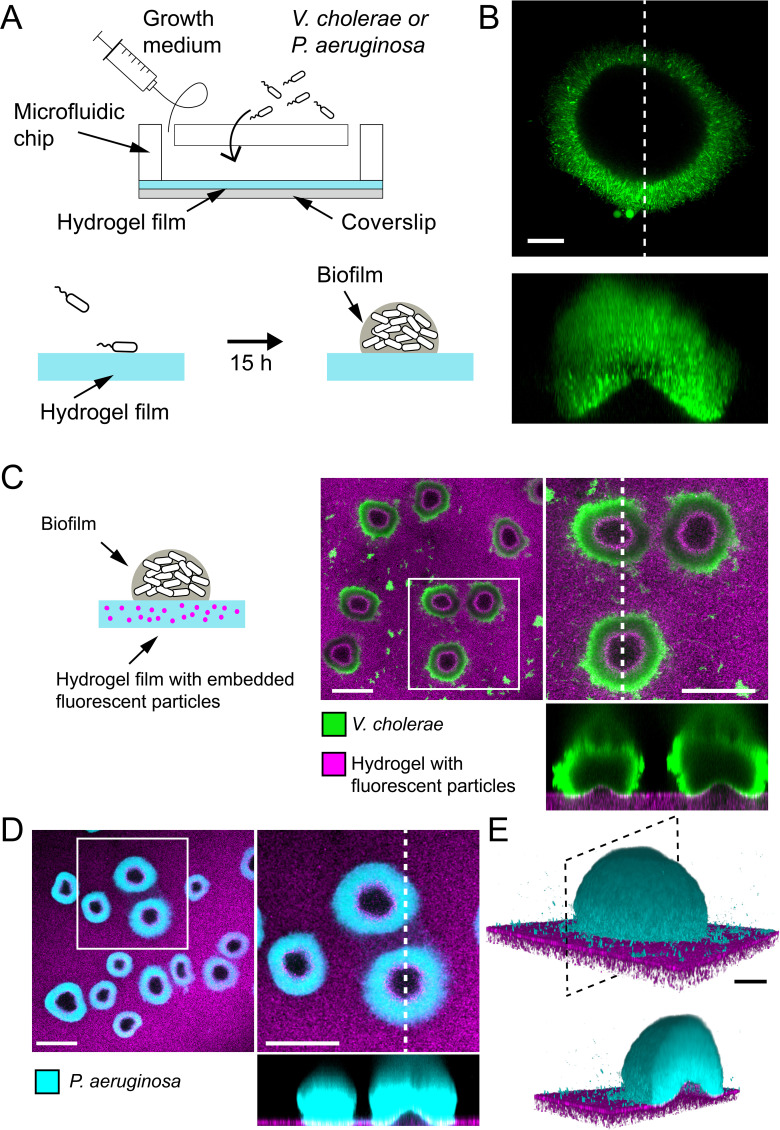
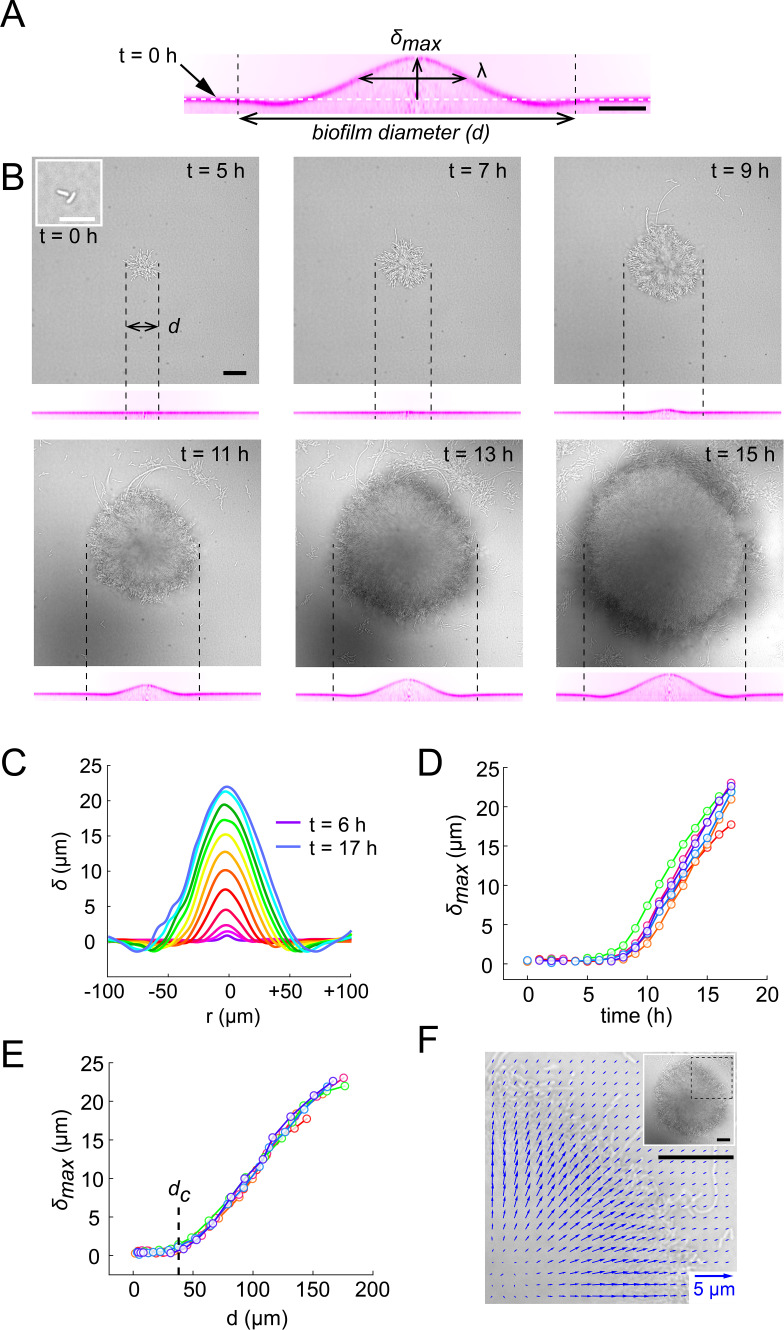
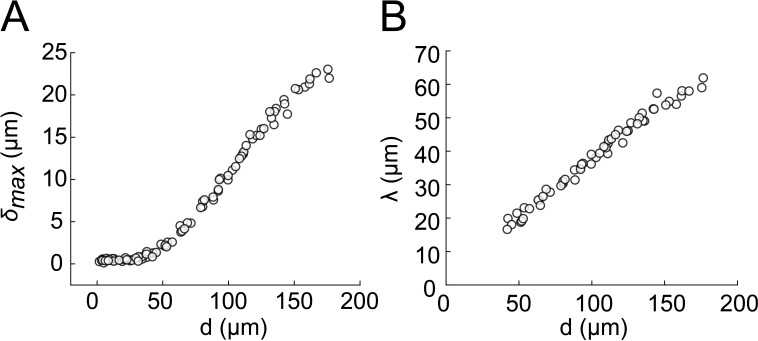
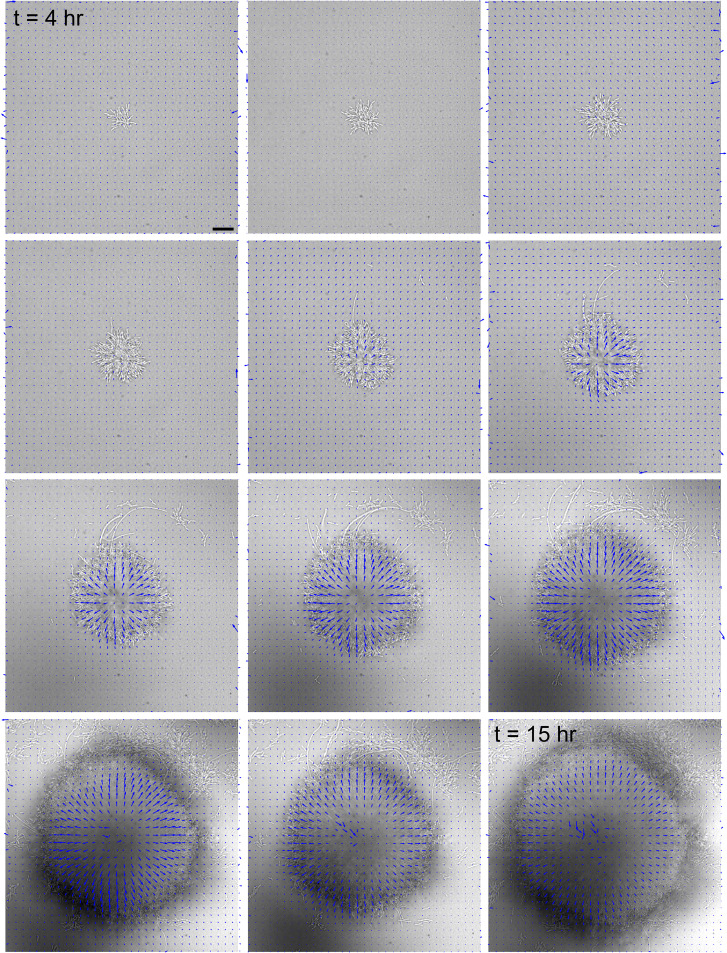
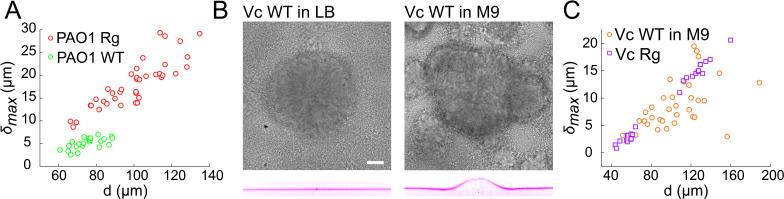
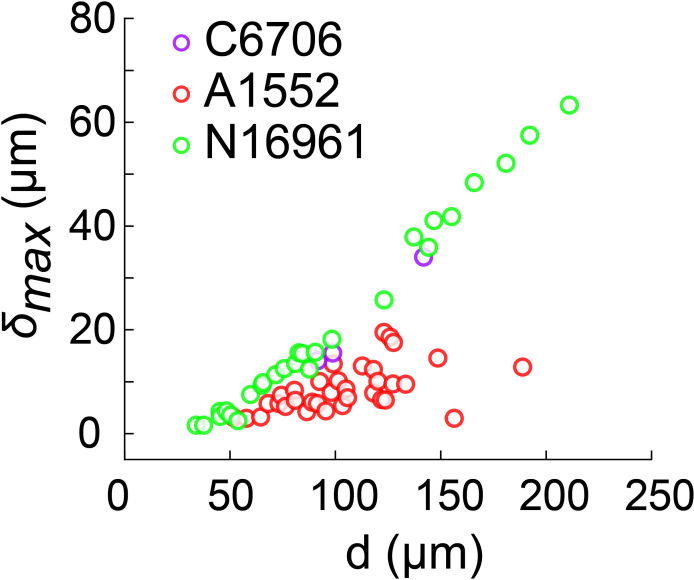
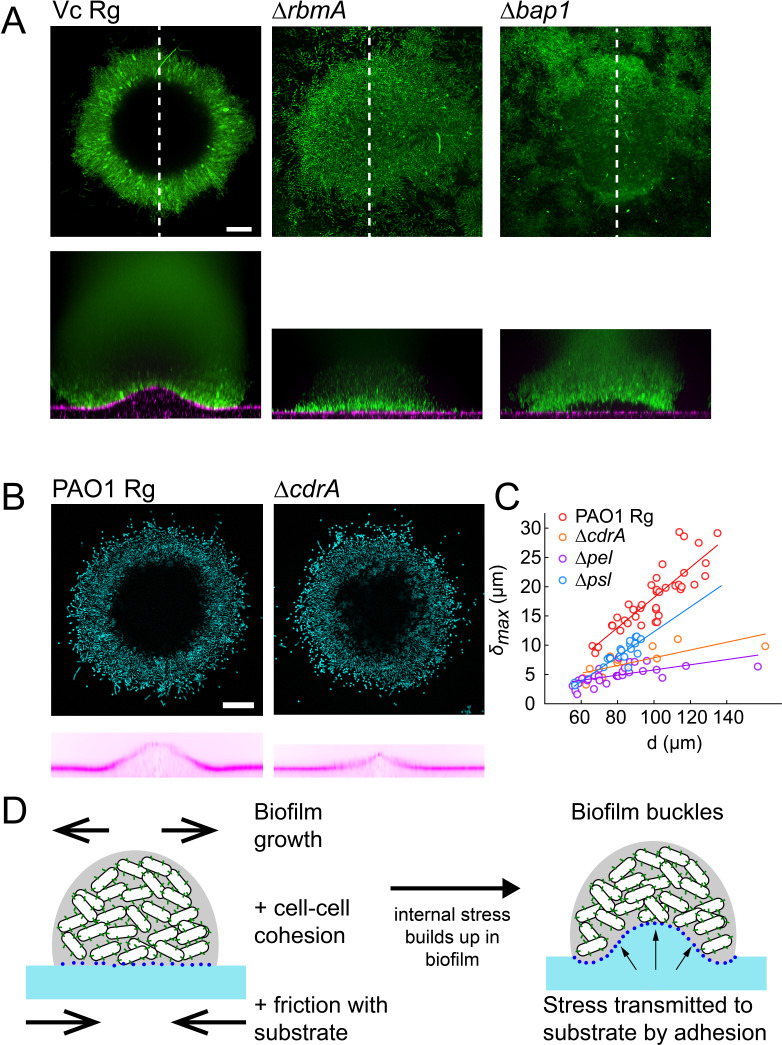
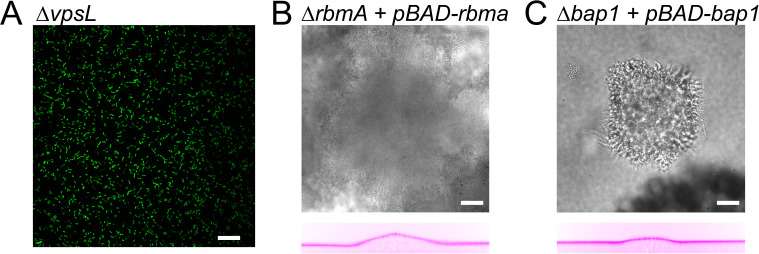
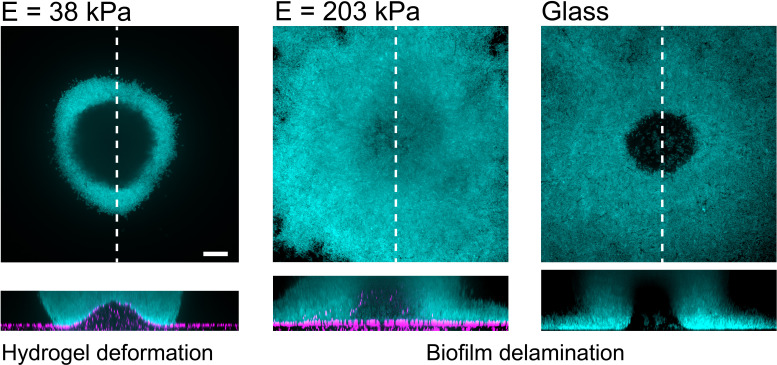
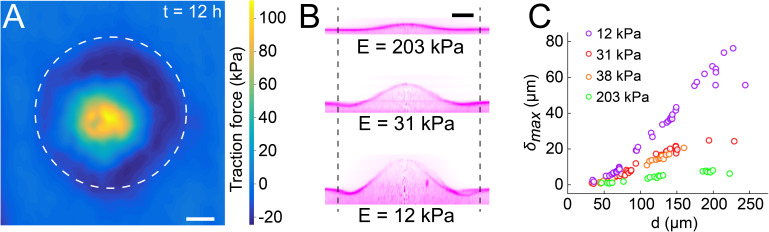
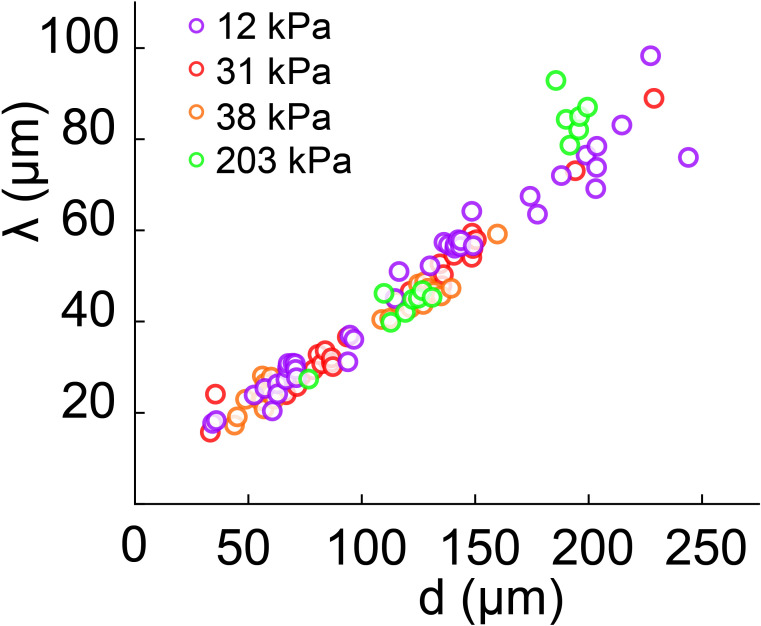
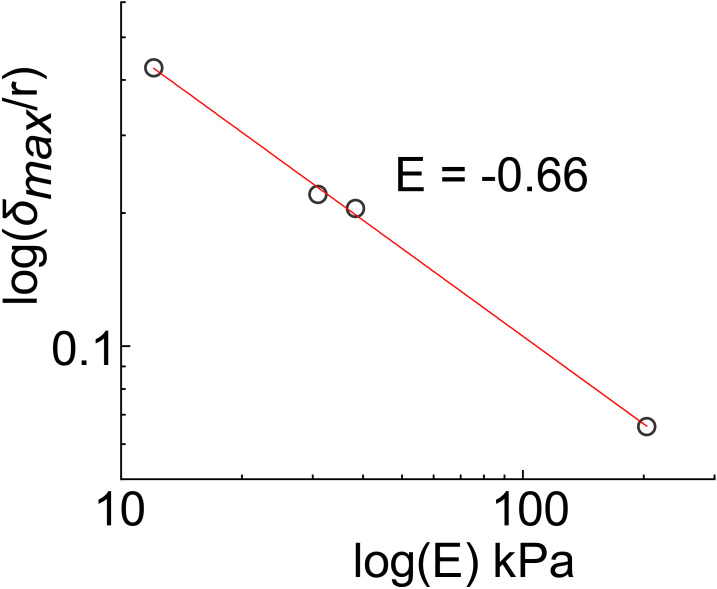
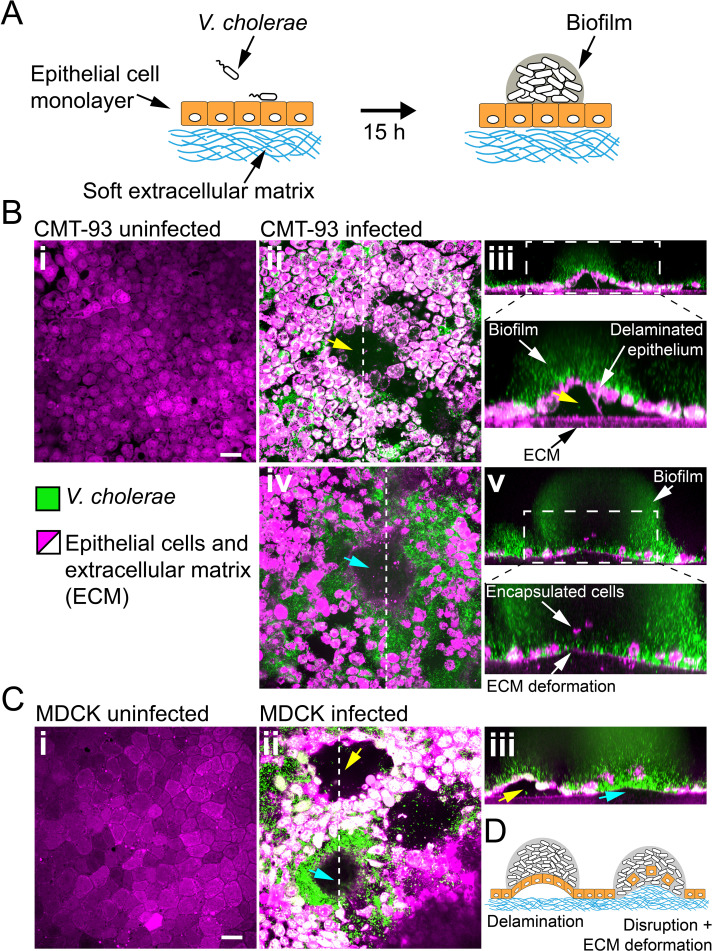
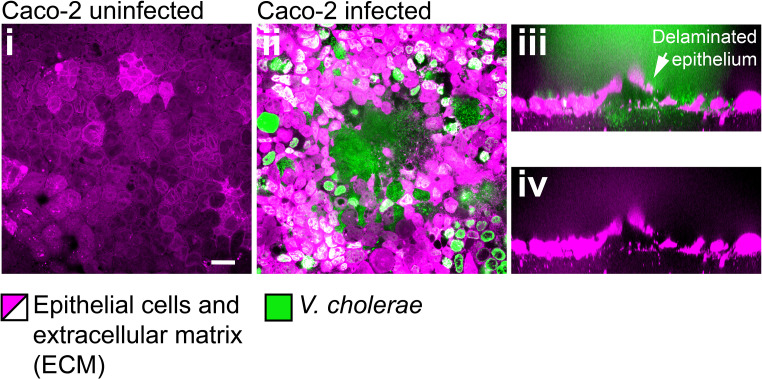
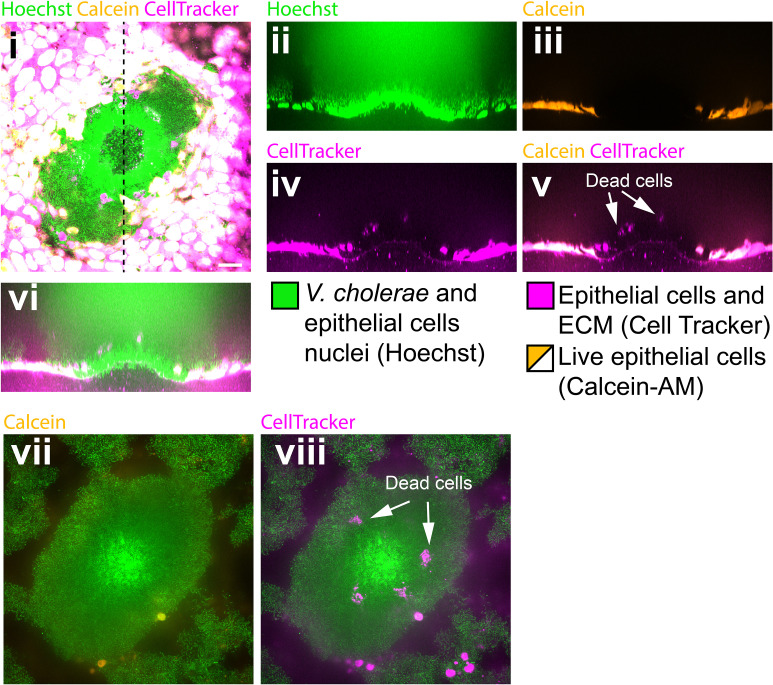
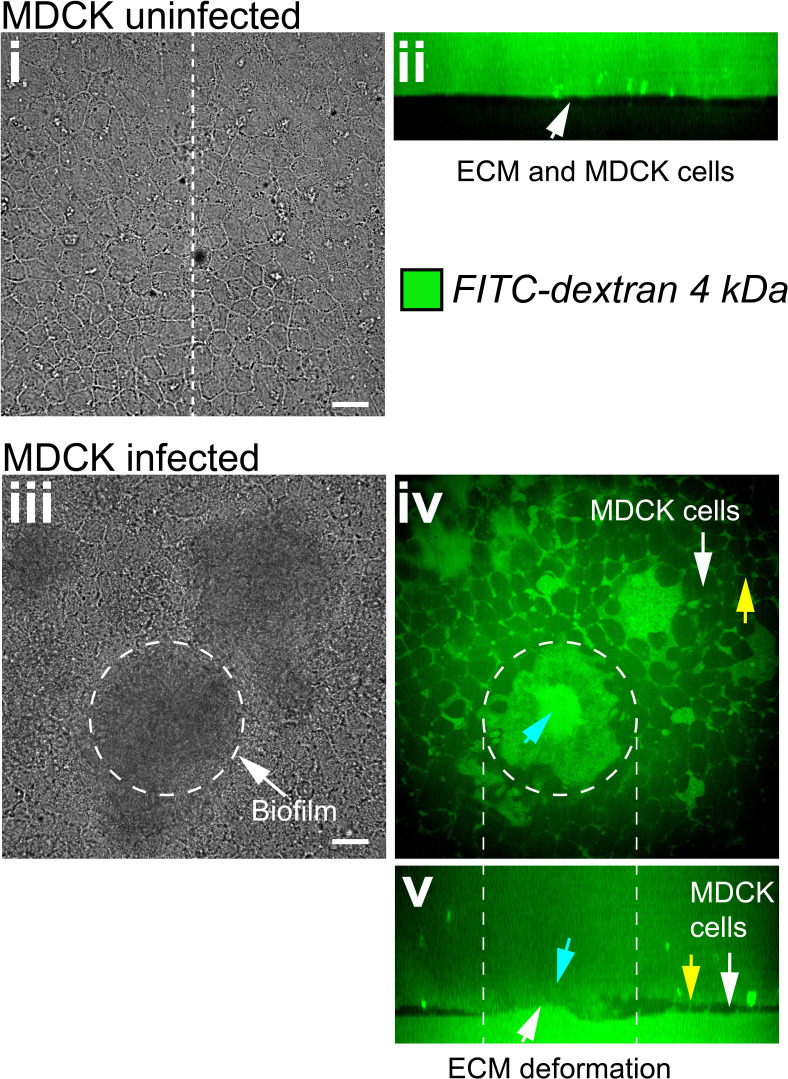
During chronic infections and in microbiota, bacteria predominantly colonize their hosts as multicellular structures called biofilms. A common assumption is that biofilms exclusively interact with their hosts biochemically. However, the contributions of mechanics, while being central to the process of biofilm formation, have been overlooked as a factor influencing host physiology. Specifically, how biofilms form on soft, tissue-like materials remains unknown. Here, we show that biofilms of the pathogens Vibrio cholerae and Pseudomonas aeruginosa can induce large deformations of soft synthetic hydrogels. Biofilms buildup internal mechanical stress as single cells grow within the elastic matrix. By combining mechanical measurements and mutations in matrix components, we found that biofilms deform by buckling, and that adhesion transmits these forces to their substrates. Finally, we demonstrate that V. cholerae biofilms can generate sufficient mechanical stress to deform and even disrupt soft epithelial cell monolayers, suggesting a mechanical mode of infection.

Keywords: Pseudomonas aeruginosa; Vibrio cholerae; biofilm; biomechanics; infectious disease; microbiology.


Conflict of interest statement

AC, TR, ZA, AP No competing interests declared

Figures

Figure 1.
Figure 1.. Biofilms deform soft substrates.
(A) Illustration of experimental setup where we generate thin hydrogel films at the bottom surface of microchannels. These devices allow us to study biofilm formation on hydrogels reproducing mechanical properties of host tissues. (B) In-plane and cross-sectional confocal visualizations show that V. cholerae Rg biofilms growing on hydrogels display large gaps at their core. (C) Embedding fluorescence tracer particle in the hydrogel films allow for visualization of deformations. V. cholerae Rg biofilms formed at the surface of the films deform the substrate. (D) P. aeruginosa Rg biofilms similarly deform the soft substrates. Hydrogel elastic modulus: (B and C) E = 12 kPa, (D and E) E = 38 kPa. Scale bars: (C and D) 100 µm, (B and E) 20 µm.
Figure 2.
Figure 2.. Biofilms deform their substrate by buckling.
(A) Morphological parameters δmax (maximum deformation amplitude) and λ (half max full width) computed from resliced deformation profiles. Dashed line indicates the baseline position of the gel surface. (B) Timelapse visualization of V. cholerae Rg biofilm growth (brightfield, top) with deformation (reslice, bottom). Dashed lines indicate biofilm position and size on the corresponding hydrogel profile. (C) Superimposition of these profiles shows the rapid deformation and the emergence of a recess at biofilm edges. Each color corresponds to the same biofilm at different times. (D) Time evolution of δmax shows a rapid increase after 6 to 7 hr of growth. (E) The dependence of δmax on biofilm diameter highlights a critical biofilm diameter dc above which deformation occurs. For D and E, each line color corresponds to a different biofilm. (F) Hydrogel strain field computed by digital volume correlation between 11 hr and 12 hr of growth. We superimposed the vector strain field with a brightfield image of the biofilm. For visualization purposes we only display data for the top right quarter of the biofilm shown in inset (dashed lines). E = 38 kPa. Scale bar: 10 µm for inset t = 0 hr in (B), else 20 µm.
Figure 2—figure supplement 1.
Figure 2—figure supplement 1.. Biofilm diameter-dependence of δmax and λ.
(A) Biofilm diameter-dependence of δmax. (B) Biofilm diameter-dependence of λ. Both δmax and λ linearly scale with the diameter d of the biofilm.
Figure 2—figure supplement 2.
Figure 2—figure supplement 2.. Hydrogel deformation field computed at different growth stages, superimposed with a brightfield image of the biofilm.
Scale bar: 20 µm. The force field at each timestep is normalized by its maximum displacement, thereby showing relative deformations.
Figure 3.
Figure 3.. Wild-type and rugose biofilms deform soft-substrates.
(A) Biofilm diameter-dependence of maximum deformation for rugose and smooth variants of P. aeruginosa. (B) Smooth variant of V. cholerae A1552 deforms hydrogels when growing in M9 medium, but not in LB. (C) Biofilm diameter-dependence of maximum deformation for rugose and smooth variants of V. cholerae. Data points correspond to biofilms grown in two microfluidic chambers for PAO1 Rg, PAO1 WT and Vc WT and to biofilms grown in one microfluidic chamber for Vc Rg. E = 38 kPa. Scale bars: 20 µm.
Figure 3—figure supplement 1.
Figure 3—figure supplement 1.. Biofilm diameter-dependence of maximum deformation for the smooth variant of different V. cholerae strains grown in M9.
Data points correspond to different biofilms grown in two microfluidic chambers for A1552 and to biofilms grown in one microfluidic chamber for C6706 and N16961.
Figure 4.
Figure 4.. EPS composition drives biofilm and substrate deformations.
(A) Deformations of hydrogel substrates by V. cholerae Rg, rbma- and bap1- biofilms. Biofilms formed by rbma- and bap1- fail to deform the substrate. bap1- biofilms delaminate from the hydrogel surface. (B) Comparison of hydrogel deformations by P. aeruginosa Rg and cdrA- biofilms. (C) Dependence of maximum deformations on P. aeruginosa Rg, cdrA-, pel- and psl- biofilm diameter. All matrix mutants tend to generate weaker deformations compared to Rg. Data points correspond to different biofilms grown in two microfluidic chambers. (D) A model for the mechanism of biofilm deformation of soft substrates. Buildup of mechanical stress in the biofilm induces buckling. Adhesion between the biofilm and the surface transmits buckling-generated stress to the hydrogel, inducing deformations. E = 38 kPa. Scale bars: 20 µm.
Figure 4—figure supplement 1.
Figure 4—figure supplement 1.. Deformation behaviour for vpsL deletion mutant and complementation strains.
(A) VpsL deletion mutant can not form biofilms. Complementation of (B) V. cholerae rbmA and (C) bap1 deletion mutants (brightfield, top) restore the ability of the biofilm to deform the hydrogel (reslice, bottom). E = 38 kPa. Scale bars: 20 µm.
Figure 4—figure supplement 2.
Figure 4—figure supplement 2.. P. aeruginosa biofilms on substrates with different stiffness.
Increasing hydrogel stiffness to 200 kPa induces delamination of biofilms, as observed on glass. Scale bars: 20 µm.
Figure 5.
Figure 5.. Biofilms generate large traction forces.
(A) Traction force microscopy measurements at the hydrogel-biofilm interface. The dashed line shows the edge of the biofilm. Traction force is largest at the biofilm center, reaching 100 kPa. (B) Deformation profiles generated by V. cholerae Rg biofilms of equal diameters on three hydrogels with different stiffness. (C) Biofilm diameter-dependence of maximum deformation for four different hydrogel composition representing a typical range of tissue stiffnesses. The softest hydrogel can deform up to 80 µm for a biofilm diameter of 220 µm. Data points correspond to different biofilms grown in one microfluidic chamber. Scale bar: 20 µm.
Figure 5—figure supplement 1.
Figure 5—figure supplement 1.. Biofilm diameter-dependence of λ for substrates with different moduli.
λ scales linearly and it is not substrate-stiffness dependent.
Figure 5—figure supplement 2.
Figure 5—figure supplement 2.. Power-law relationship between deformation δmax and substrate moduli (E).
Values for δmax/r were extrapolated from linear regression of the data points in Figure 5C for r = 50 µm (d = 100 µm).
Figure 6.
Figure 6.. Biofilms deform and disrupt epithelial cell monolayer.
(A) CMT-93 and MDCK cells grow at the surface of a soft ECM into a tight monolayer on which we seed a liquid inoculum of V. cholerae Rg. (B) Confocal images of uninfected (i) and infected (ii-v) monolayers of CMT-93 cells. Yellow arrow indicates gaps in the epithelial monolayer (ii and iii), blue arrow shows deformed ECM (iv). (C) Confocal images of uninfected (i) and infected (ii-iii) monolayers of MDCK cells, also showing delamination and rupture as illustrated in (D). Scale bars: 20 µm.
Figure 6—figure supplement 1.
Figure 6—figure supplement 1.. Confocal images of uninfected (i) and infected (ii-iv) monolayers of Caco-2 cells.
Scale bars: 20 µm.
Figure 6—figure supplement 2.
Figure 6—figure supplement 2.. Biofilms perturb the viability of MDCK cell monalyers.
(i) Confocal in plane visualization of a Vc Rg biofilm growing on top of an MDCK cell monolayer stained with CellTracker, Hoechst and Calcein-AM. Cross-section visualization of the infected MDCK monolayer stained with Hoechst (ii), Calcein-AM (iii), Cell Tracker (iv) and merged visualizations (v, vi). (vii, viii) Confocal in plane visualization of the biofilm on a focal plane above (i). Scale bars: 20 µm.
Figure 6—figure supplement 3.
Figure 6—figure supplement 3.. Biofilms increase the permeability of MDCK cell monolayers.
(i) Bright-field in plane image of an uninfected MDCK cell monolayer grown at the surface of a soft ECM. (ii) Confocal cross-section shows that uninfected monolayers are impermeable to FITC labeled Dextran. (iii) Bright-field in plane visualization of an MDCK cell monolayer infected with Vc Rg. The dashed line shows the approximate edge of the biofilm. Confocal in plane (iv) and cross section (v) visualization of FITC-labeled Dextran permeability through the damaged epithelium. Blue arrows show Dextran permeability through the biofilm in direct contact with the ECM, yellow arrows indicate Dextran permeability through epithelial cells junctions. Scale bars: 20 µm.

Similar articles

Cited by

References

    1. Ahmad R, Sorrell MF, Batra SK, Dhawan P, Singh AB. Gut permeability and mucosal inflammation: bad, good or context dependent. Mucosal Immunology. 2017;10:307–317. doi: 10.1038/mi.2016.128. - DOI - PMC - PubMed
    1. Asally M, Kittisopikul M, Rué P, Du Y, Hu Z, Çağatay T, Robinson AB, Lu H, Garcia-Ojalvo J, Süel GM. Localized cell death focuses mechanical forces during 3D patterning in a biofilm. PNAS. 2012;109:18891–18896. doi: 10.1073/pnas.1212429109. - DOI - PMC - PubMed
    1. Bartlett TM, Bratton BP, Duvshani A, Miguel A, Sheng Y, Martin NR, Nguyen JP, Persat A, Desmarais SM, VanNieuwenhze MS, Huang KC, Zhu J, Shaevitz JW, Gitai Z. A periplasmic polymer curves Vibrio cholerae and promotes pathogenesis. Cell. 2017;168:172–185. doi: 10.1016/j.cell.2016.12.019. - DOI - PMC - PubMed
    1. Berk V, Fong JC, Dempsey GT, Develioglu ON, Zhuang X, Liphardt J, Yildiz FH, Chu S. Molecular architecture and assembly principles of Vibrio cholerae biofilms. Science. 2012;337:236–239. doi: 10.1126/science.1222981. - DOI - PMC - PubMed
    1. Beroz F, Yan J, Sabass B, Stone HA, Bassler BL, Wingreen NS, Meir Y. Verticalization of bacterial biofilms. Nature Physics. 2018;14:954–960. doi: 10.1038/s41567-018-0170-4. - DOI - PMC - PubMed

Publication types