. 2020 Oct 7:9:e60225.
doi: 10.7554/eLife.60225.

RUNX1 marks a luminal castration-resistant lineage established at the onset of prostate development

Affiliations

RUNX1 marks a luminal castration-resistant lineage established at the onset of prostate development

Renaud Mevel et al. Elife. .

Abstract

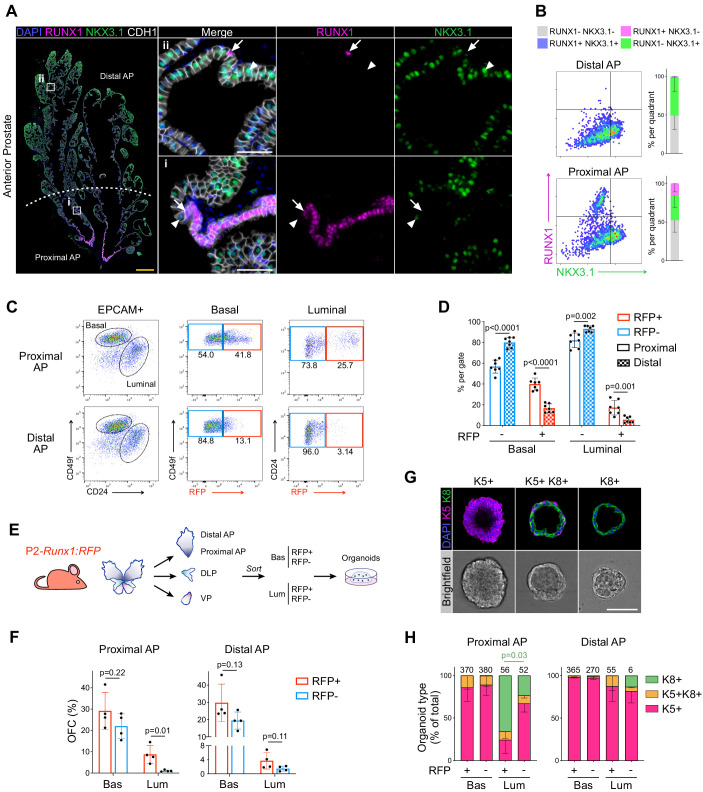
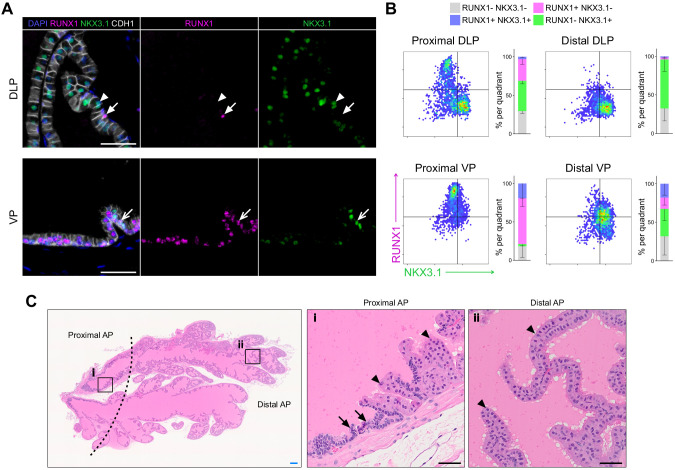
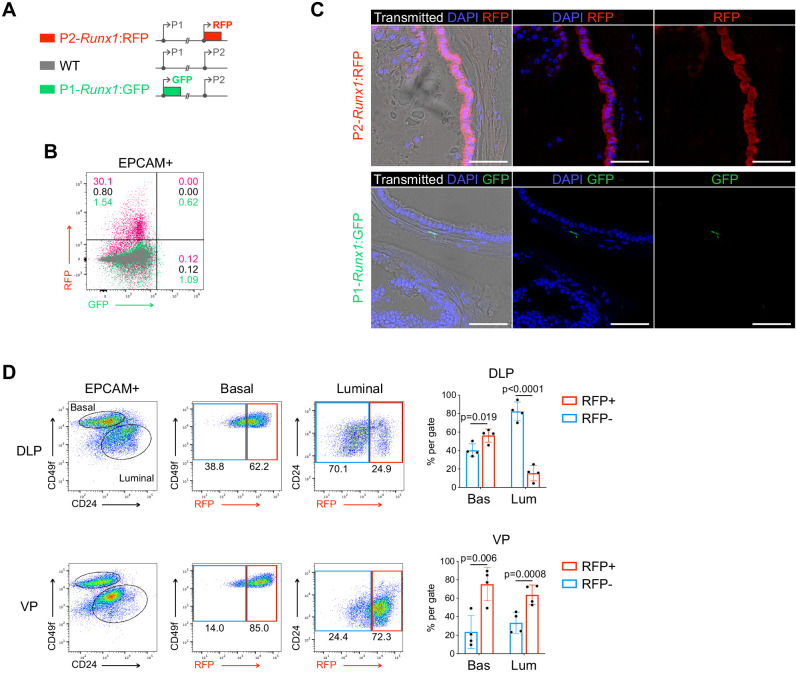
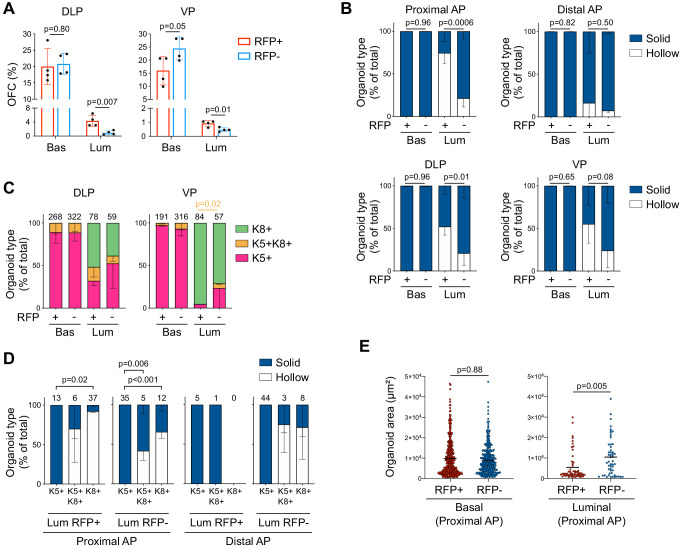
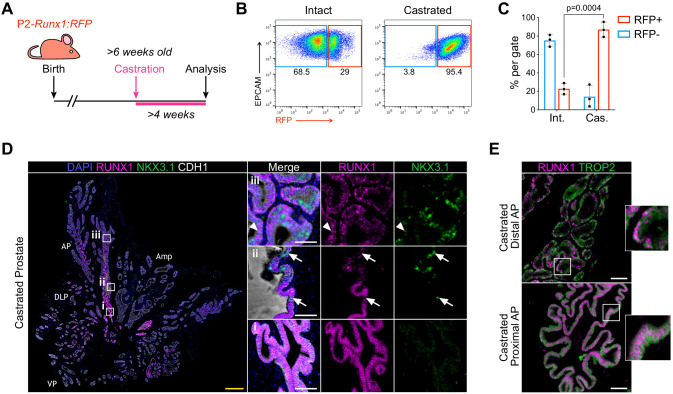
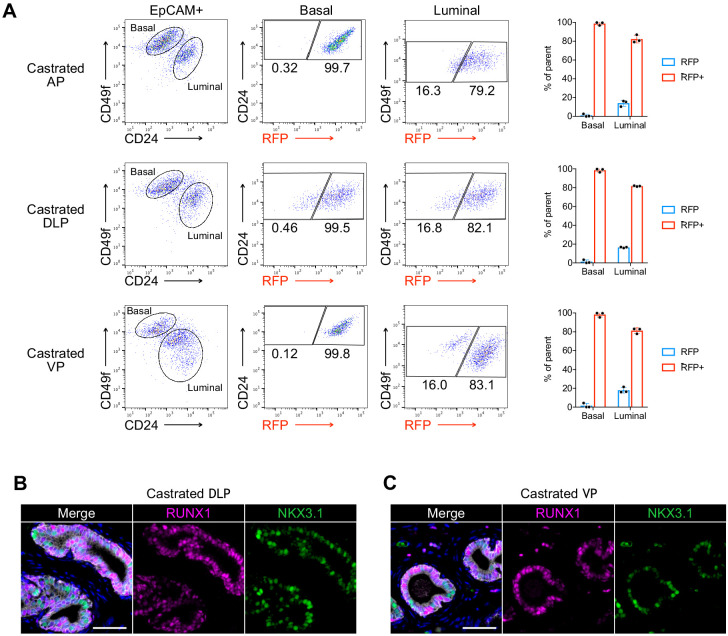
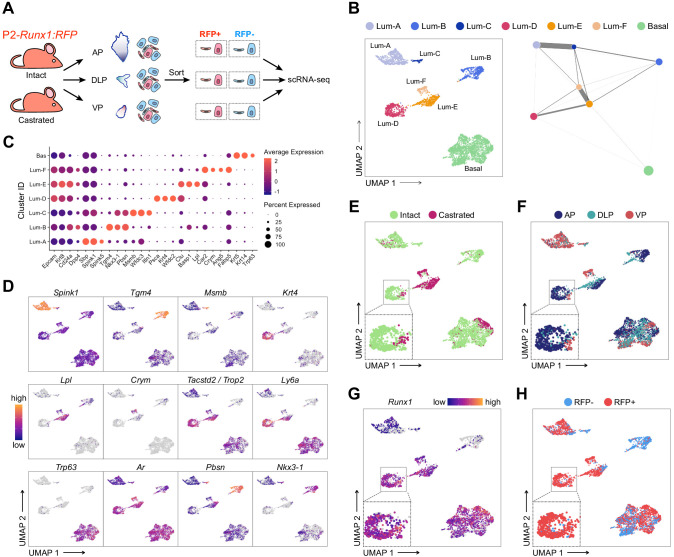
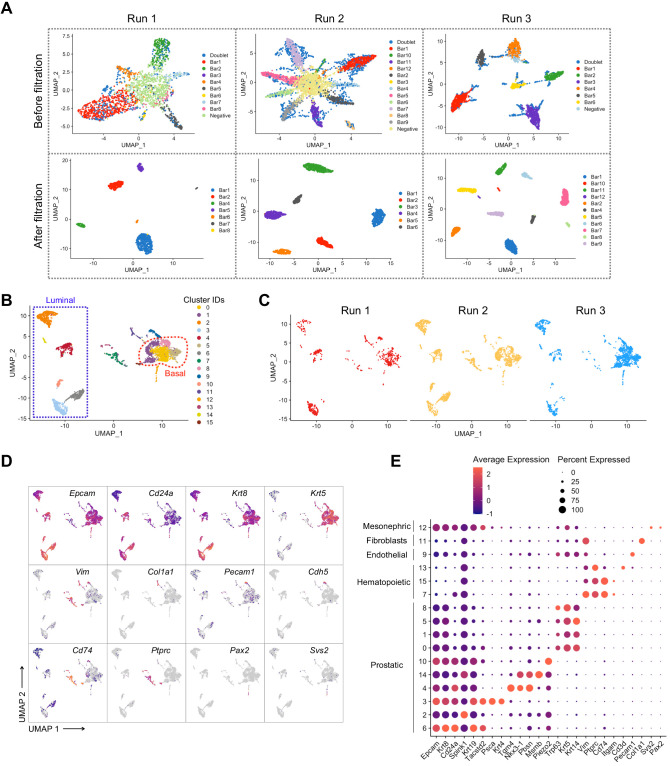
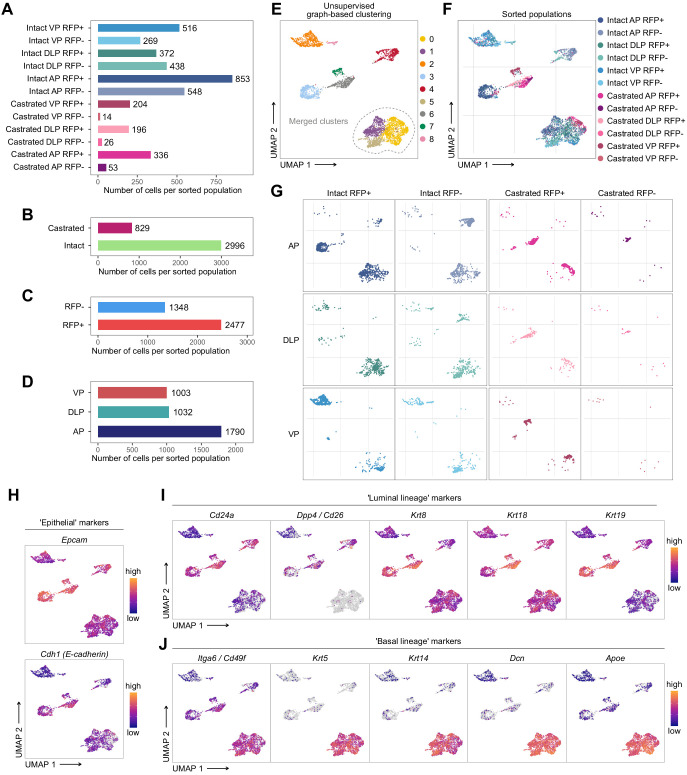
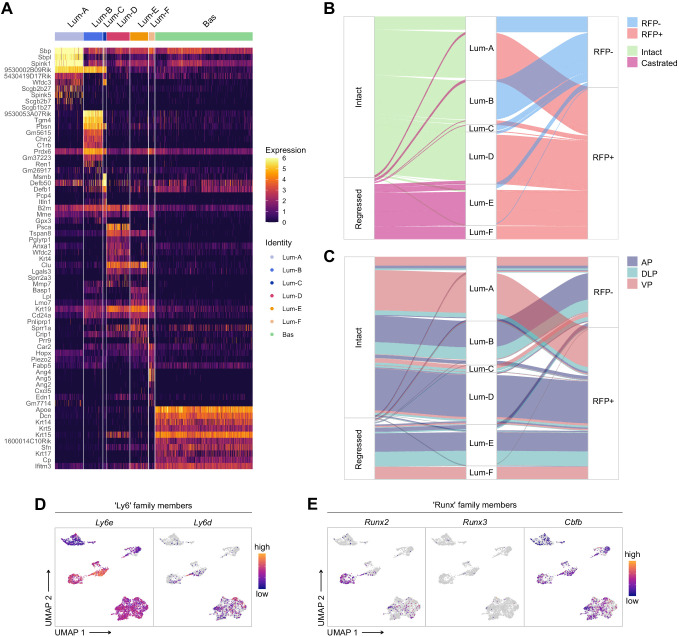
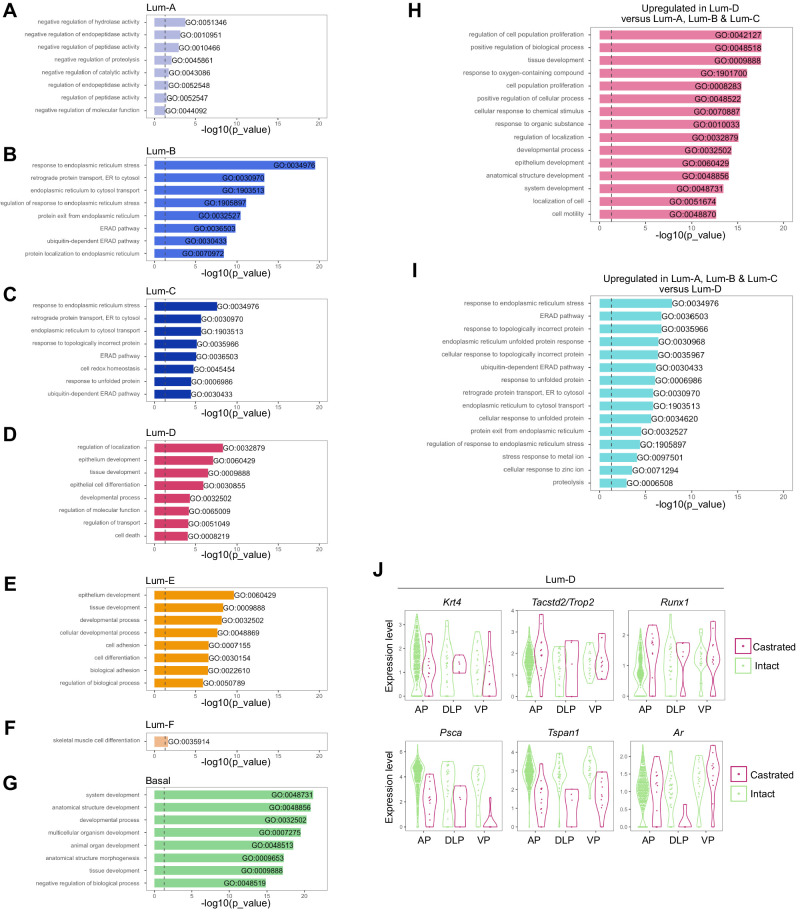
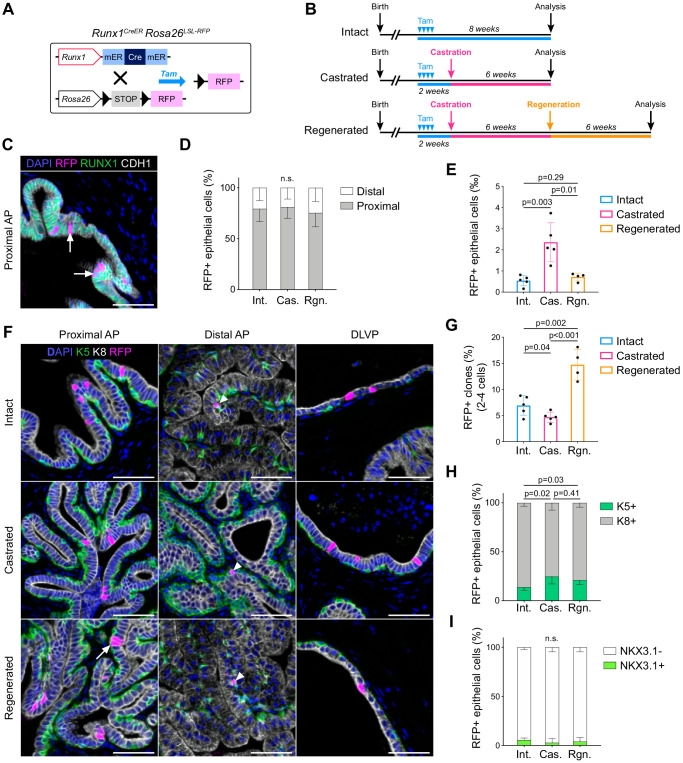
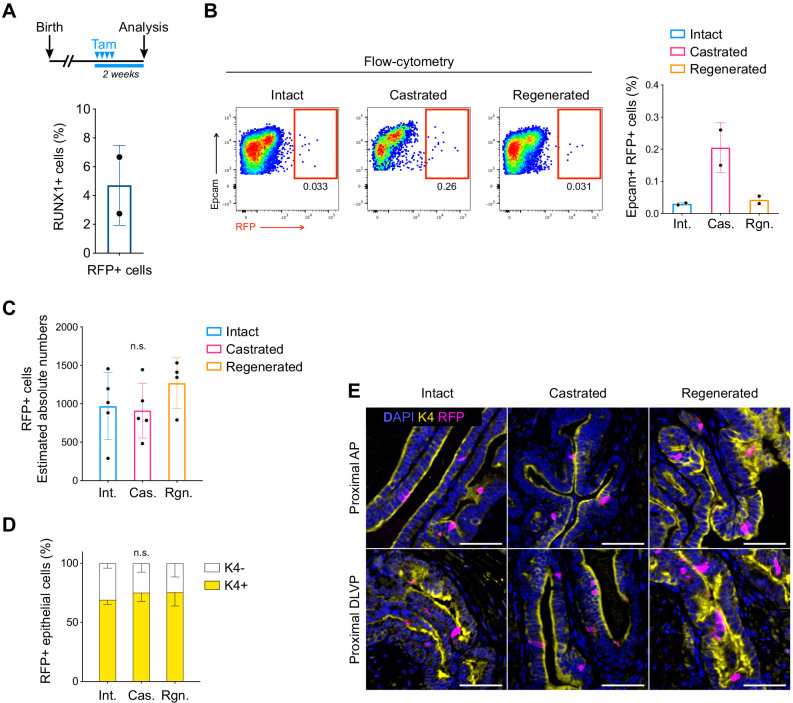
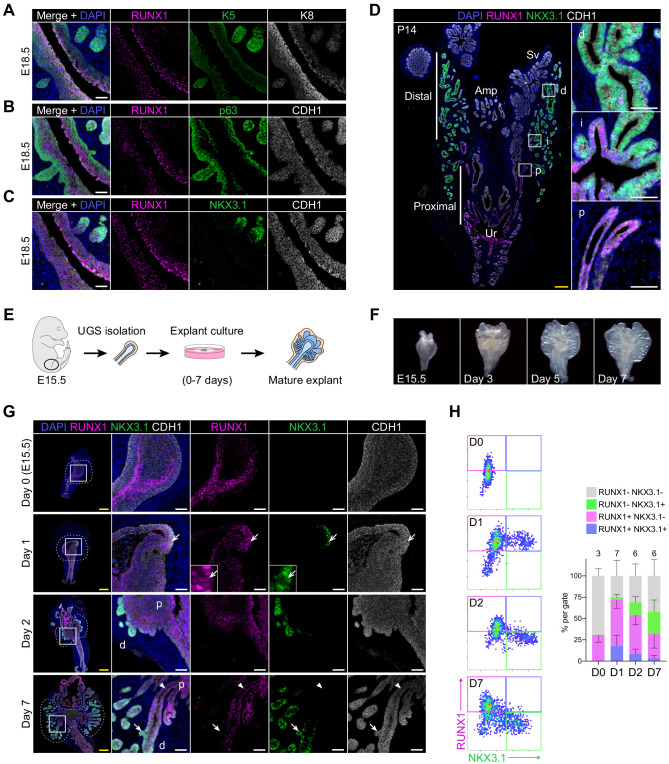
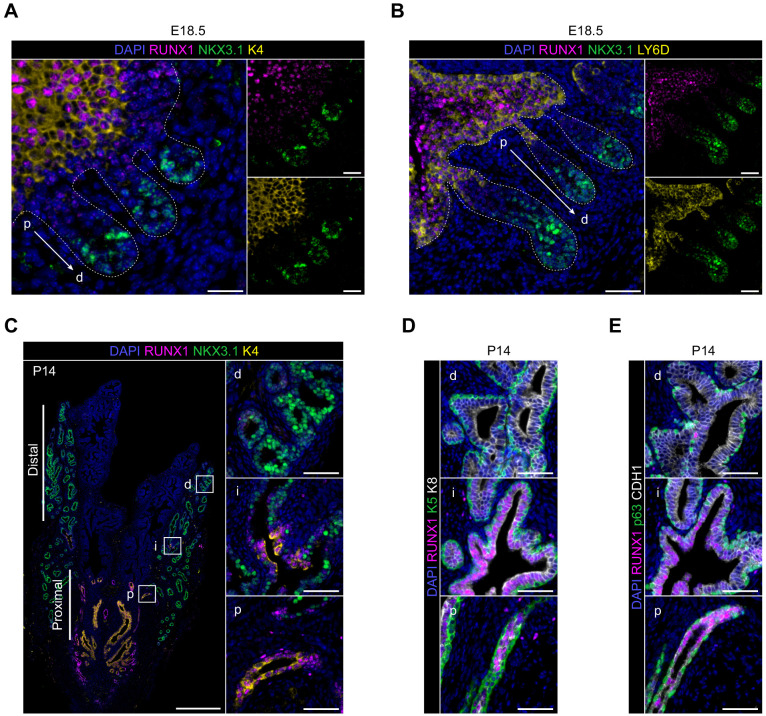
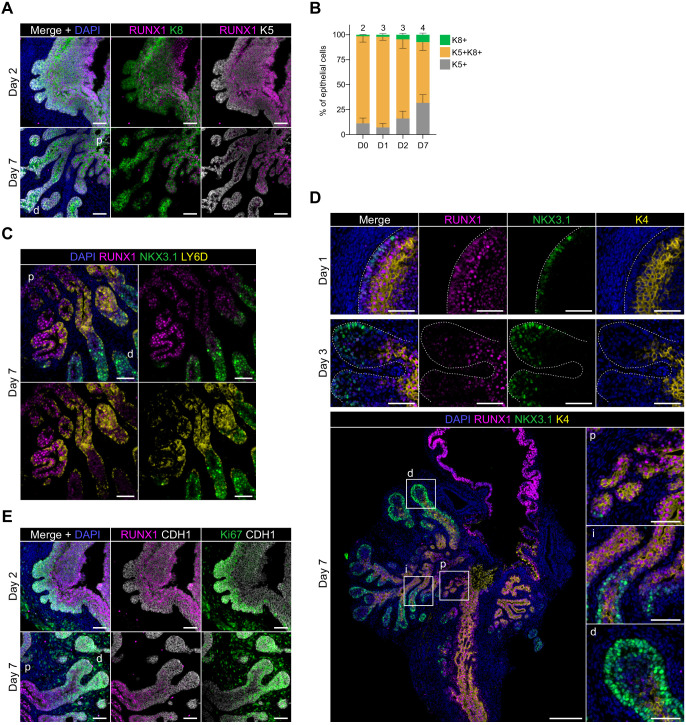
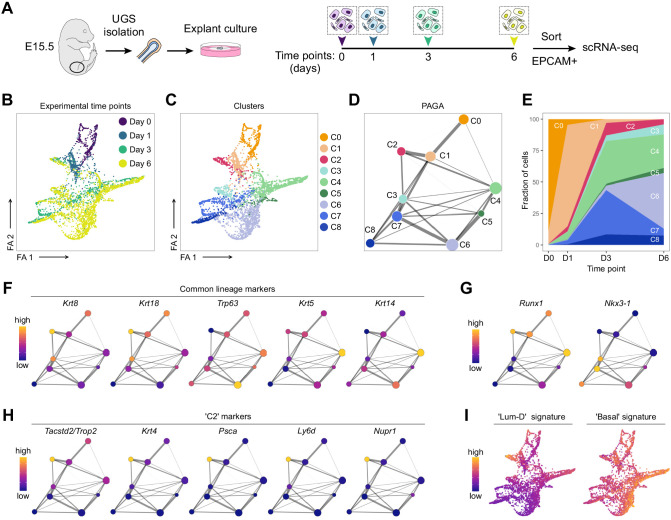
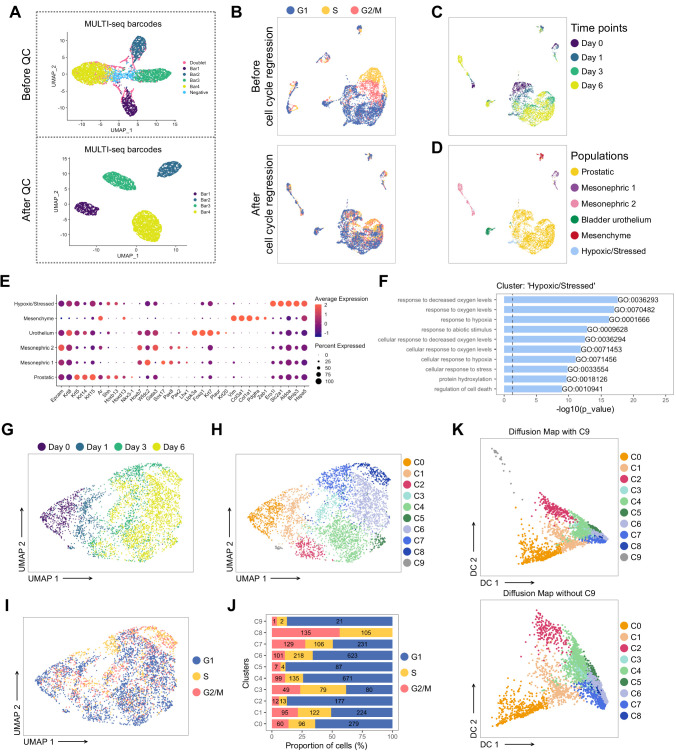
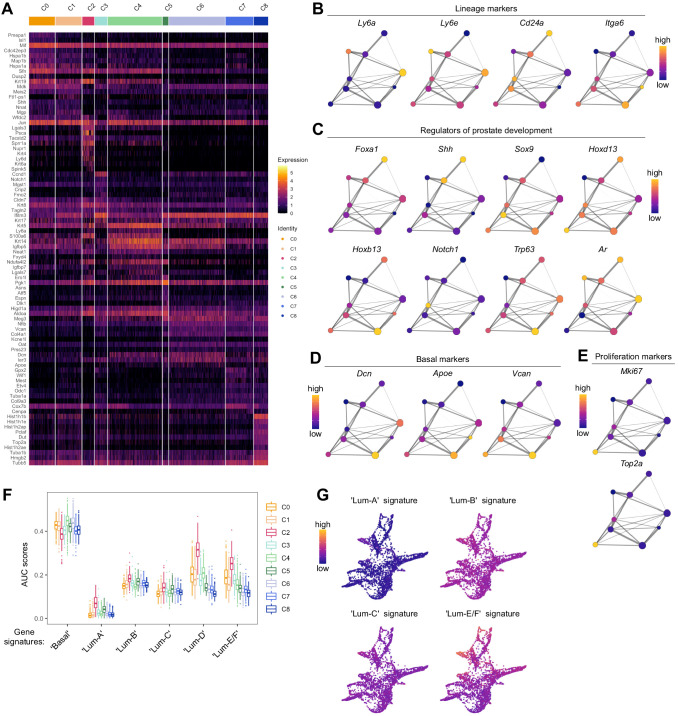
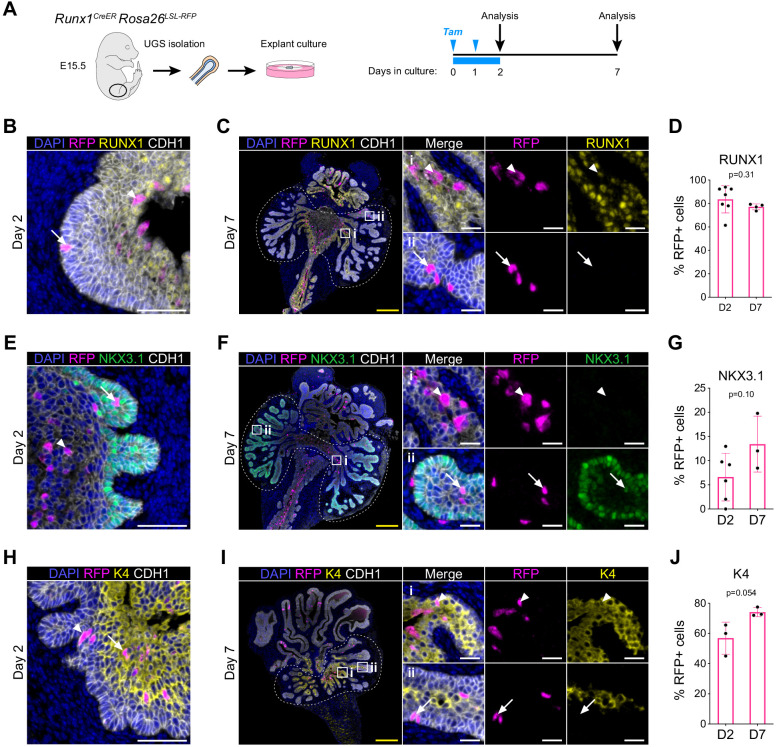
The characterization of prostate epithelial hierarchy and lineage heterogeneity is critical to understand its regenerative properties and malignancies. Here, we report that the transcription factor RUNX1 marks a specific subpopulation of proximal luminal cells (PLCs), enriched in the periurethral region of the developing and adult mouse prostate, and distinct from the previously identified NKX3.1+ luminal castration-resistant cells. Using scRNA-seq profiling and genetic lineage tracing, we show that RUNX1+ PLCs are unaffected by androgen deprivation, and do not contribute to the regeneration of the distal luminal compartments. Furthermore, we demonstrate that a transcriptionally similar RUNX1+ population emerges at the onset of embryonic prostate specification to populate the proximal region of the ducts. Collectively, our results reveal that RUNX1+ PLCs is an intrinsic castration-resistant and self-sustained lineage that emerges early during prostate development and provide new insights into the lineage relationships of the prostate epithelium.

Keywords: RUNX1; development; developmental biology; intrinsic castration-resistance; mouse; prostate; proximal luminal cells; regenerative medicine; single-cell RNA-seq; stem cells.

Plain language summary

The prostate is part of the reproductive organs in male mammals. Many of the cells lining the inside of the prostate – known as ‘luminal cells’ – need hormones to survive. Certain treatments for prostate cancer, including surgical and chemical castration, lead to fewer hormones reaching the prostate, which shrinks as luminal cells die. But some of these luminal cells are able to survive the damaging effects of castration, rebuilding the prostate upon treatment with hormones, which can lead to the cancer reappearing. It is unclear which type of luminal cells survive during periods without hormones and are responsible for regenerating the prostate. RUNX1 is a protein responsible for switching genes on and off, and is usually found in blood cells, which it helps to mature and perform their roles, but has also been detected in tissues that depend on hormones. Since the luminal cells of the prostate rely on hormones, could RUNX1 also be present in these cells? To answer this question, Mével et al. used mice to determine where and when RUNX1 is found in prostate cells. Mével et al. detected high levels of RUNX1 in a patch of luminal cells at the base of the prostate. Samples of these cells were taken for further testing from developing mouse embryos, healthy adult mice and mice in which the prostate was regenerating after surgical castration. Mével et al. found that these cells were a distinct subtype of luminal cells that were able to resist the effects of castration – they survived without hormones. Though these cells were present during the early stages of prostate embryonic development and in healthy adult prostate tissue, they were not responsible for rebuilding the prostate after castration. Mével et al.’s results indicate that, in mice, RUNX1 may act as a marker for a subset of luminal cells that can survive after castration. Further probing the roles of these castration-resistant luminal cells in normal and cancerous prostate tissue may improve the outcome of patients with prostate cancer treated with hormone deprivation therapy.


Conflict of interest statement

RM, IS, SM, LG, RP, MF, IA, HL, PO, KB, EB, GL No competing interests declared

Figures

Figure 1.
Figure 1.. RUNX1 marks a subpopulation of mouse proximal prostate luminal cells (PLCs).
(A) Co-immunostaining of RUNX1, NKX3.1, CDH1 in the mouse Anterior Prostate (AP). Higher magnification images of (i) proximal AP and (ii) distal AP are shown. Arrows indicate RUNX1+ NKX3.1- cells, arrowheads show RUNX1- NKX3.1+ cells. Scale bars: 500 µm (yellow) and 50 µm (white). (B) Quantification of RUNX1 and NKX3.1 nuclear intensity (log10) in CDH1+ epithelial cells by QBIC in proximal and distal AP. n = 6–8 mice. (C, D) Flow-cytometry analysis of P2-Runx1:RFP mice, and corresponding quantification of the percentages of RFP+ and RFP cells in the basal and luminal fractions of the proximal and distal AP. n = 7 mice. (E) Experimental strategy to grow organoids from sorted RFP+ and RFP cells from the basal (CD49fhigh) and luminal (CD24high) lineages of P2-Runx1:RFP mouse reporters. (F) Organoid Forming Capacity (OFC) of RFP+ and RFP- basal and luminal sorted cells after 7 days in culture. n = 4 mice. (G) Whole-mount immunostaining of unipotent K5+, unipotent K8+ or multipotent K5+ K8+ organoids. Scale bar: 50 µm. (H) Quantification of the type of organoids characterized by whole-mount immunostaining, as in G. Numbers of organoids quantified are shown above the graph. p Value is indicated for the proportion of K8+ organoids between Proximal AP Luminal RFP+ versus RFP- derived subset. Other comparisons were not statistically significant. n = 2 mice per group. Source files are available in Figure 1—source data 1.
Figure 1—figure supplement 1.
Figure 1—figure supplement 1.. RUNX1 is enriched in the mouse prostate epithelium.
(A) Co-immunostaining of RUNX1, NKX3.1, CDH1 in the mouse DLP (top) and VP (bottom). Closed arrows indicate RUNX1+ NKX3.1- cells, chevron arrows indicate rare RUNX1+ NKX3.1+ cells, arrowheads show RUNX1- NKX3.1+ cells. Scale bars: 50 µm. (B) Quantification of RUNX1 and NKX3.1 nuclear intensity (log10) in CDH1+ epithelial cells by QBIC in proximal DLP (n = 3), distal DLP (n = 8), proximal VP (n = 3) and distal VP (n = 8). (C) H and E staining of the mouse AP. Higher magnification images of (i) proximal AP and (ii) distal regions are shown. Arrows show typical proximal luminal cells with condensed nuclei and cytoplasm, arrowheads show typical distal secretory luminal cells with enlarged cytoplasm and strong pink eosinophilic staining. Scale bars: 200 µm (blue) and 50 µm (black). Source files are available in Figure 1—figure supplement 1—source data 1.
Figure 1—figure supplement 2.
Figure 1—figure supplement 2.. Runx1 expression is mediated by the P2 promoter in the mouse prostate epithelium.
(A) Schematic diagrams of the P2-Runx1:RFP reporter allele (top), Runx1 WT allele (middle), and P1-Runx1:GFP reporter allele (bottom). In P2-Runx1:RFP or P1-Runx1:GFP mice, expression of RFP or GFP is directed by Runx1 proximal P2 or distal P1 promoter respectively. WT Runx1 expression is directed by the remaining WT allele. (B) Flow-cytometry analysis of the epithelial EPCAM+ fraction of WT, P2-Runx1:RFP and P1-Runx1:GFP mice. Percentages are indicated in each quadrant gates. (C) Confocal images indicating P2-Runx1:RFP signal in the glandular epithelium (top), while P1-Runx1:GFP (bottom) activity is detected in the surrounding stroma. Scale bar: 50 µm. (D) Flow-cytometry analysis of P2-Runx1:RFP mice, and corresponding quantification of the percentages of RFP+ and RFP- cells in the basal and luminal fractions of DLP (n = 4 mice) and VP (n = 4 mice) lobes. Source files are available in Figure 1—figure supplement 2—source data 1.
Figure 1—figure supplement 3.
Figure 1—figure supplement 3.. Characterization of P2-Runx1:RFP derived mouse prostate organoids.
(A) Organoid Forming Capacity (OFC) of RFP+ and RFP- basal and luminal sorted cells from DLP (left) and VP (right) cultured for 7 days. n = 4 mice. (B) Quantification of organoid morphologies determined by brightfield assessment. p Values are indicated only for statistically significant (p<0.05) comparisons between RFP+ versus RFP- derived subsets. n = 4 mice. (C) Quantification of the type of organoids (pink: unipotent K5+, green: unipotent K8+, orange: multipotent K5+ K8+ organoids) characterized by whole-mount immunostaining. p Value is indicated for the proportion of K5+K8+ organoids between VP Luminal RFP+ versus RFP- derived subset. Other comparisons were not statistically significant. n = 2 mice. (D) Quantification of organoid morphologies according to the type of organoids (unipotent K5+, unipotent K8+, multipotent K5+ K8+). Results are shown for luminal proximal and distal AP derived organoids. n = 2 mice. Numbers of organoids quantified are shown above the graph. Two-way ANOVA using Tukey’s multiple comparisons test was used for statistical analysis. (E) Quantification of the organoid area estimated from maximum projection of stacked images from basal (left) and luminal (right) fractions of the proximal AP. Numbers of organoids quantified are shown above the graph. Two-tailed Mann-Whitney test was used for statistical analysis. n = 2 mice. Source files are available in Figure 1—figure supplement 3—source data 1.
Figure 2.
Figure 2.. RUNX1-expressing cells are enriched in the castrated prostate epithelium.
(A) P2-Runx1:RFP reporter mice were surgically castrated between 6 and 12 weeks of age and analyzed at least 4 weeks post-castration. (B, C) Flow-cytometry analysis and corresponding quantification of the proportion of RFP+ and RFP- cells in the EPCAM+ fraction of intact and castrated prostates of P2-Runx1:RFP mice. n = 3 mice per group. Int: Intact, Cas: Castrated. (D) Co-immunostaining of RUNX1, NKX3.1, CDH1 in the castrated wild-type mouse prostate. Higher magnification images of (i) proximal, (ii) intermediate, and (iii) distal AP are shown. Arrows indicate RUNX1- NKX3.1+ cells, arrowheads show a luminal cell co-stained for RUNX1 and NKX3.1. Amp: ampullary gland. Scale bars: 500 µm (yellow) and 50 µm (white). Int: Intact, Cas: Castrated. (E) Co-immunostaining of RUNX1 and TROP2 showing colocalization of the two markers in both proximal (bottom) and distal (top) castrated AP. Scale bars: 50 µm (white). Source files are available in Figure 2—source data 1.
Figure 2—figure supplement 1.
Figure 2—figure supplement 1.. Characterization of RUNX1 expression in the castrated mouse prostate.
(A) Flow cytometry analysis and corresponding quantifications of the basal and luminal EPCAM+ fraction from AP, DLP, and VP lobes of castrated P2-Runx1:RFP mice (n = 3). (B, C) Co-immunostaining of RUNX1, NKX3.1, CDH1 in castrated DLP (B) and VP (C) lobes. Scale bars: 50 µm (white). Source files are available in Figure 2—figure supplement 1—source data 1.
Figure 3.
Figure 3.. scRNA-seq profiling of intact and castrated Runx1+ cells reveals transcriptomic similarity between proximal luminal cells and castration-resistant cells.
(A) Experimental strategy for scRNA-seq on RFP+ and RFP- cells individually dissected lobes of intact and castrated prostates isolated from P2-Runx1:RFP reporter mice. (B) UMAP visualization (left) and graph-abstracted representation (PAGA, right) of prostate epithelial cells (n = 3,825 cells from three independent experiments). Colors represent different clusters. In PAGA, clusters are linked by weighted edges that represent a statistical measure of connectivity. (C) Dot plot showing the expression of selected marker genes associated with each cluster. (D–H) UMAP visualization of prostate epithelial cells. Cells in D and G are colored by a gradient of log-normalized expression levels for each gene indicated. Cell colors in E represent the treatment of origin (intact, castrated), in F individual lobes of origin (AP, DLP, VP), and in H RFP FACS gate of origin (RFP+, RFP-).
Figure 3—figure supplement 1.
Figure 3—figure supplement 1.. Pre-processing of the scRNA-seq dataset of adult intact and castrated mouse prostates.
(A) UMAP visualization in MULTI-seq barcodes space for each independent experiment (Run 1: left, Run 2: middle, Run 3: right) before (top) and after (bottom) quality control and barcode filtration (see Materials and methods for details). (B) UMAP visualization of the integrated batch-corrected dataset (n = 4499 cells from three independent experiments). Colors represent different clusters. (C) UMAP visualization of the integrated batch-corrected dataset split and colored by individual experiment (Run 1: left, Run 2: middle, Run 3: right). (D, E) Example key marker genes used for cell type characterization. (D) UMAP visualization of the integrated batch-corrected dataset. Cells are colored by a gradient of log-normalized expression levels for each gene indicated. (E) Dot plot showing the expression of selected marker genes associated with each cluster. Cells corresponding to the prostatic clusters were kept for downstream analyses.
Figure 3—figure supplement 2.
Figure 3—figure supplement 2.. Characterization of the scRNA-seq prostate epithelial subset.
(A–D) Number of cells present in the prostate epithelial subset. In A colors correspond to phenotypic sorted populations, in B treatment of origin, in C RFP FACS gate of origin, in D individual lobes. (E, G) UMAP visualization of prostate epithelial cells. Cells in E are colored by clusters. Clusters 0, 1, and 5 were merged together. In F and G colors represent phenotypic sorted populations. (H–J) Cells are colored by a gradient of log-normalized expression levels for each gene. Canonical epithelial markers are shown in H, luminal lineage markers in I, and basal lineage markers in J.
Figure 3—figure supplement 3.
Figure 3—figure supplement 3.. Characterization of the scRNA-seq prostate epithelial dataset.
(A) Heatmap of the 10 most differentially upregulated genes per cluster. (B, C) Sankey diagrams summarizing the proportion of cells and between phenotypic groups. (D, E) Cells are colored by a gradient of log-normalized expression levels for each gene. D shows the expression of Ly6 family members, and in E RUNX family members are shown.
Figure 3—figure supplement 4.
Figure 3—figure supplement 4.. Gene Ontology and differential expression analysis within the scRNA-seq prostate epithelial dataset.
Bar plots of the eight most significantly (g:Profiler adjusted p-value<0.05) enriched gene ontology (GO) terms (GO:BP, Biological Processes) using the list of differentially upregulated genes specific to (A) Lum-A, (B) Lum-B, (C) Lum-C, (D) Lum-D, (E) Lum-E, (F) Lum-F, and (G) Basal clusters. (H, I) Fifteen most enriched GO terms (g:Profiler adjusted p-value<0.05) for genes upregulated in the Lum-D cluster against combined Lum-A, Lum-B, and Lum-C clusters in H. Results of the opposite comparison are shown in I. (J) Violin plots showing the expression levels of specific genes within the Lum-D cluster. Data are split and colored by treatment for each lobe. The expression of Krt4, Tacstd2/Trop2 and Runx1 does not vary upon treatment, while Androgen Receptor (AR) regulated genes such as Psca and Tspan1 are downregulated after castration.
Figure 4.
Figure 4.. Lineage tracing of Runx1-expressing cells establishes the intrinsic castration-resistant properties of the proximal luminal lineage.
(A) Schematic summary of the genetic lineage-tracing system employed. (B) Experimental strategy for lineage-tracing experiments. (C) Co-immunostaining of RFP, RUNX1, CDH1 in the proximal AP. Arrows indicate RFP labeled RUNX1+ cells. Scale bar: 50 µm. (D) Quantification of the percentage of epithelial RFP+ cells in proximal and distal regions of the prostate in intact (n = 5), castrated (n = 4) and regenerated (n = 4) mice. (E) Quantification of the percentage of epithelial RFP+ cells in intact (n = 5), castrated (n = 5) and regenerated (n = 4) mice. (F) Co-immunostaining of RFP, K5, K8 in the proximal AP, distal AP, and DLVP (DLP + VP). Arrowheads indicate RFP labeled basal cells (K5+) found in distal AP, the white arrow indicates a luminal (K8+) RFP+ clone made of two cells. Scale bar: 50 µm. (G) Quantification of the percentage of epithelial RFP+ clones comprising between two and four cells in intact (n = 5), castrated (n = 5) and regenerated (n = 4) mice. (H, I) Quantification of the percentage of RFP+ cells being K5+ or K8+ in H, or NKX3.1+ or NKX3.1- in I, in intact (n = 5), castrated (n = 5) and regenerated (n = 4) mice. Int: Intact, Cas: Castrated, Rgn: Regenerated. Source files are available in Figure 4—source data 1.
Figure 4—figure supplement 1.
Figure 4—figure supplement 1.. Lineage tracing of RUNX1-expressing cells labeled in intact mice.
(A) Scheme of the tamoxifen labeling strategy to evaluate the labeling efficiency of Runx1-expressing cells. (B) Flow-cytometry analysis of intact (n = 2), castrated (n = 2), and regenerated (n = 2) Runx1CreER Rosa26LSL-RFP mice, and corresponding quantification of the percentage of RFP+ cells in the epithelial EPCAM+ fraction. (C) Estimated absolute number of epithelial RFP+ cells in intact (n = 5) and castrated (n = 5) and regenerated (n = 4) prostates based on IHC quantifications. Int: Intact, Cas: Castrated, Rgn: Regenerated. (D) Quantification of the percentage of epithelial RFP+ cells being K4+ or K4 in intact (n = 3), castrated (n = 4) and regenerated (n = 5) mice. (F) Co-immunostaining showing the enrichment of K4+ RFP labeled cells in the proximal region of the AP (top) and DLVP (bottom) prostate lobes. Scale bar: 50 µm. Source files are available in Figure 4—figure supplement 1—source data 1.
Figure 5.
Figure 5.. RUNX1 marks proximal cells during embryonic prostate development.
(A–C) Co-immunostainings of the mouse urogenital sinus at E18.5 for RUNX1, K5, K8 in A, RUNX1, p63, CDH1 in B, RUNX1, NKX3.1, CDH1 in C. Scale bar: 50 µm. (D) Co-immunostainings of RUNX1, NKX3.1, CDH1 at postnatal (P) day 14. Higher magnification images of (p) proximal, (i) intermediate, and (d) distal regions are shown. Scale bars: 200 µm (yellow) and 50 µm (white). Amp: ampullary gland; Sv: seminal vesicles; Ur: urethra; p: proximal; i: intermediate; d: distal. (E) Scheme of the protocol to culture ex vivo explants of mouse UGS harvested at E15.5. (F) Representative images of UGS explants at E15.5 (day 0), day 3, day 5, and day 7 of culture showing the formation of premature prostate buds. (G) Co-immunostaining of RUNX1, NKX3.1, CDH1 in UGS explants harvested at day 0, day 1, day 2, and day 7. Higher magnification images of each square (left) are shown for each time point. Chevron arrows show RUNX1+ NKX3.1+ cells, closed arrows indicate RUNX1- NKX3.1+ cells, arrowheads show RUNX1+ NKX3.1- cells. Scale bars: 200 µm (yellow) and 50 µm (white). (H) Quantification of RUNX1 and NKX3.1 nuclear intensity (log10) in CDH1+ epithelial cells of UGS explants by QBIC. Quantification was performed within the boundaries delimited in G by dotted lines, at day 0 (n = 3 explants), day 1 (n = 7 explants), day 2 (n = 6 explants), and day 7 (n = 6 explants). Source files are available in Figure 5—source data 1.
Figure 5—figure supplement 1.
Figure 5—figure supplement 1.. Characterization of RUNX1 expression during prostate development in vivo.
(A) Co-immunostainings of the mouse urogenital sinus at E18.5 for RUNX1, NKX3.1, K4. p: proximal, d: distal. Scale bar: 50 µm. Dotted lines indicate the urogenital epithelium. (B) Co-immunostainings of the mouse urogenital sinus at E18.5 for RUNX1, NKX3.1, LY6D. p: proximal, d: distal. Scale bar: 50 µm. (C) Co-immunostaining of RUNX1, NKX3.1, K4 at postnatal (P) day 14. Higher magnification images of (p) proximal, (i) intermediate, and (d) distal regions are shown. Scale bars: 200 µm (yellow) and 50 µm (white). (D, E) Co-immunostainings at P14 for RUNX1, K5, K8 in B RUNX1, p63, CDH1 in C. p: proximal, i: intermediate, d: distal. Scale bar: 50 µm.
Figure 5—figure supplement 2.
Figure 5—figure supplement 2.. Characterization of RUNX1 expression during prostate development in UGS explant cultures.
(A) Co-immunostaining of RUNX1, K5, K8 in UGS explants harvested at day 2 and day 7. p: proximal, d: distal. Scale bar: 50 µm. (E) Quantification of the percentage of K5+, K8+, K5+ K8+ cells during UGS explant cultures at day 0 (n = 2 explants), day 1 (n = 3 explants), day 2 (n = 3 explants), day 7 (n = 4 explants), showing a progressive reduction in the proportion of K5+ K8+ double positive cells. (C) Co-immunostaining of RUNX1, NKX3.1, LY6D in UGS explants harvested at day 7. p: proximal, d: distal. Scale bar: 50 µm. (D) Co-immunostaining of RUNX1, NKX3.1, K4 in UGS explants harvested at day 1 (top), 3 (middle), and 7 (bottom). Higher magnification images of (p) proximal, (i) intermediate, and (d) distal regions are shown for day 7. Scale bars: 200 µm (yellow) and 50 µm (white). Dotted lines indicate the urogenital epithelium. (E) Co-immunostaining of RUNX1, Ki67, CDH1 in UGS explants harvested at day 2 and day 7. p: proximal, d: distal. Scale bar: 50 µm. Source files are available in Figure 5—figure supplement 2—source data 1.
Figure 6.
Figure 6.. scRNA-seq of UGS explant cultures shows specification of the proximal luminal lineage during embryonic prostate development.
(A) Experimental strategy for scRNA-seq of UGS explant cultures at day 0, day 1, day 3 and day 6. (B, C) Force directed visualization of the developing prostatic epithelium in UGS explant cultures. In B cells are colored by experimental time points, and in C cells are colored by clusters. (D) PAGA representation of the clusters as in C. Weighted edges between cluster nodes represent a statistical measure of connectivity. (E) Fraction of cells per cluster at each experimental time point, displaying a progressive cellular diversification. (F–H) PAGA representations with cluster nodes colored by a gradient representing the mean log-normalized expression levels of each gene. (I) Force directed visualization of the developing prostatic epithelium in UGS explant cultures. Color gradient represents AUC scores per cell. Per-cell AUC scores were calculated using the ‘AUCell’ package. Gene signatures for ‘Lum-D’ (left) and ‘Basal’ (right) were generated using the list of differentially upregulated genes previously obtained from our adult mouse prostate clusters.
Figure 6—figure supplement 1.
Figure 6—figure supplement 1.. Pre-processing of the scRNA-seq dataset of UGS explant cultures.
(A) UMAP visualization in MULTI-seq barcodes space before (top) and after (bottom) quality control and barcode filtration (see Materials and methods for details). (B) UMAP visualization of the dataset colored by estimated cell cycle phase (top). Due to the strong underlying impact on clustering, the cell cycle effect was regressed out (bottom). (C, D) UMAP visualization of the dataset colored in C by experimental time point and in D by labeled populations. (E) Dot plot showing the expression of selected marker genes associated with each labeled population. (F) Bar plots of the 10 most significantly (g:Profiler adjusted p-value<0.05) enriched gene ontology (GO) terms (GO:BP, Biological Processes) on the differentially upregulated genes specific to the ‘Hypoxic/Stressed’ cluster. (G–I) UMAP visualization of the prostatic subset (from D), labeled by time points in G, clusters in H, estimated cell cycle phase in I. (J) Percentage of cells in the different estimated cell cycle phases in each clusters. (K) Diffusion maps representation of the prostatic subset using the first two diffusion components with (top) and without C9 (bottom). C9 was excluded for downstream analyses due to its outlying profile.
Figure 6—figure supplement 2.
Figure 6—figure supplement 2.. Characterization of the developing prostatic epithelium in the scRNA-seq dataset of UGS explant culture.
(A) Heatmap of the 10 most differentially upregulated genes per cluster. (B–E) PAGA representations with cluster nodes colored by a gradient representing the mean log-normalized expression levels of each genes indicated. B shows the expression of common prostate lineage markers, C shows known regulators of prostate development, D shows basal markers, E shows proliferation markers. (F) Box plots of per-cell AUC signature scores calculated using the ‘AUCell’ package for individual UGS explant clusters. Gene signatures were generated using the list of differentially upregulated genes previously obtained from our adult mouse prostate clusters. (G) Force-directed visualization of the developing prostatic epithelium in UGS explant cultures. Color gradient represents AUC scores per cell.
Figure 7.
Figure 7.. RUNX1+ cells contribute to the establishment of the proximal luminal lineage during embryonic prostate development.
(A) Strategy for lineage tracing of RUNX1+ cells in UGS explant cultures. Tamoxifen was applied on day 0 and day 1 and washed out on day 2. (B, C) Co-immunostaining of RFP, RUNX1, CDH1 in UGS explants harvested at day 2 (B) and day 7 (C). Higher magnification images of proximal (i) and (ii) distal regions are shown for day 7. Arrows show RFP+ RUNX1-low cells, arrowheads show RFP+ RUNX1+ cells. Scale bars: 200 µm (yellow) and 50 µm (white). (C) Quantification of the percentage of epithelial RUNX1+ cells in the RFP subset at day 2 (n = 7) and day 7 (n = 3) of UGS explant cultures. Quantification was performed within the boundaries delimited in B by dotted lines. (E, F) Co-immunostaining of RFP, NKX3.1, CDH1 in UGS explants harvested at day 2 (E) and day 7 (F). Higher magnification images of (i) proximal and (ii) distal regions are shown for day 7. Arrows show RFP+ NKX3.1+ cells, arrowheads show RFP+ NKX3.1- cells. Scale bars: 200 µm (yellow) and 50 µm (white). (G) Quantification of the percentage of epithelial NKX3.1+ cells in the RFP subset at day 2 (n = 6) and day 7 (n = 4) of UGS explant cultures. Quantification was performed within the boundaries delimited in F by dotted lines. (H, I) Co-immunostaining of RFP, K4, CDH1 in UGS explants harvested at day 2 (H) and day 7 (I). Higher magnification images of (i) proximal and (ii) distal regions are shown for day 7. Arrows show RFP+ K4 cells, arrowheads show RFP+ K4+ cells. Scale bars: 200 µm (yellow) and 50 µm (white). (J) Quantification of the percentage of epithelial K4+ cells in the RFP subset at day 2 (n = 3) and day 7 (n = 3) of UGS explant cultures. Quantification was performed within the boundaries delimited in I by dotted lines. Source files are available in Figure 7—source data 1.
Figure 7—figure supplement 1.
Figure 7—figure supplement 1.. Lineage tracing of RUNX1-expressing cells in UGS explants.
(A, B) Co-immunostaining of RFP, p63, CDH1 in UGS explants harvested at day 2 (A) and day 7 (B). Higher magnification images of (i) proximal and (ii) distal regions are shown for day 7. Arrows show RFP+ p63+ cells, arrowheads show RFP+ p63- cells. Scale bars: 200 µm (yellow) and 50 µm (white). (C) Quantification of the percentage of epithelial RFP+ p63+ cells at day 2 (n = 7) and day 7 (n = 4) of UGS explant cultures. Quantification was performed within the boundaries delimited in B by dotted lines. (D) Co-immunostaining of RFP, K5, K8 in UGS explants harvested at day 2 (top) and day 7 (bottom). Higher magnification images of proximal (i) and (ii) distal regions are shown for day 7. Arrows show RFP+ K5+ K8+ cells, chevron arrows show RFP+ K5- K8+, arrowheads show RFP+ K5+ K8- cells. Scale bars: 200 µm (yellow) and 50 µm (white). (E) Quantification of the percentage of epithelial K5+ K8+, K5- K8+ cells and K5+ K8- cells in the RFP subset at day 2 (n = 4) and day 7 (n = 3) of UGS explant cultures. Quantifications were performed within the boundaries delimited in D by dotted lines. (F, G) Co-immunostaining of RFP, Nupr1 (mRNA), CDH1 in UGS explants harvested at day 2 (F) and day 7 (G). Higher magnification images of (i) proximal and (ii) distal regions are shown for day 7. Arrows show RFP+ Nupr1+ cells, arrowheads show RFP+ Nupr1- cells. Scale bars: 200 µm (yellow) and 50 µm (white). (J) Quantification of the percentage of epithelial K4+ cells in the RFP subset at day 2 (n = 3) and day 7 (n = 4) of UGS explant cultures. Quantification was performed within the boundaries delimited in G by dotted lines. Source files are available in Figure 7—figure supplement 1—source data 1.

Similar articles

Cited by

References

    1. Aibar S, González-Blas CB, Moerman T, Huynh-Thu VA, Imrichova H, Hulselmans G, Rambow F, Marine JC, Geurts P, Aerts J, van den Oord J, Atak ZK, Wouters J, Aerts S. SCENIC: single-cell regulatory network inference and clustering. Nature Methods. 2017;14:1083–1086. doi: 10.1038/nmeth.4463. - DOI - PMC - PubMed
    1. Banach-Petrosky W, Jessen WJ, Ouyang X, Gao H, Rao J, Quinn J, Aronow BJ, Abate-Shen C. Prolonged exposure to reduced levels of androgen accelerates prostate Cancer progression in Nkx3.1; Pten mutant mice. Cancer Research. 2007;67:9089–9096. doi: 10.1158/0008-5472.CAN-07-2887. - DOI - PubMed
    1. Bankhead P, Loughrey MB, Fernández JA, Dombrowski Y, McArt DG, Dunne PD, McQuaid S, Gray RT, Murray LJ, Coleman HG, James JA, Salto-Tellez M, Hamilton PW. QuPath: open source software for digital pathology image analysis. Scientific Reports. 2017;7:16878. doi: 10.1038/s41598-017-17204-5. - DOI - PMC - PubMed
    1. Barros-Silva JD, Linn DE, Steiner I, Guo G, Ali A, Pakula H, Ashton G, Peset I, Brown M, Clarke NW, Bronson RT, Yuan GC, Orkin SH, Li Z, Baena E. Single-Cell analysis identifies LY6D as a marker linking Castration-Resistant prostate luminal cells to prostate progenitors and Cancer. Cell Reports. 2018;25:3504–3518. doi: 10.1016/j.celrep.2018.11.069. - DOI - PMC - PubMed
    1. Berman DM, Desai N, Wang X, Karhadkar SS, Reynon M, Abate-Shen C, Beachy PA, Shen MM. Roles for hedgehog signaling in androgen production and prostate ductal morphogenesis. Developmental Biology. 2004;267:387–398. doi: 10.1016/j.ydbio.2003.11.018. - DOI - PubMed

Publication types

Substances

Associated data