. 2021 Apr;49(2):123-135.
doi: 10.1007/s00240-020-01216-4. Epub 2020 Oct 7.

Multimodal imaging reveals a unique autofluorescence signature of Randall's plaque

Affiliations

Multimodal imaging reveals a unique autofluorescence signature of Randall's plaque

Seth Winfree et al. Urolithiasis. 2021 Apr.

Abstract

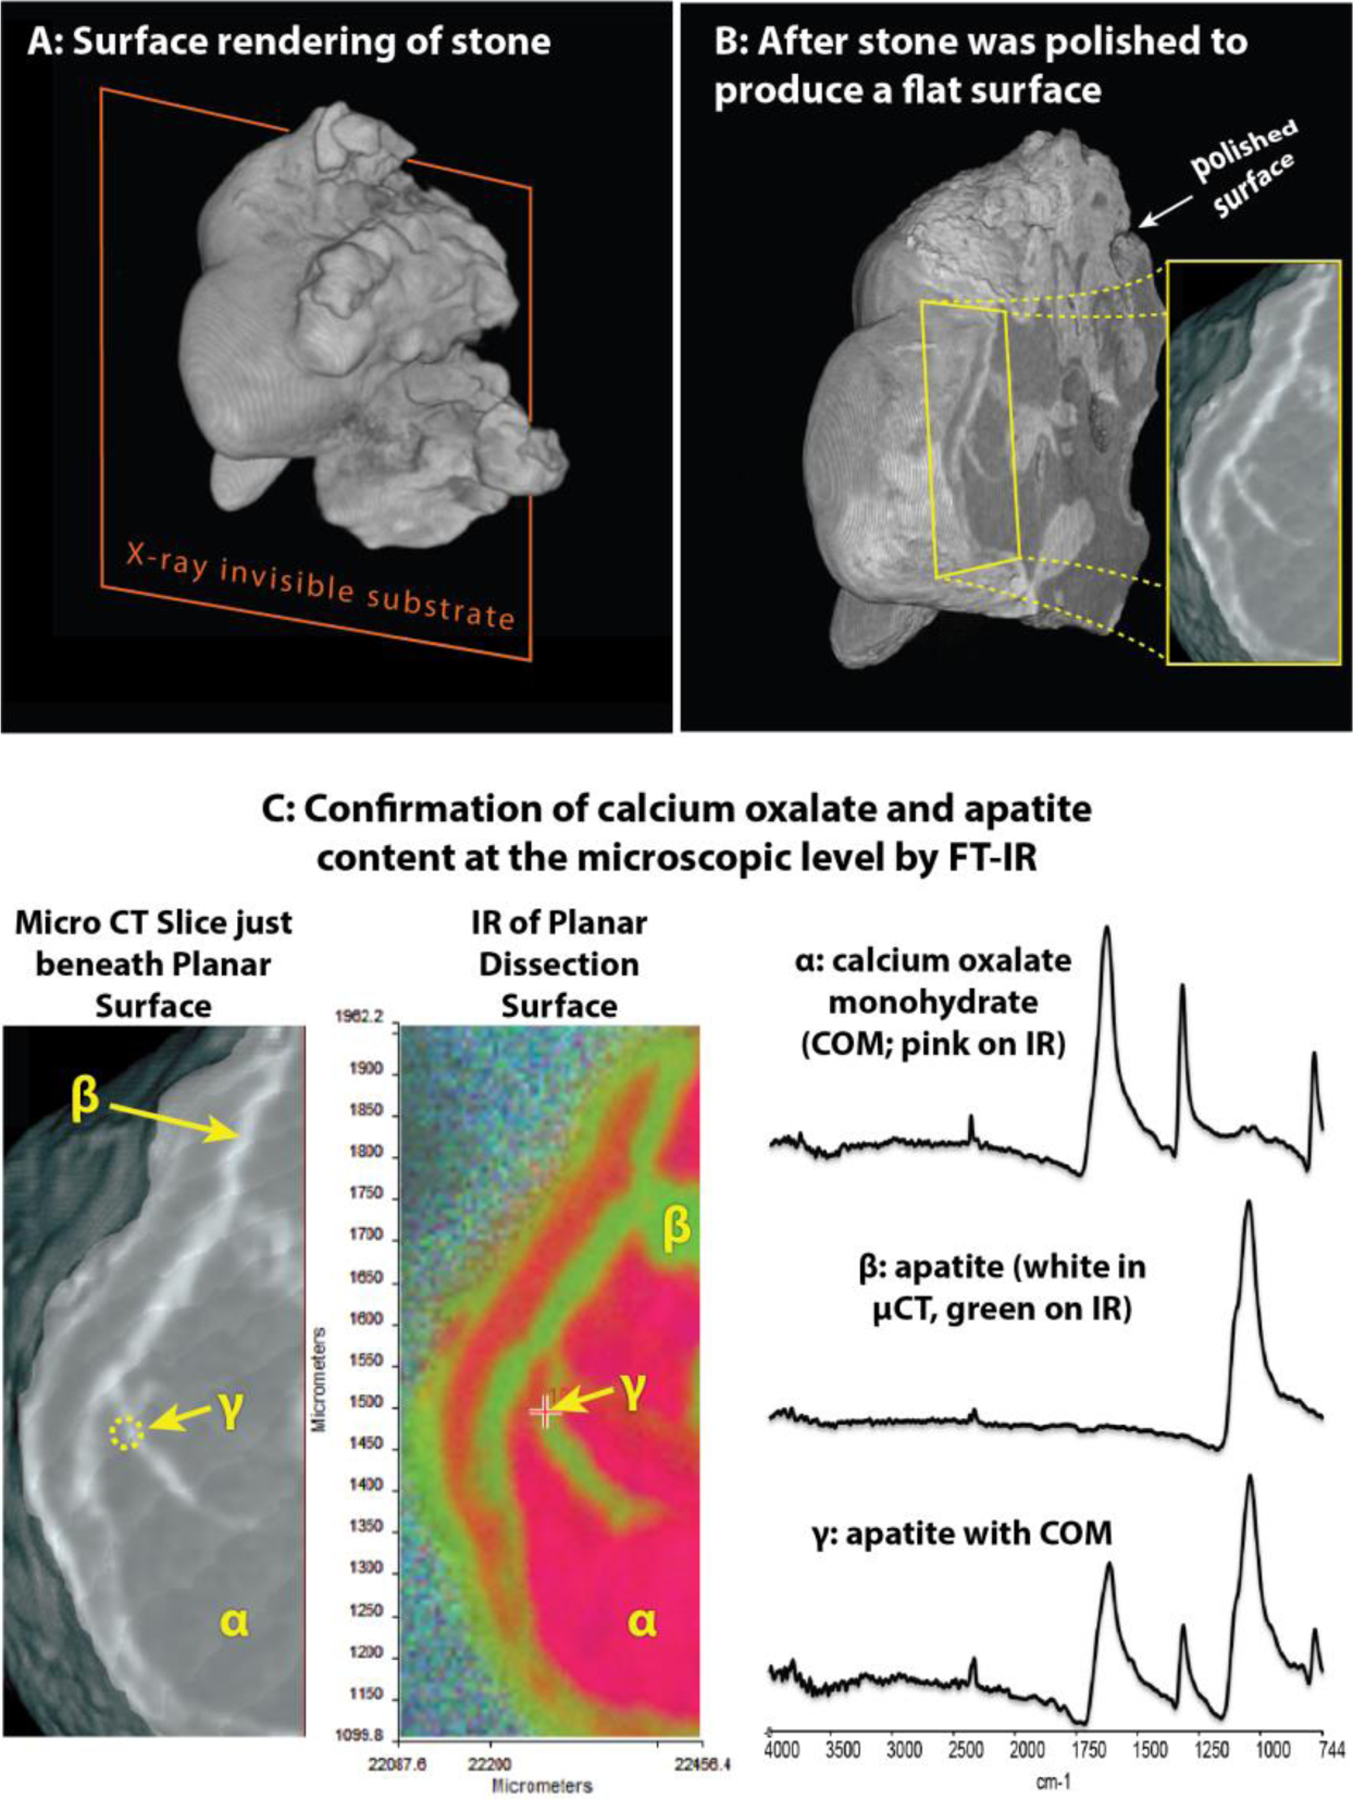
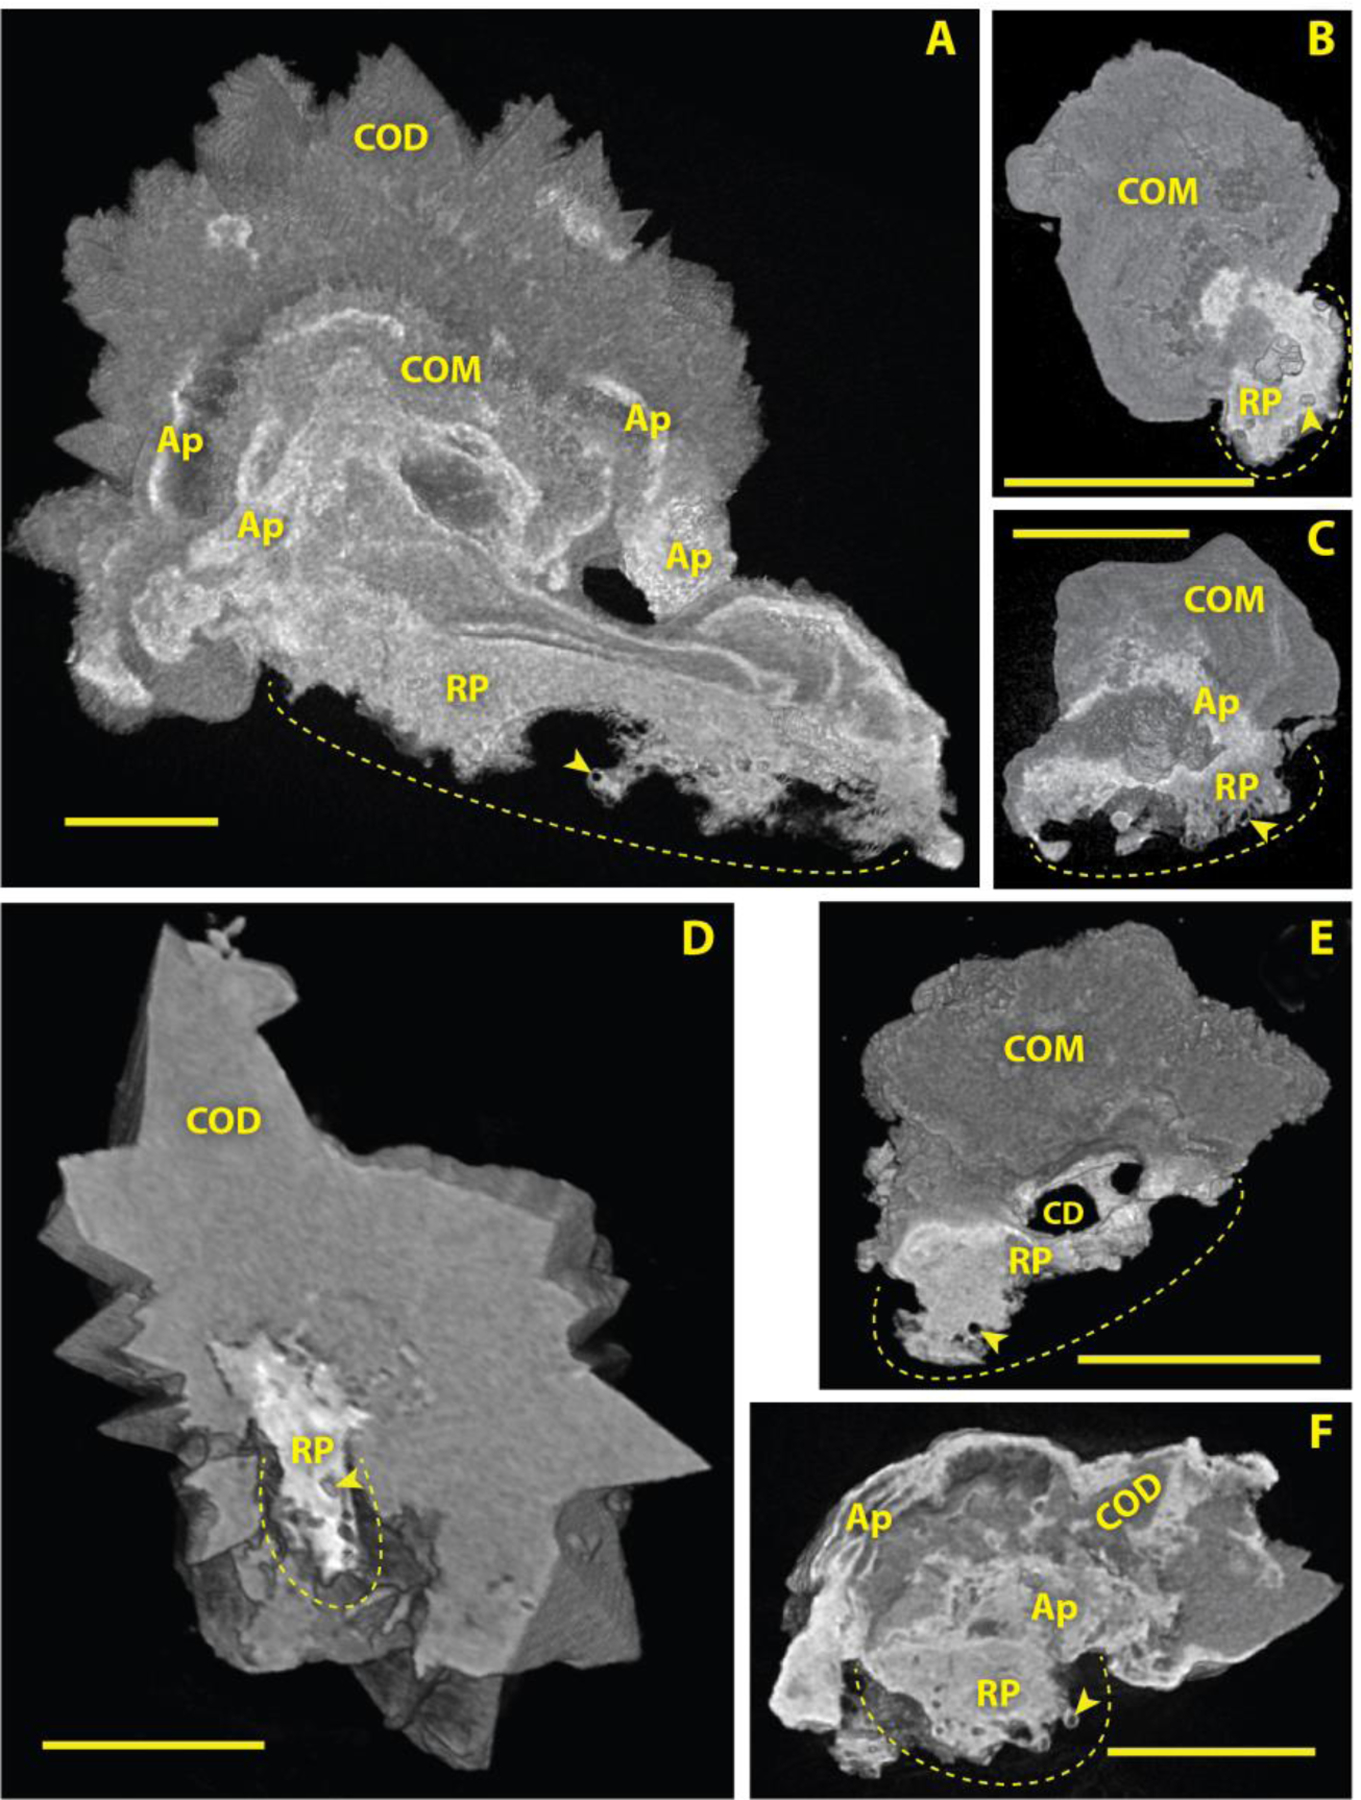
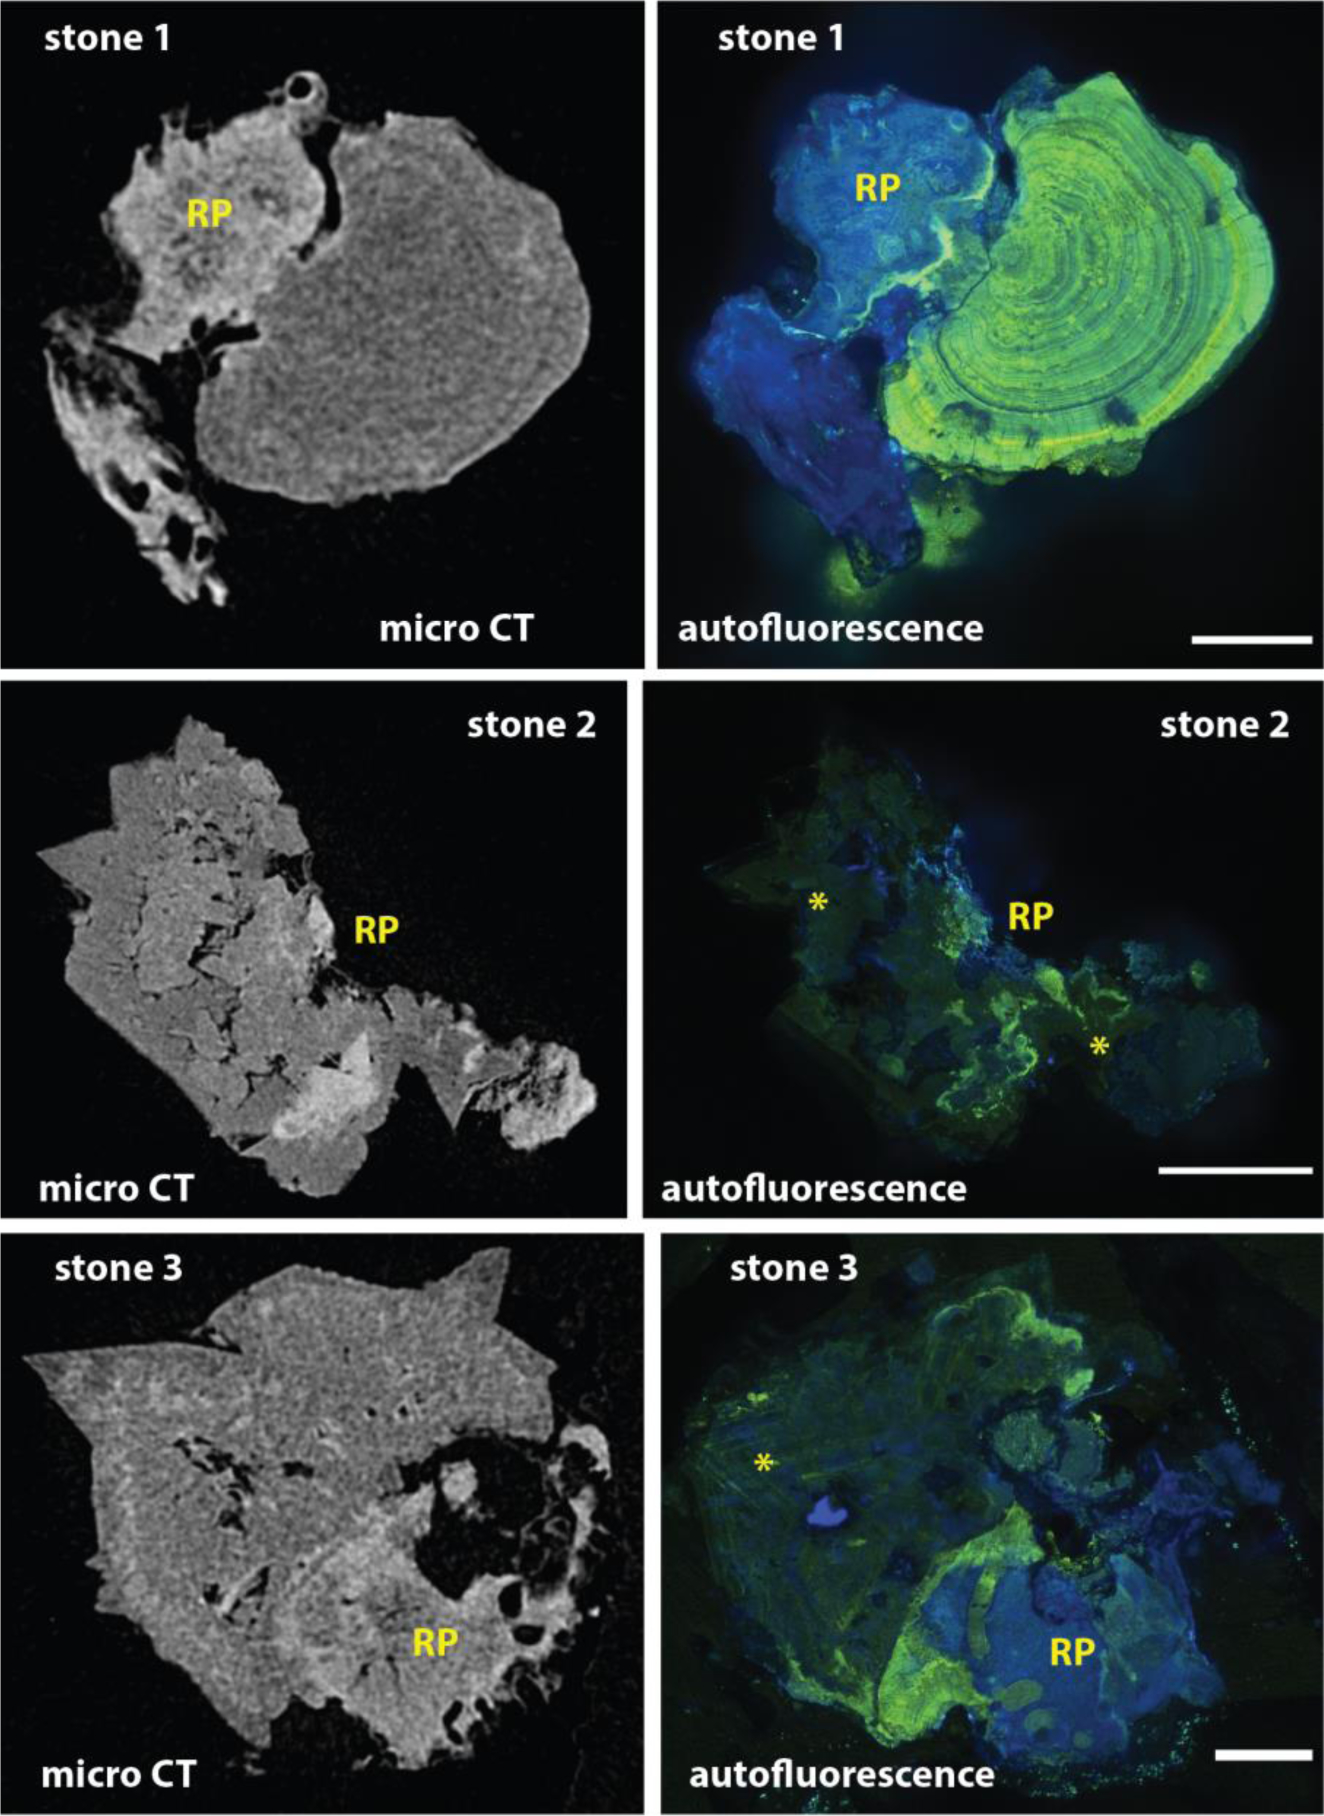
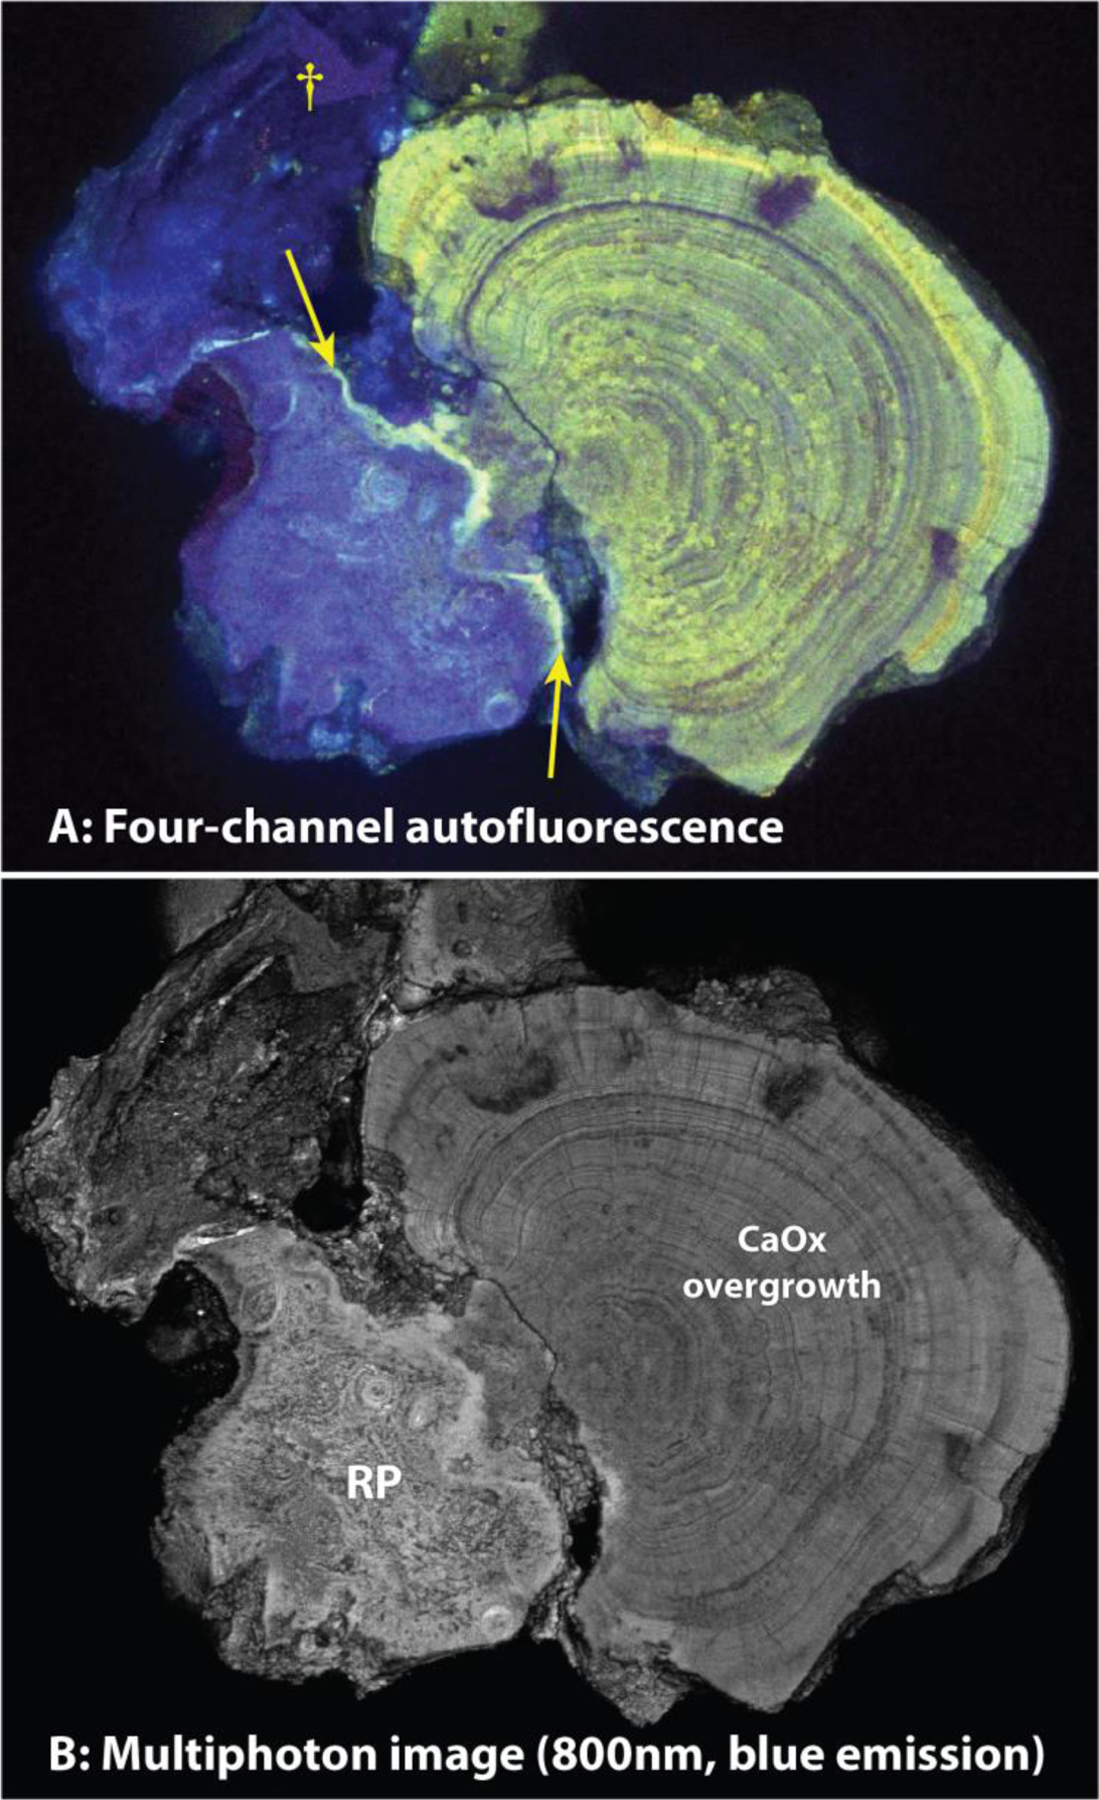
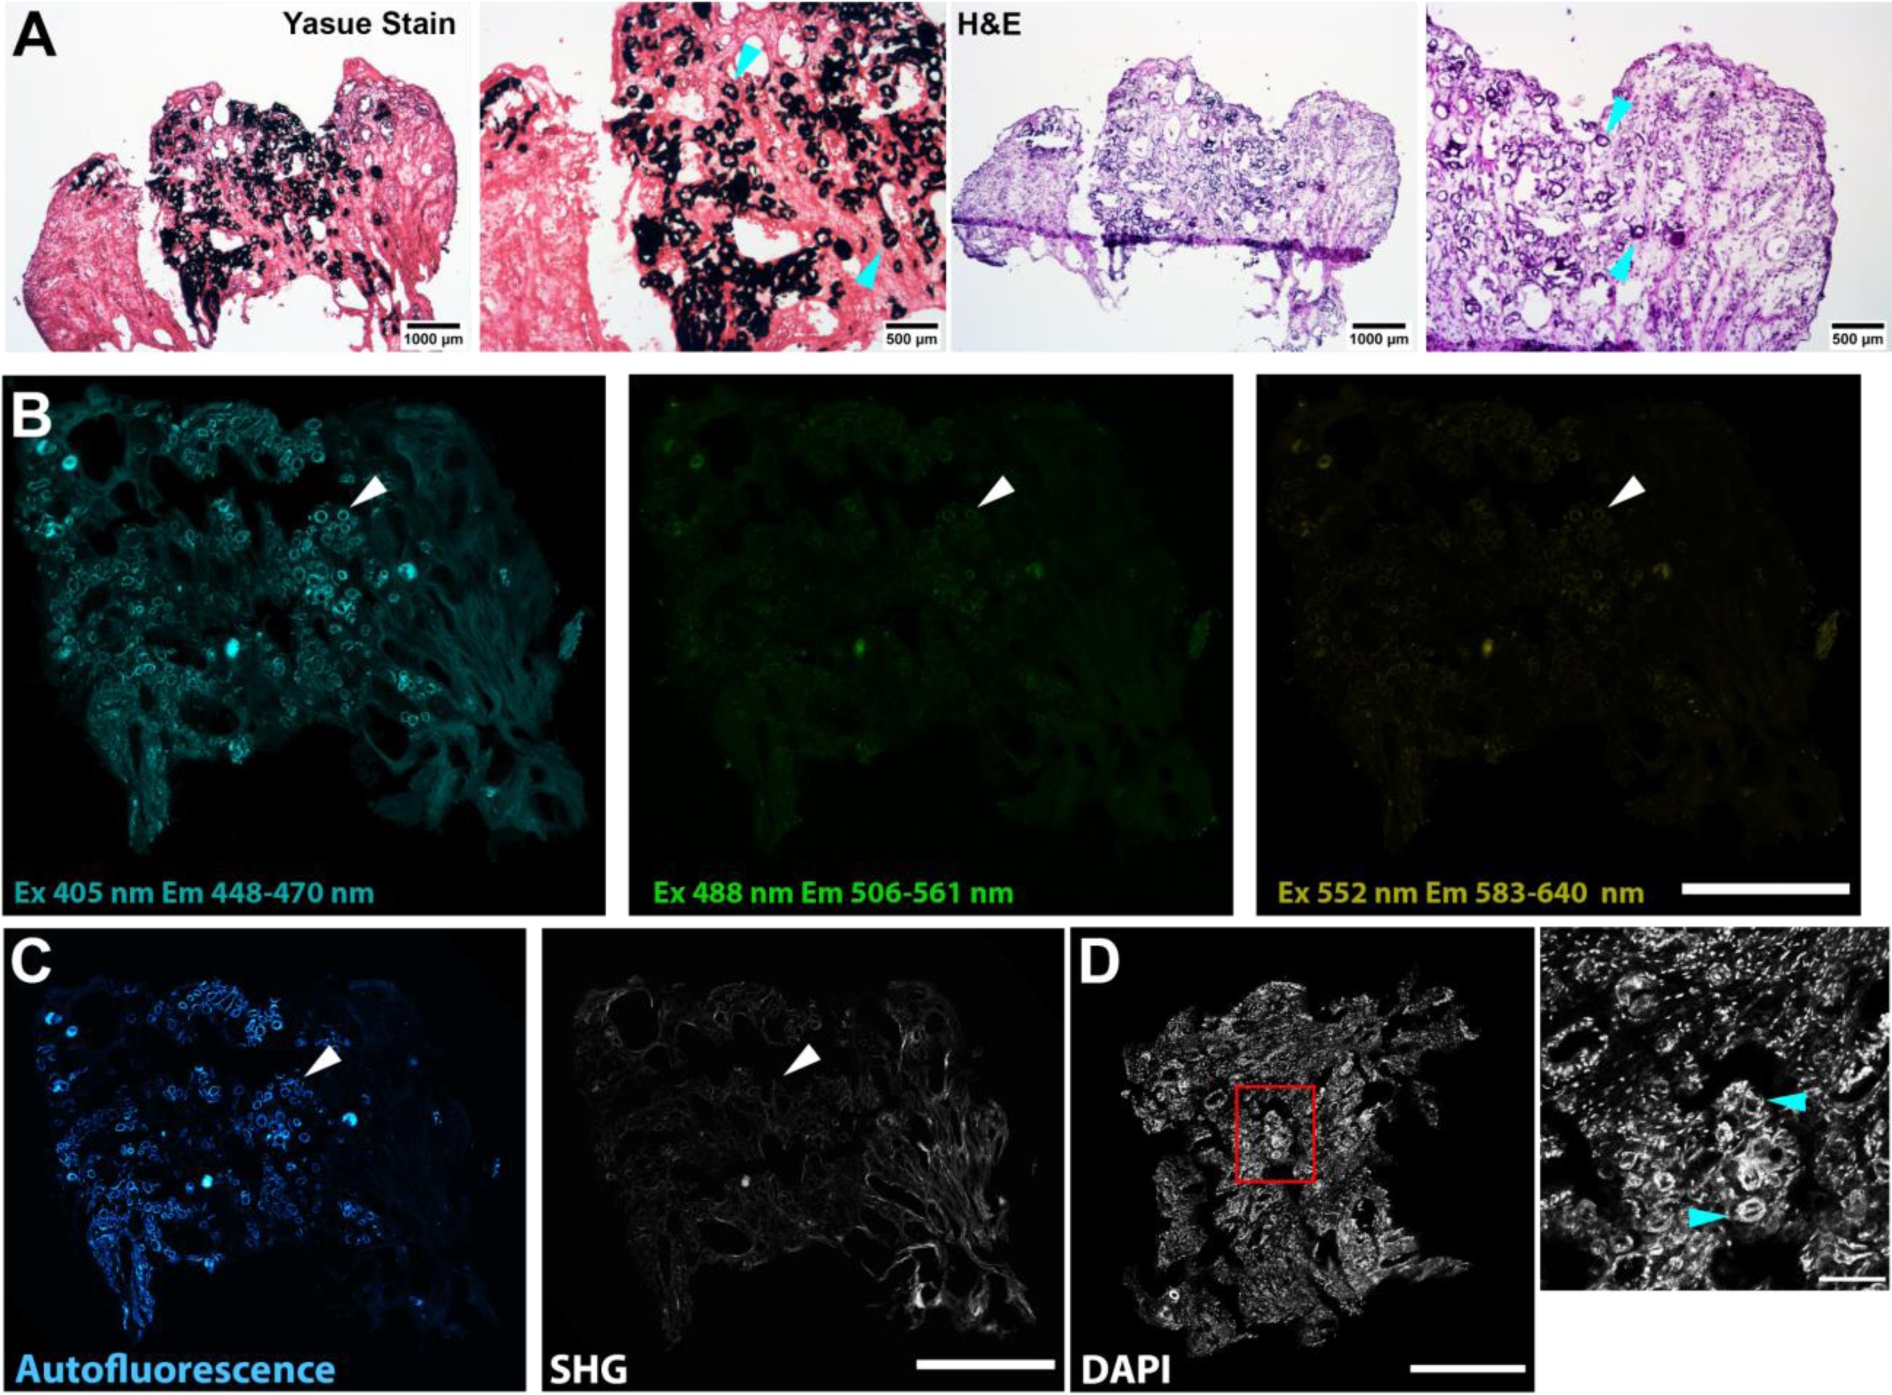
Kidney stones frequently develop as an overgrowth on Randall's plaque (RP) which is formed in the papillary interstitium. The organic composition of RP is distinct from stone matrix in that RP contains fibrillar collagen; RP in tissue has also been shown to have two proteins that are also found in stones, but otherwise the molecular constituents of RP are unstudied. We hypothesized that RP contains unique organic molecules that can be differentiated from the stone overgrowth by fluorescence. To test this, we used micro-CT-guided polishing to expose the interior of kidney stones for multimodal imaging with multiphoton, confocal and infrared microscopy. We detected a blue autofluorescence signature unique to RP, the specificity of which was also confirmed in papillary tissue from patients with stone disease. High-resolution mineral mapping of the stone also showed a transition from the apatite within RP to the calcium oxalate in the overgrowth, demonstrating the molecular and spatial transition from the tissue to the urine. This work provides a systematic and practical approach to uncover specific fluorescence signatures which correlate with mineral type, verifies previous observations regarding mineral overgrowth onto RP and identifies a novel autofluorescence signature of RP demonstrating RP's unique molecular composition.

Keywords: Calcium oxalate; Fluorescence microscopy; Infrared spectroscopy; Kidney stones; Micro-CT; Nephrolithiasis.


Conflict of interest statement

Conflicts of interest: None

Figures

Figure 1.
Figure 1.. Polishing a stone to create a flat surface (planar dissection) and confirmation of micro CT mineral identification using infrared microscopy.
A: 3D rendering of calcium oxalate stone (which was about 2.5 mm long), showing how stone was attached to polystyrene substrate. B: Same stone after being polished with emery paper to expose stone interior. Inset shows region to be examined in C. C: 3D rendering of edge of exposed interior region of stone. Left panel shows micro CT image, with the layers of apatite appearing white. Color panel shows false-color map obtained from infrared spectral shapes. Right side shows infrared spectra for spots marked in other panels.
Figure 2.
Figure 2.. Generating planar surface through Randall’s Plaque with iterative polishing.
A. A jig was constructed to hold small kidney stones mounted on polystyrene rods to facilitate polishing. The stone was polished by passes up and down emery paper adhered to paperboard surface (left and middle). After polishing the stone, the stone mounted to the styrene rod was attached to a 35 mm dish for imaging (at right). Ruler provided for scale. B. Image of stone following extraction for the patient on 1 mm grid paper. C. Image of mounted and polished stone following iterative polishing and imaging to reach desired depth. D. 3D projection of micro CT volume collected from the kidney stone mounted to a polystyrene rod. Orthogonal sections are given to indicate the cross-sectioning of Randall’s plaque and overgrowth. E. Higher magnification image of polished kidney stone surface given in C, right.
Figure 3.
Figure 3.. Micro CT appearance of stones attached to Randall’s (interstitial) plaque.
Shown are three-dimensional (3D) renderings of micro CT image stacks, each one cut away (virtually) to show the interior of the stone and the Randall’s plaque attachment. Scale bars = 500 μm. Dotted lines indicate Randall’s plaque attachment site; in vivo, these dotted lines would have lain within the tissue of the renal papilla. Arrowheads indicate lumens of calcified tubules or vessels. RP: Randall’s plaque. COD: calcium oxalate dihydrate. COM: calcium oxalate monohydrate. A: apatite within the stone overgrowth region. CD: Space marking lumen of collecting duct that apparently ran through the Randall’s plaque.
Figure 4.
Figure 4.. Infrared microscopy of stone polished down to reveal Randall’s plaque (RP) and stone overgrowth region.
A: Micro CT just below planar surface of polished stone; stone measured only 800 μm from lowest part of Randall’s plaque (left) to top of stone (right). B: Photographic montage of polished surface of stone taken on infrared microscope. C: False color image collected using reflectance mode, demonstrating homogeneity of infrared spectra of Randall’s plaque region (showing the mineral apatite) and the stone overgrowth region (showing the mineral calcium oxalate monohydrate, COM). Dotted line indicates field for D. D: False color image collected using attenuated total reflection (ATR) mode, showing neck region of overgrowth onto RP. Note interleaving of apatite and COM in region indicated by bracket.
Figure 5.
Figure 5.. Intrinsic fluorescence of interior of stones growing on Randall’s plaque (RP).
Kidney stones, all from the same patient, polished to expose kidney stone interiors and imaged by confocal fluorescence imaging. Left: Micro CT image slices of approximately the same plane as exposed by polishing. Right: Composite images of three channels of fluorescence imaging (with excitation at 405, 488, and 552 nm). Note that Randall’s plaque fluoresces mainly in the far blue range. Asterisks (*) mark regions of low fluorescence that appear to correlate with calcium oxalate dihydrate or conversion of dihydrate to monohydrate. Scale bars = 200, 500 and 200 μm for stones 1, 2, and 3, respectively.
Figure 6.
Figure 6.
Fluorescence imaging of stone polished to expose the interface between Randall’s plaque (RP) and the calcium oxalate overgrowth (A, four-channel single-photon, and B, multiphoton microscopy in only the blue range). Note fine detail visible in the multiphoton image (B). Arrows point to a layer of bright fluorescence that indicates enrichment in organic material, perhaps where RP was exposed to urine. Dagger (†) marks a piece of additional RP that apparently was torn up from the tissue during the removal of the stone from the renal papilla and which then adhered to the side of the stone.
Figure 7.
Figure 7.. Imaging of Randall’s plaque in papillary biopsy.
Serial sections were stained with Yasue (for mineral) and H&E, or imaged unstained to detect label-free autofluorescence, followed by reimaging after DAPI staining for nuclei. A: Adjacent sections stained with Yasue (left) and H&E (right). Cyan arrowheads indicate silver precipitation by Yasue staining or basophilic staining by H&E. Scale bars as indicated. B: Label-free autofluorescence imaging of unstained adjacent section with confocal fluorescence microscopy, excitation (Ex) and emission (Em) as indicated. Scale bar = 500 μm. C: Label-free autofluorescence imaging on unstained adjacent section with illumination at 910 nm and emission at 448–470 nm (left) and collection at 400–450 nm (right). Left shows distinct autofluorescence that correlates with Randall’s plaque mineral shown in A (arrowhead). Right shows second harmonic generation (SHG) which indicates the presence of fibrillar collagen. Scale bar = 500 μm. D: Following staining with DAPI, both nuclei and plaque autofluorescence are visible. Randall’s plaque appears as bright rings (arrowheads) fluorescing in the same range as the DAPI-stained nuclei. Left shows low-power with red box indicating field shown on right. Scale bar = 500 (left) and 100 (right) μm.

References

    1. Scales CD Jr, Smith AC, Hanley JM, Saigal CS (2012) Prevalence of Kidney Stones in the United States. European Urology 62: 160–165 - PMC - PubMed
    1. Williams JC Jr., McAteer JA (2013) Retention and growth of urinary stones—Insights from imaging. J Nephrol 26: 25–31 - PMC - PubMed
    1. Letavernier E, Vandermeersch S, Traxer O, Tligui M, Baud L, Ronco P, Haymann JP, Daudon M (2015) Demographics and characterization of 10,282 Randall plaque-related kidney stones: A new epidemic? Medicine (Baltimore) 94: e566. - PMC - PubMed
    1. Verrier C, Bazin D, Huguet L, Stéphan O, Gloter A, Verpont M-C, Frochot V, Haymann J-P, Brocheriou I, Traxer O, Daudon M, Letavernier E (2016) Topography, composition and structure of incipient Randall’s plaque at the nanoscale level. J Urol 196: 1566–1574 - PubMed
    1. Williams JC Jr., Lingeman JE, Coe FL, Worcester EM, Evan AP (2015) Micro-CT imaging of Randall’s plaques. Urolithiasis 43: 13–17 - PMC - PubMed

LinkOut - more resources