. 2021 Jan 1;320(1):L99-L125.
doi: 10.1152/ajplung.00381.2020. Epub 2020 Oct 7.

Compartment-specific transcriptomics of ozone-exposed murine lungs reveals sex- and cell type-associated perturbations relevant to mucoinflammatory lung diseases

Affiliations

Compartment-specific transcriptomics of ozone-exposed murine lungs reveals sex- and cell type-associated perturbations relevant to mucoinflammatory lung diseases

Ishita Choudhary et al. Am J Physiol Lung Cell Mol Physiol. .

Abstract

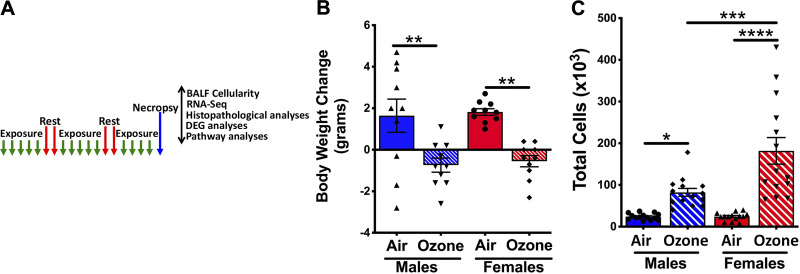
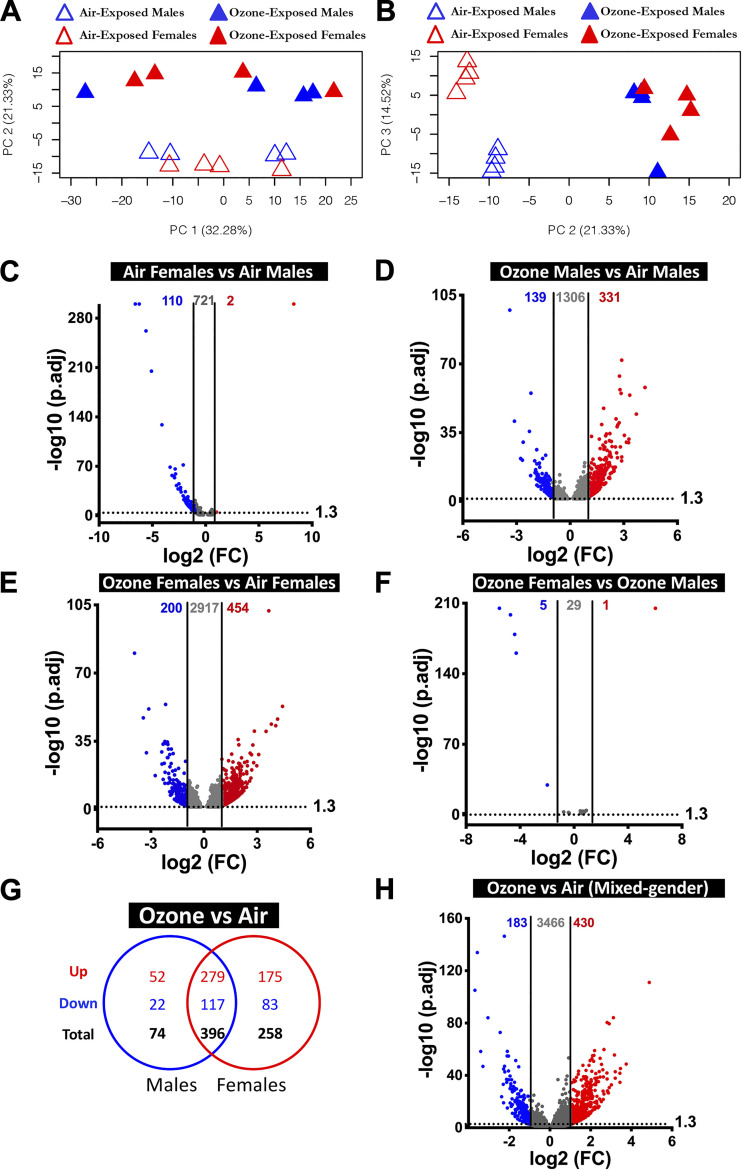
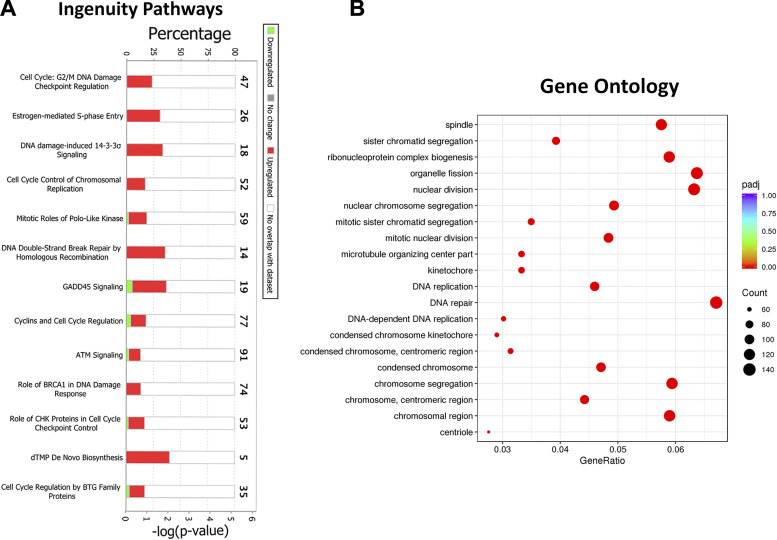
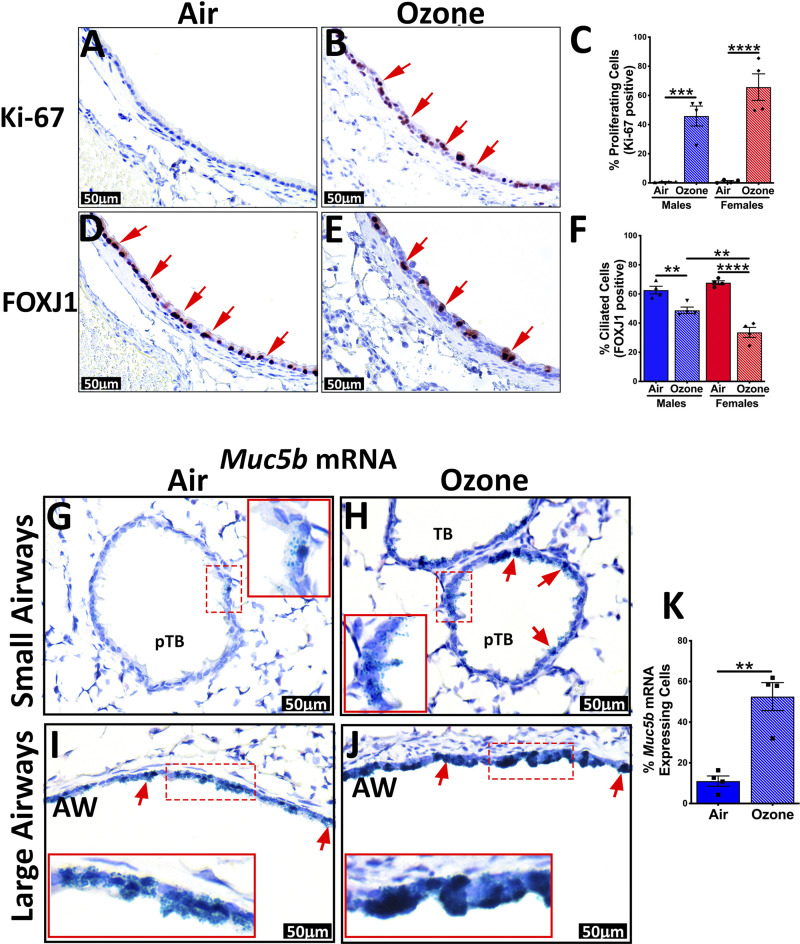
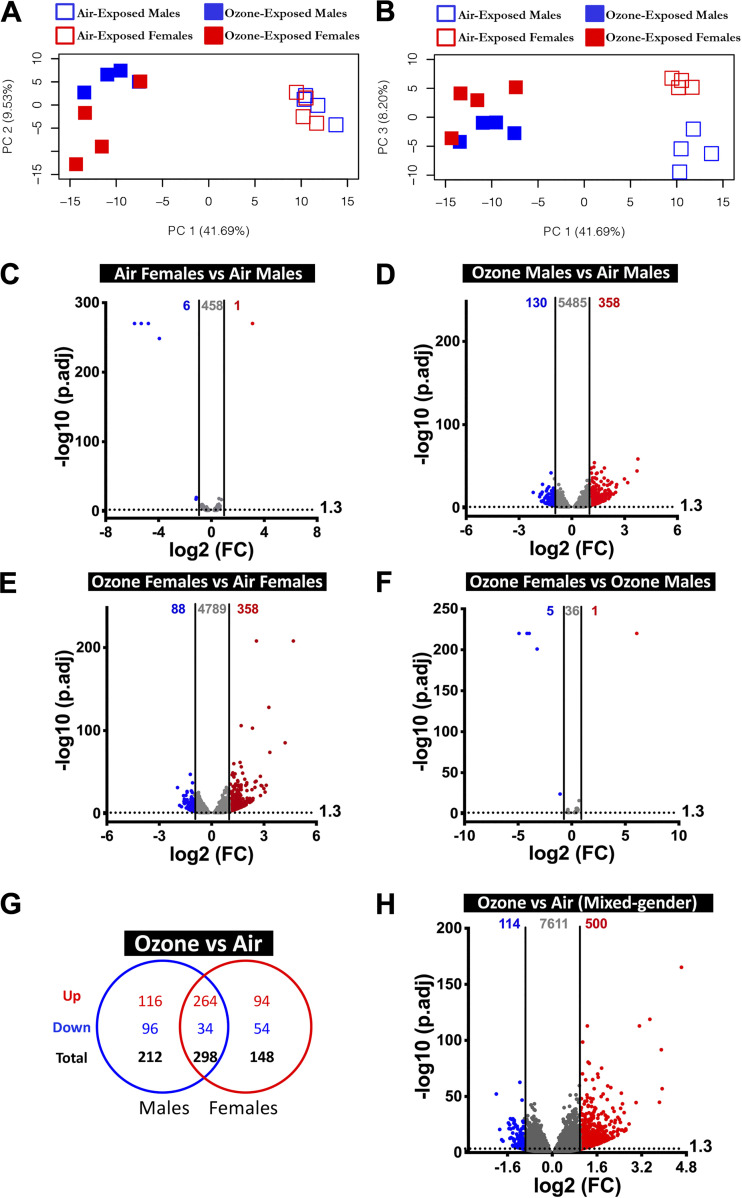
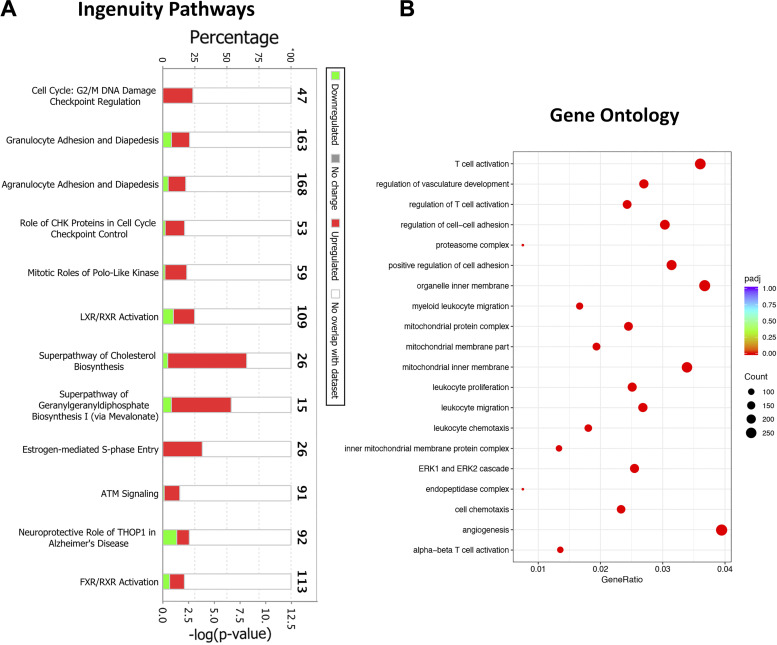
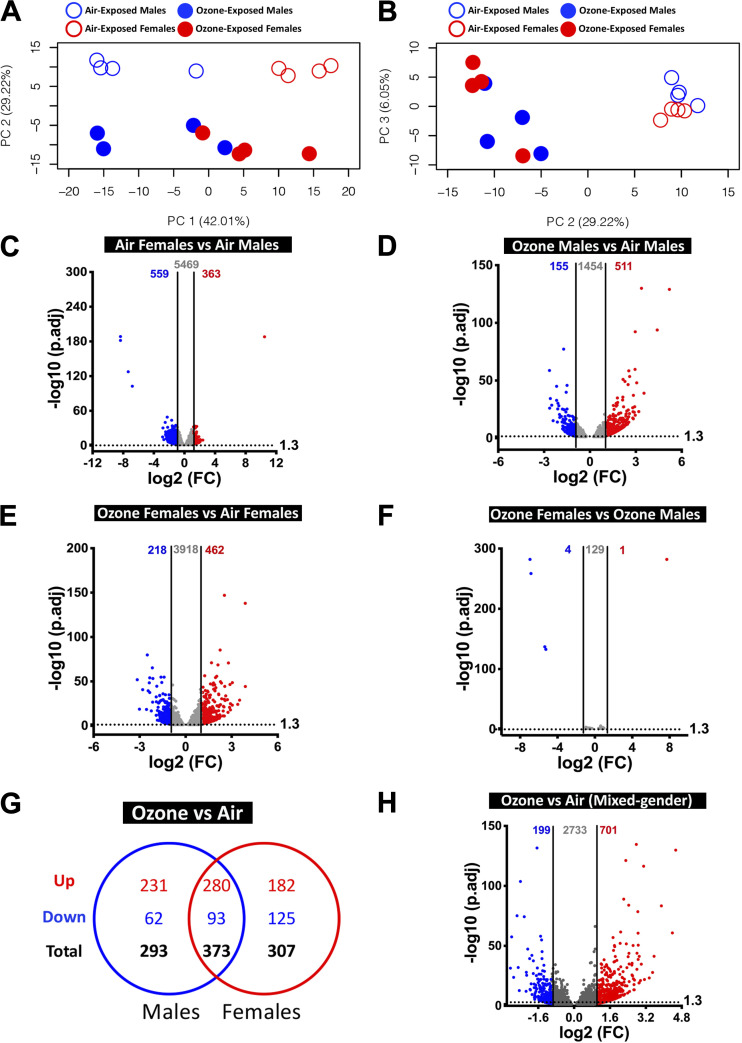
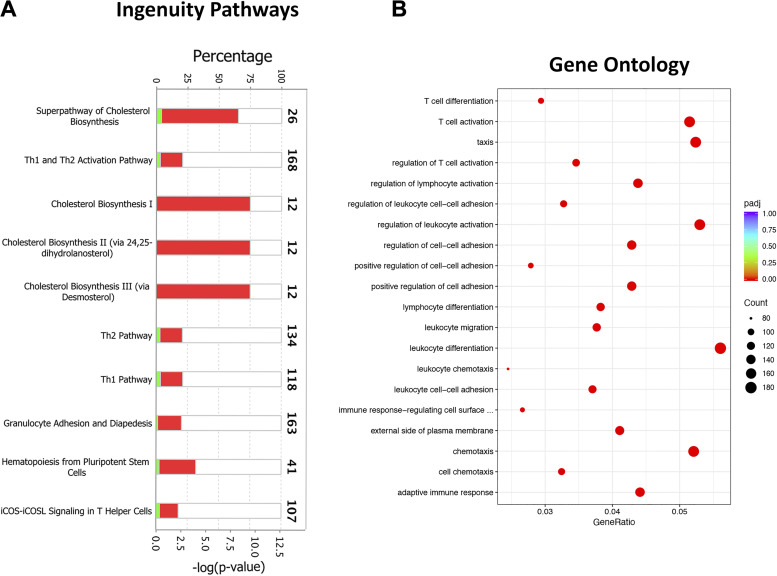
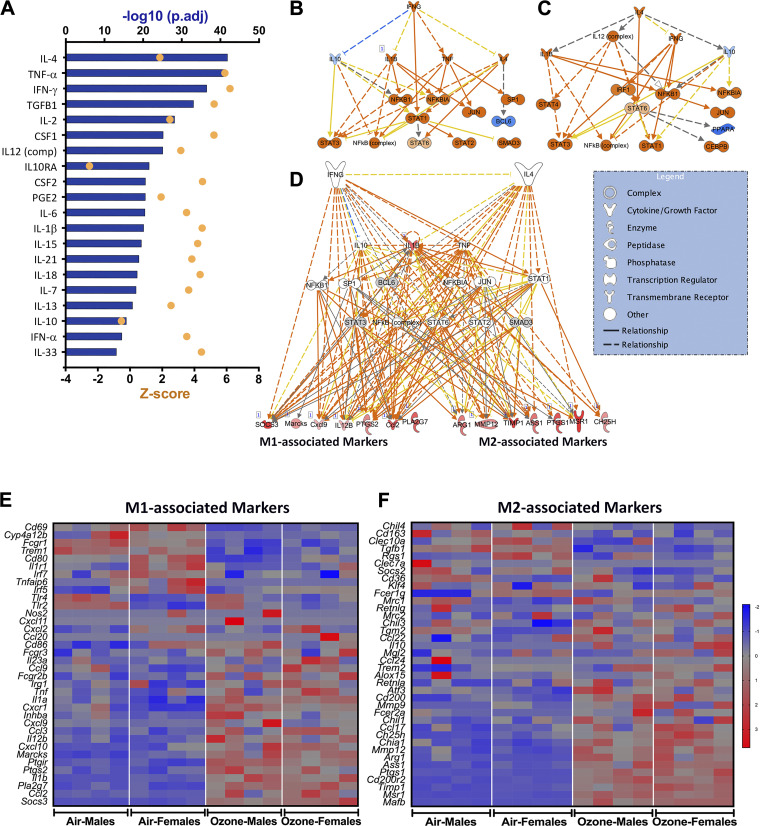
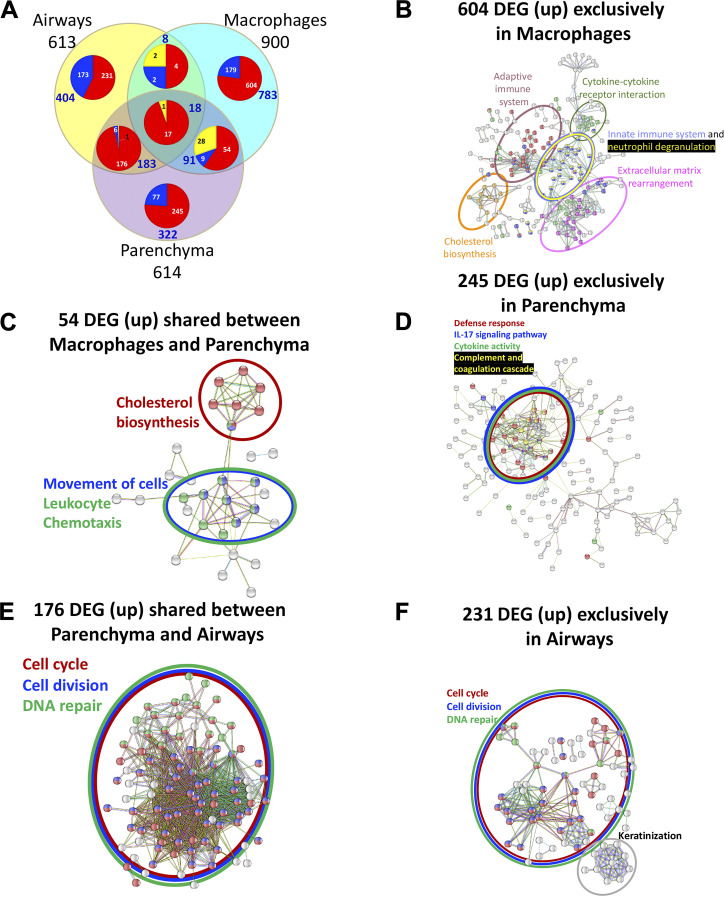
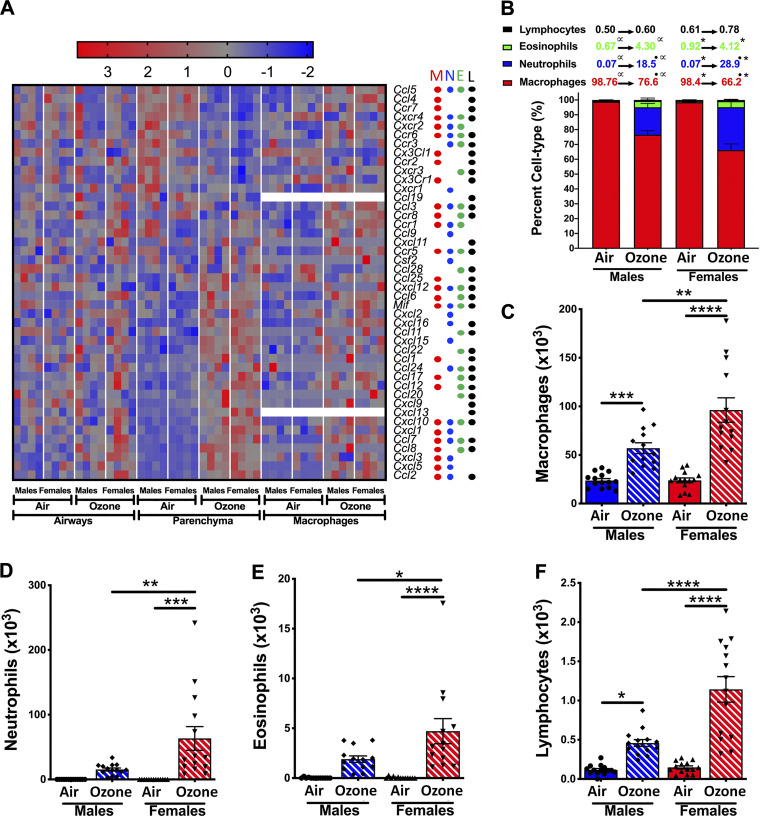
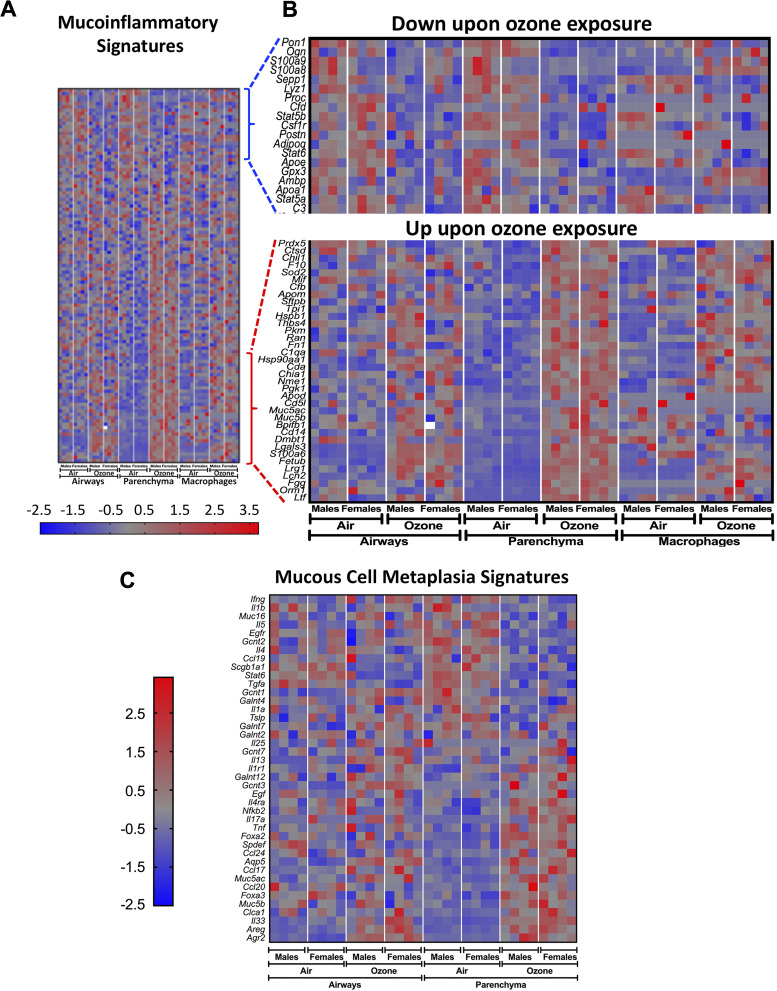
Ozone is known to cause lung injury, and resident cells of the respiratory tract (i.e., epithelial cells and macrophages) respond to inhaled ozone in a variety of ways that affect their survival, morphology, and functioning. However, a complete understanding of the sex-associated and the cell type-specific gene expression changes in response to ozone exposure is still limited. Through transcriptome profiling, we aimed to analyze gene expression alterations and associated enrichment of biological pathways in three distinct cell type-enriched compartments of ozone-exposed murine lungs. We subchronically exposed adult male and female mice to 0.8 ppm ozone or filtered air. RNA-Seq was performed on airway epithelium-enriched airways, parenchyma, and purified airspace macrophages. Differential gene expression and biological pathway analyses were performed and supported by cellular and immunohistochemical analyses. While a majority of differentially expressed genes (DEGs) in ozone-exposed versus air-exposed groups were common between both sexes, sex-specific DEGs were also identified in all of the three tissue compartments. As compared with ozone-exposed males, ozone-exposed females had significant alterations in gene expression in three compartments. Pathways relevant to cell division and DNA repair were enriched in the ozone-exposed airways, indicating ozone-induced airway injury and repair, which was further supported by immunohistochemical analyses. In addition to cell division and DNA repair pathways, inflammatory pathways were also enriched within the parenchyma, supporting contribution by both epithelial and immune cells. Further, immune response and cytokine-cytokine receptor interactions were enriched in macrophages, indicating ozone-induced macrophage activation. Finally, our analyses also revealed the overall upregulation of mucoinflammation- and mucous cell metaplasia-associated pathways following ozone exposure.

Keywords: airways; gene expression; macrophages; ozone; parenchyma.


Conflict of interest statement

No conflicts of interest, financial or otherwise, are declared by the authors.

Figures

Figure 1.
Figure 1.
A: ozone exposure disrupts body weight gain and alters bronchoalveolar lavage fluid (BALF) immune cell counts. A: experimental design depicting exposure regimen and designated outcomes examined. B: increase (positive values) or decrease (negative values) in body weight over the 3 wk of exposure to filtered air or ozone. C: total cells recovered in 300 μL of the first two lavages from air- and ozone-exposed males and females. Error bars represent means ± SE. *P < 0.05, **P < 0.01, ***P < 0.001, ****P < 0.0001, using one-way ANOVA followed by the Tukey multiple-comparison post hoc test. (n = 13 or 14 per group). BALF, bronchoalveolar lavage fluid.
Figure 2.
Figure 2.
Transcriptional responses in airway epithelial cell-enriched compartment. A: two-dimensional principal component (PC) analysis plot using PC1 and PC2 on all the detected genes (after normalization) in air- and ozone-exposed airways. B: two-dimensional PC analysis plot using PC2 and PC3 on all the detected genes (after normalization) in air- and ozone-exposed airways. CF: volcano plots depicting differentially expressed genes (DEGs; upregulated and downregulated) in four different comparisons that were identified using cutoff criteria (Log2 Fold change>1, adjusted P < 0.05). C: air-exposed females vs. air-exposed males (DEGs = 112). D: ozone-exposed males vs. air-exposed males (DEGs = 470). E: ozone-exposed females vs. air-exposed females (DEGs = 654). F: ozone-exposed females vs. ozone-exposed males (DEGs = 6). (n = 4 per sex per treatment). G: Venn diagram depicting common and unique DEGs (upregulated and downregulated) in ozone-exposed males vs. air-exposed males and ozone-exposed females vs. air-exposed females. H: volcano plots depicting DEGs (upregulated and downregulated) in airways from ozone-exposed mice vs. air-exposed mice. DEG, differentially expressed genes.
Figure 3.
Figure 3.
Biological pathway analyses on differentially expressed genes in airway transcriptome from ozone-exposed mice. A: stacked bar graph depicting most enriched biological pathways identified using ingenuity pathway (IP) analysis approach. B: dot plot showing enrichment of gene ontology biological processes, including biological processes, cell component, and molecular function. ATM, ataxia-telangiectasiamutated; BRCA1, breast cancer type 1 susceptibility protein; BTG, B cell translocation gene; CHK, checkpoint kinase; dTMP, deoxythymidine monophosphate.
Figure 4.
Figure 4.
Immunohistochemical and in situ RNAscope staining of airways for epithelial remodeling-associated changes. Representative photomicrographs of Ki-67 stained lung sections from air-exposed (A) and ozone-exposed mice (B). C: percentage of Ki-67 stained cells in the first-generation airways from air- and ozone-exposed mice. Representative photomicrographs of FOXJ1-stained lung sections from air-exposed (D) and ozone-exposed mice (E). F: percentage of FOXJ1-stained cells in the first-generation airways from air- and ozone-exposed mice. Error bars represent means ± SE **P < 0.01, ***P < 0.001, ****P < 0.0001 using one-way ANOVA followed by the Tukey multiple-comparison post hoc test. (n = 4 per group). G–J: mRNA expression of Muc5b in airways of air-exposed and ozone-exposed mice was detected by RNAscope assay. Representative photomicrographs depicting Muc5b mRNA signal (green dots, as well as green-stained cells, red arrows) air-exposed (G; small airways, I; large airways) and ozone-exposed mice (H; small airways, J; large airways). Inset outlined with red solid box is the higher magnification of what is depicted in the red dashed box. K: percentage of Muc5b mRNA-expressing cells in the smaller airways from air- and ozone-exposed mice. AW, 1st generation airway; pTB, preterminal bronchiole; TB, terminal bronchiole.
Figure 5.
Figure 5.
Transcriptional responses in the parenchyma. A: two-dimensional principal component (PC) analysis plot using PC1 and PC2 on all the detected genes (after normalization) in the parenchyma from air- and ozone-exposed mice. B: two-dimensional principal component (PC) analysis plot using PC1 and PC3 on all of the detected genes (after normalization) in the parenchyma from air- and ozone-exposed mice. CF: volcano plots depicting differentially expressed genes (DEGs, upregulated and downregulated) in four different comparisons that were identified using cutoff criteria (Log2 Fold change > 2, adjusted P values < 0.05). C: air-exposed females vs. air-exposed males (DEGs = 7). D: ozone-exposed males vs. air-exposed males (DEGs = 488). E: ozone-exposed females vs. air-exposed females (DEGs = 446). F: ozone-exposed females vs. ozone-exposed males (DEGs = 6). (n = 4 per sex per treatment). G: Venn diagram depicting common and unique DEGs (upregulated and downregulated) in ozone-exposed males vs. air-exposed males and ozone-exposed females vs. air-exposed females. H: volcano plots depicting differentially expressed genes (DEGs; upregulated and downregulated) in the parenchyma from ozone-exposed mice vs. air-exposed mice.
Figure 6.
Figure 6.
Biological pathway analyses on differentially expressed genes in the parenchyma from ozone-exposed mice. A: stacked bar graph depicting enrichment of biological pathways identified using the ingenuity pathway (IP) analysis approach. B: dot plot showing enrichment of gene ontology biological processes, including biological processes, cell component, and molecular function. ATM, ataxia-telangiectasiamutated; CHK, checkpoint kinase; FXR/RXR, farnesoid X receptor/retinoid X receptor; LXR/RXR, liver X receptor/retinoid X receptor; THOP1, thimet oligopeptidase 1.
Figure 7.
Figure 7.
Transcriptional responses in purified macrophages. A: two-dimensional principal component (PC) analysis plot using PC1 and PC2 on all the detected genes (after normalization) in macrophages from air- and ozone-exposed mice. B: two-dimensional PC analysis plot using PC2 and PC3 on all the detected genes (after normalization) in macrophages from air- and ozone-exposed mice. CF: volcano plots depicting differentially expressed genes (DEGs, upregulated and downregulated) in four different comparisons that were identified using cutoff criteria (Log2 fold change > 2, adjusted P values < 0.05). C: air-exposed females vs. air-exposed males (DEGs = 922). D: ozone-exposed males vs. air-exposed males (DEGs = 666). E: ozone-exposed females vs. air-exposed females (DEGs = 680). F: ozone-exposed females vs. ozone-exposed males (DEGs = 5). (n = 4 per sex per treatment). G: Venn diagram depicting common and unique DEGs (upregulated and downregulated) in ozone-exposed males vs. air-exposed males and ozone-exposed females vs. air-exposed females. H: volcano plots depicting DEGs (upregulated and downregulated) in macrophages from ozone-exposed mice vs. air-exposed mice.
Figure 8.
Figure 8.
Biological pathway analyses on differentially expressed genes in purified macrophages from ozone-exposed mice. A: stacked bar graph depicting enrichment of biological pathways identified using ingenuity pathway analysis approach. B: dot plot showing enrichment of gene ontology biological processes, including biological processes, cell component, and molecular function. iCOS-iCOSL, inducible T-cell costimulator-inducible T-cell costimulator-ligand.
Figure 9.
Figure 9.
Upstream regulator and differentially expressed genes (DEG) analyses reveal mixed macrophage activation patterns. A: ingenuity pathway analysis (IPA) for upstream regulators shown as a bar graph depicting upstream cytokines predicted to drive differential expression of genes in macrophages. Orange dots represent Z-score, and blue bars represent -log10 (P-adjusted) values. Mechanistic transcriptional network regulated by IFN-γ (B) and IL-4 (C). D: integrated mechanistic network depicting crosstalk between IL-4- and IFN-γ-regulated pathways and effector genes associated with classical (M1) and alternatively (M2) activated macrophages. The functional networks were generated using the Qiagen IPA analyses tool. Heat maps for normalized gene expression values (Z-scores) of classically (M1) (E) and alternative (M2) activation-associated genes (F) in purified macrophages. Higher and lower expressions of each gene are represented by red and blue colors, respectively.
Figure 10.
Figure 10.
Comparison of differentially expressed genes (DEGs) between three tissue compartments and their STRING analyses reveals enrichment of tissue-specific biological networks. A: integrated Venn diagram showing unique and shared DEGs across three tissue compartments in ozone-exposed mice vs. air-exposed mice. 613 (yellow-filled circle), 614 (pink-filled circle), and 900 (aqua-filled circle) DEGs from airways, parenchyma, and macrophages, were analyzed to identify the number of upregulated (depicted by red sector of the pie chart), downregulated (depicted by blue sector of the pie chart), and differentially regulated genes in the opposite direction in different tissues (depicted by yellow sector of the pie chart), respectively. The list of unique and shared DEGs between the three compartments is included in Supplemental Table S7. B: STRING database protein-protein interaction network analyses on 604 genes that were exclusively upregulated in macrophages from ozone-exposed mice vs. air-exposed mice. C: STRING database protein-protein interaction network analyses on 54 genes that were upregulated in both tissues, i.e., macrophages and parenchyma, from ozone-exposed mice vs. air-exposed mice. D: STRING database protein-protein interaction network analyses on 245 genes that were exclusively upregulated in the parenchyma from ozone-exposed mice vs. air-exposed mice. E: STRING database protein-protein interaction network analyses on 176 genes that were upregulated in both tissues, i.e., airways and parenchyma, from ozone-exposed mice vs. air-exposed mice. F: STRING database protein-protein interaction network analyses on 231 genes that were exclusively upregulated in airways from ozone-exposed mice vs. air-exposed mice. Interactions were determined on the basis of evidence, using the highest confidence level (0.9) setting.
Figure 11.
Figure 11.
A: ozone exposure alters gene expression of chemokines and bronchoalveolar lavage fluid immune cell composition. A: heat maps for normalized gene expression values (Z-scores) of chemokine genes in the three compartments. Higher and lower expressions of each gene are represented by red and blue colors, respectively. The relevance of each chemokine in the recruitment of macrophages (M), neutrophils (N), eosinophils (E), and lymphocytes (L) is indicated with red, blue, green, or black dots, respectively. B: percent distributions of immune cells are shown as a stacked bar graph [macrophages (red), neutrophils (blue), eosinophils (green), and lymphocytes (black)]. Values with identical superscript symbols represent a significant difference (P < 0.05). Differential cell counts for macrophages (C), neutrophils (D), eosinophils (E), and lymphocytes (F). Error bars represent means ± SE. *P < 0.05, **P < 0.01, ***P < 0.001, ****P < 0.0001 using ANOVA followed by the Tukey multiple-comparison post hoc test. (n = 13–14 per group).
Figure 12.
Figure 12.
Gene expression analyses for genes relevant to mucoinflammatory lung diseases and mucous cell metaplasia responses. A: heat maps for normalized gene expression values (Z-scores) of genes associated with mucoinflammatory lung diseases in mice and humans. Low-resolution heat map (left) depicting expression patterns for the entire mucoinflammatory gene set (high-resolution heat map with gene names is presented in Supplemental Fig. S4). Heat map corresponding to gene signatures that were downregulated (B, top) or upregulated (B, bottom) in one or more tissues from ozone-exposed mice was amplified for better resolution. C: heat map for normalized gene expression values (Z-scores) of genes associated with mucous cell metaplasia in mice and humans.

References

    1. Anenberg SC, Henze DK, Tinney V, Kinney PL, Raich W, Fann N, Malley CS, Roman H, Lamsal L, Duncan B, Martin RV, van Donkelaar A, Brauer M, Doherty R, Jonson JE, Davila Y, Sudo K, Kuylenstierna JCI. Estimates of the global burden of ambient PM2.5, ozone, and NO2 on asthma incidence and emergency room visits. Environ Health Perspect 126: 107004, 2018. doi:10.1289/EHP3766. - DOI - PMC - PubMed
    1. Ashburner M, Ball CA, Blake JA, Botstein D, Butler H, Cherry JM, Davis AP, Dolinski K, Dwight SS, Eppig JT, Harris MA, Hill DP, Issel-Tarver L, Kasarskis A, Lewis S, Matese JC, Richardson JE, Ringwald M, Rubin GM, Sherlock G; The Gene Ontology Consortium . Gene ontology: tool for the unification of biology. Nat Genet 25: 25–29, 2000. doi:10.1038/75556. - DOI - PMC - PubMed
    1. Aziz A, Soucie E, Sarrazin S, Sieweke MH. MafB/c-Maf deficiency enables self-renewal of differentiated functional macrophages. Science 326: 867–871, 2009. doi:10.1126/science.1176056. - DOI - PubMed
    1. Backus GS, Howden R, Fostel J, Bauer AK, Cho H-Y, Marzec J, Peden DB, Kleeberger SR. Protective role of interleukin-10 in ozone-induced pulmonary inflammation. Environ Health Perspect 118: 1721–1727, 2010. doi:10.1289/ehp.1002182. - DOI - PMC - PubMed
    1. Bell ML, McDermott A, Zeger SL, Samet JM, Dominici F. Ozone and short-term mortality in 95 US urban communities, 1987-2000. JAMA 292: 2372–2378, 2004. doi:10.1001/jama.292.19.2372. - DOI - PMC - PubMed

Publication types

MeSH terms