. 2020 Dec 1;124(6):1706-1726.
doi: 10.1152/jn.00171.2020. Epub 2020 Oct 7.

Amplitude modulation encoding in the auditory cortex: comparisons between the primary and middle lateral belt regions

Affiliations

Amplitude modulation encoding in the auditory cortex: comparisons between the primary and middle lateral belt regions

Jeffrey S Johnson et al. J Neurophysiol. .

Abstract

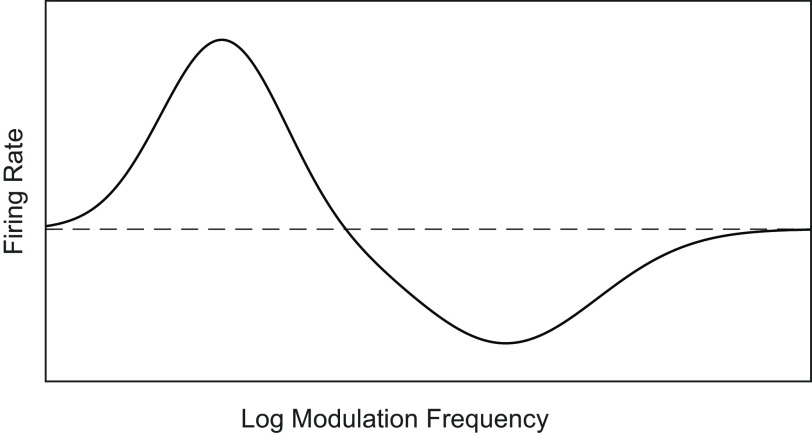
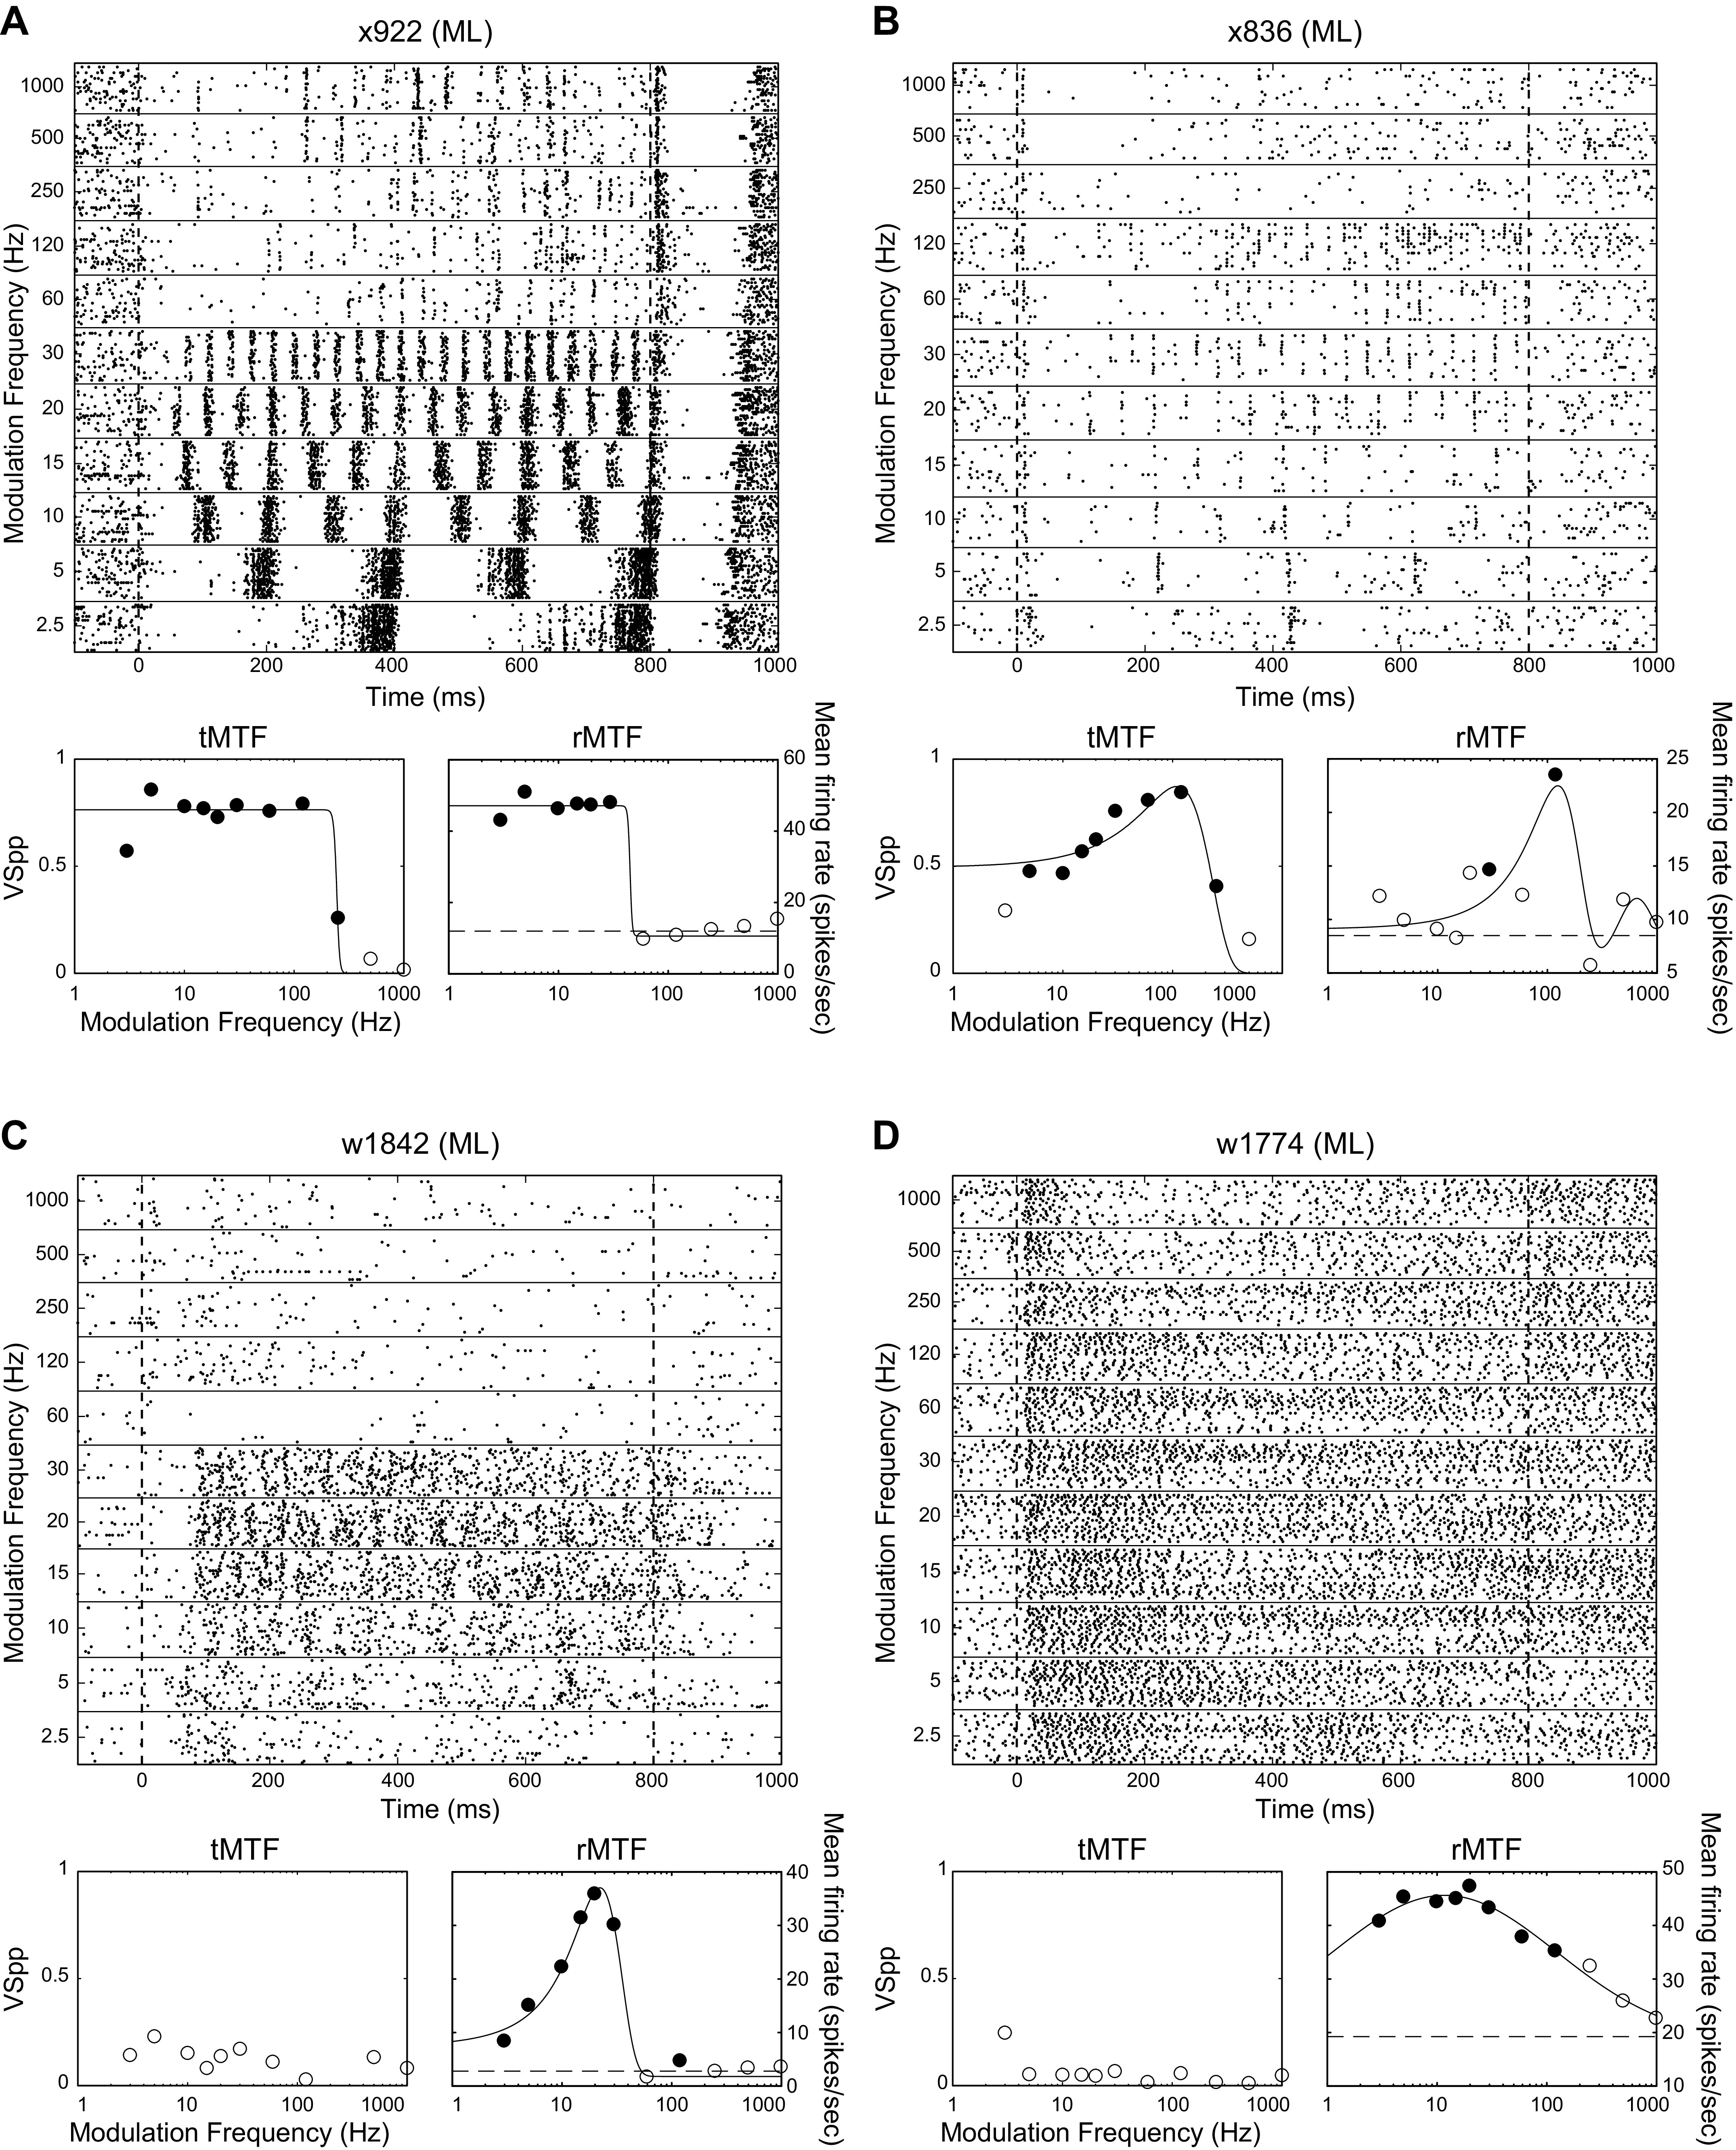
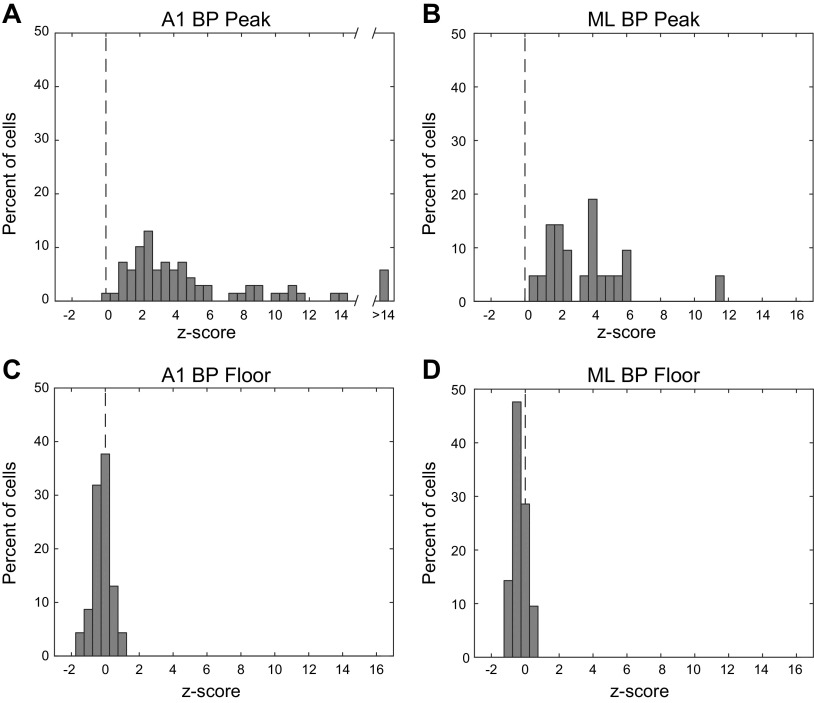
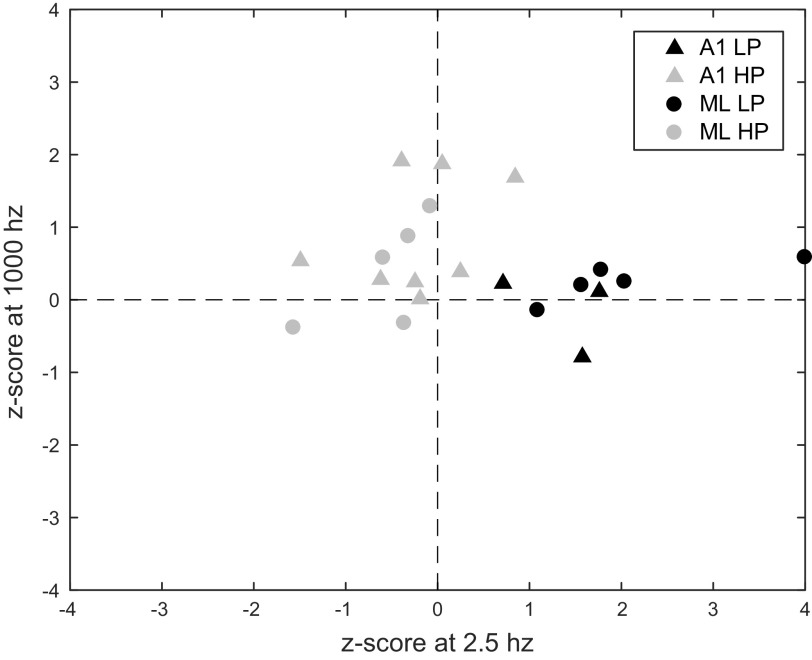
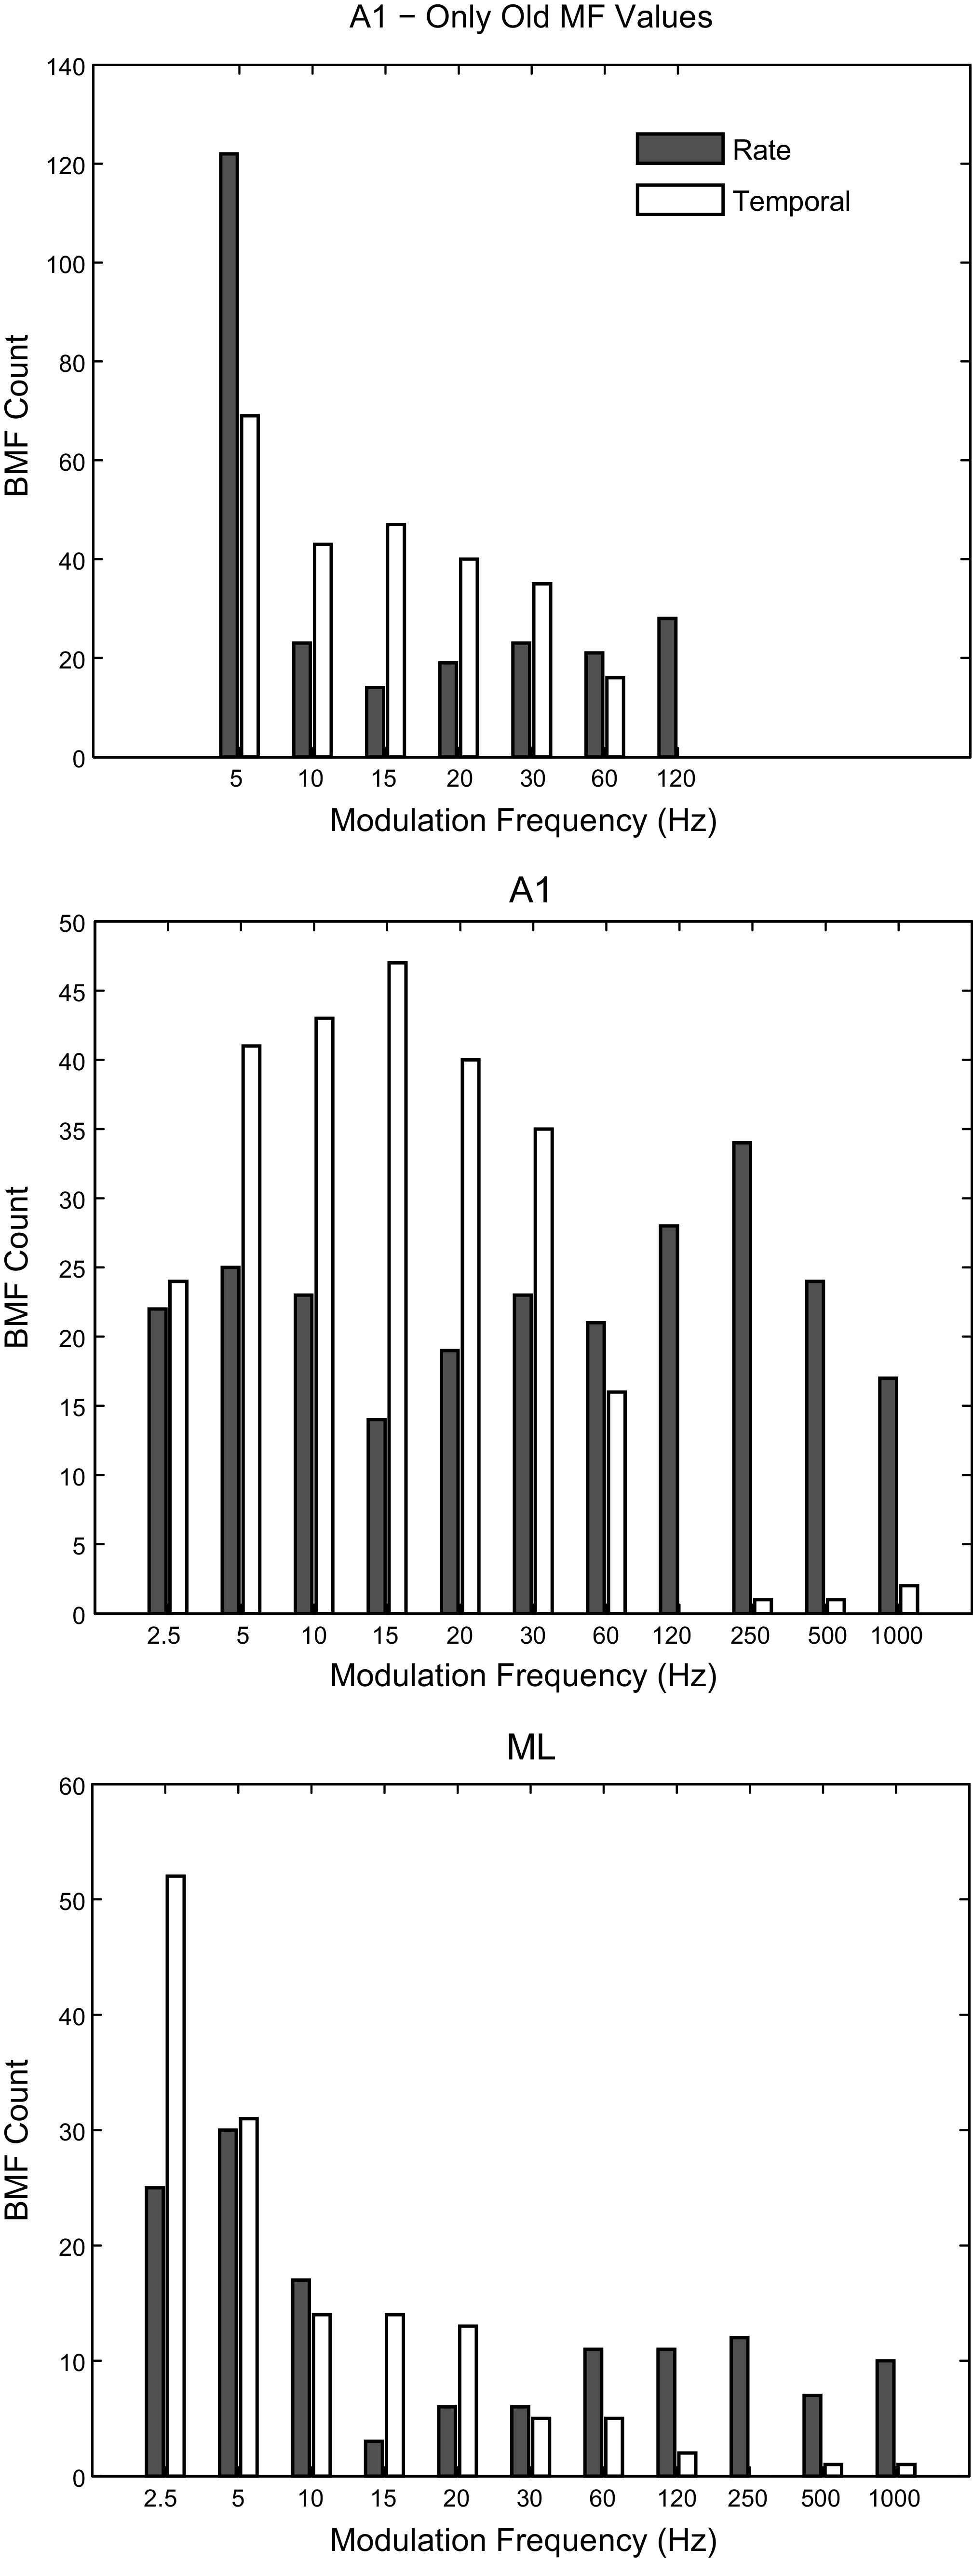
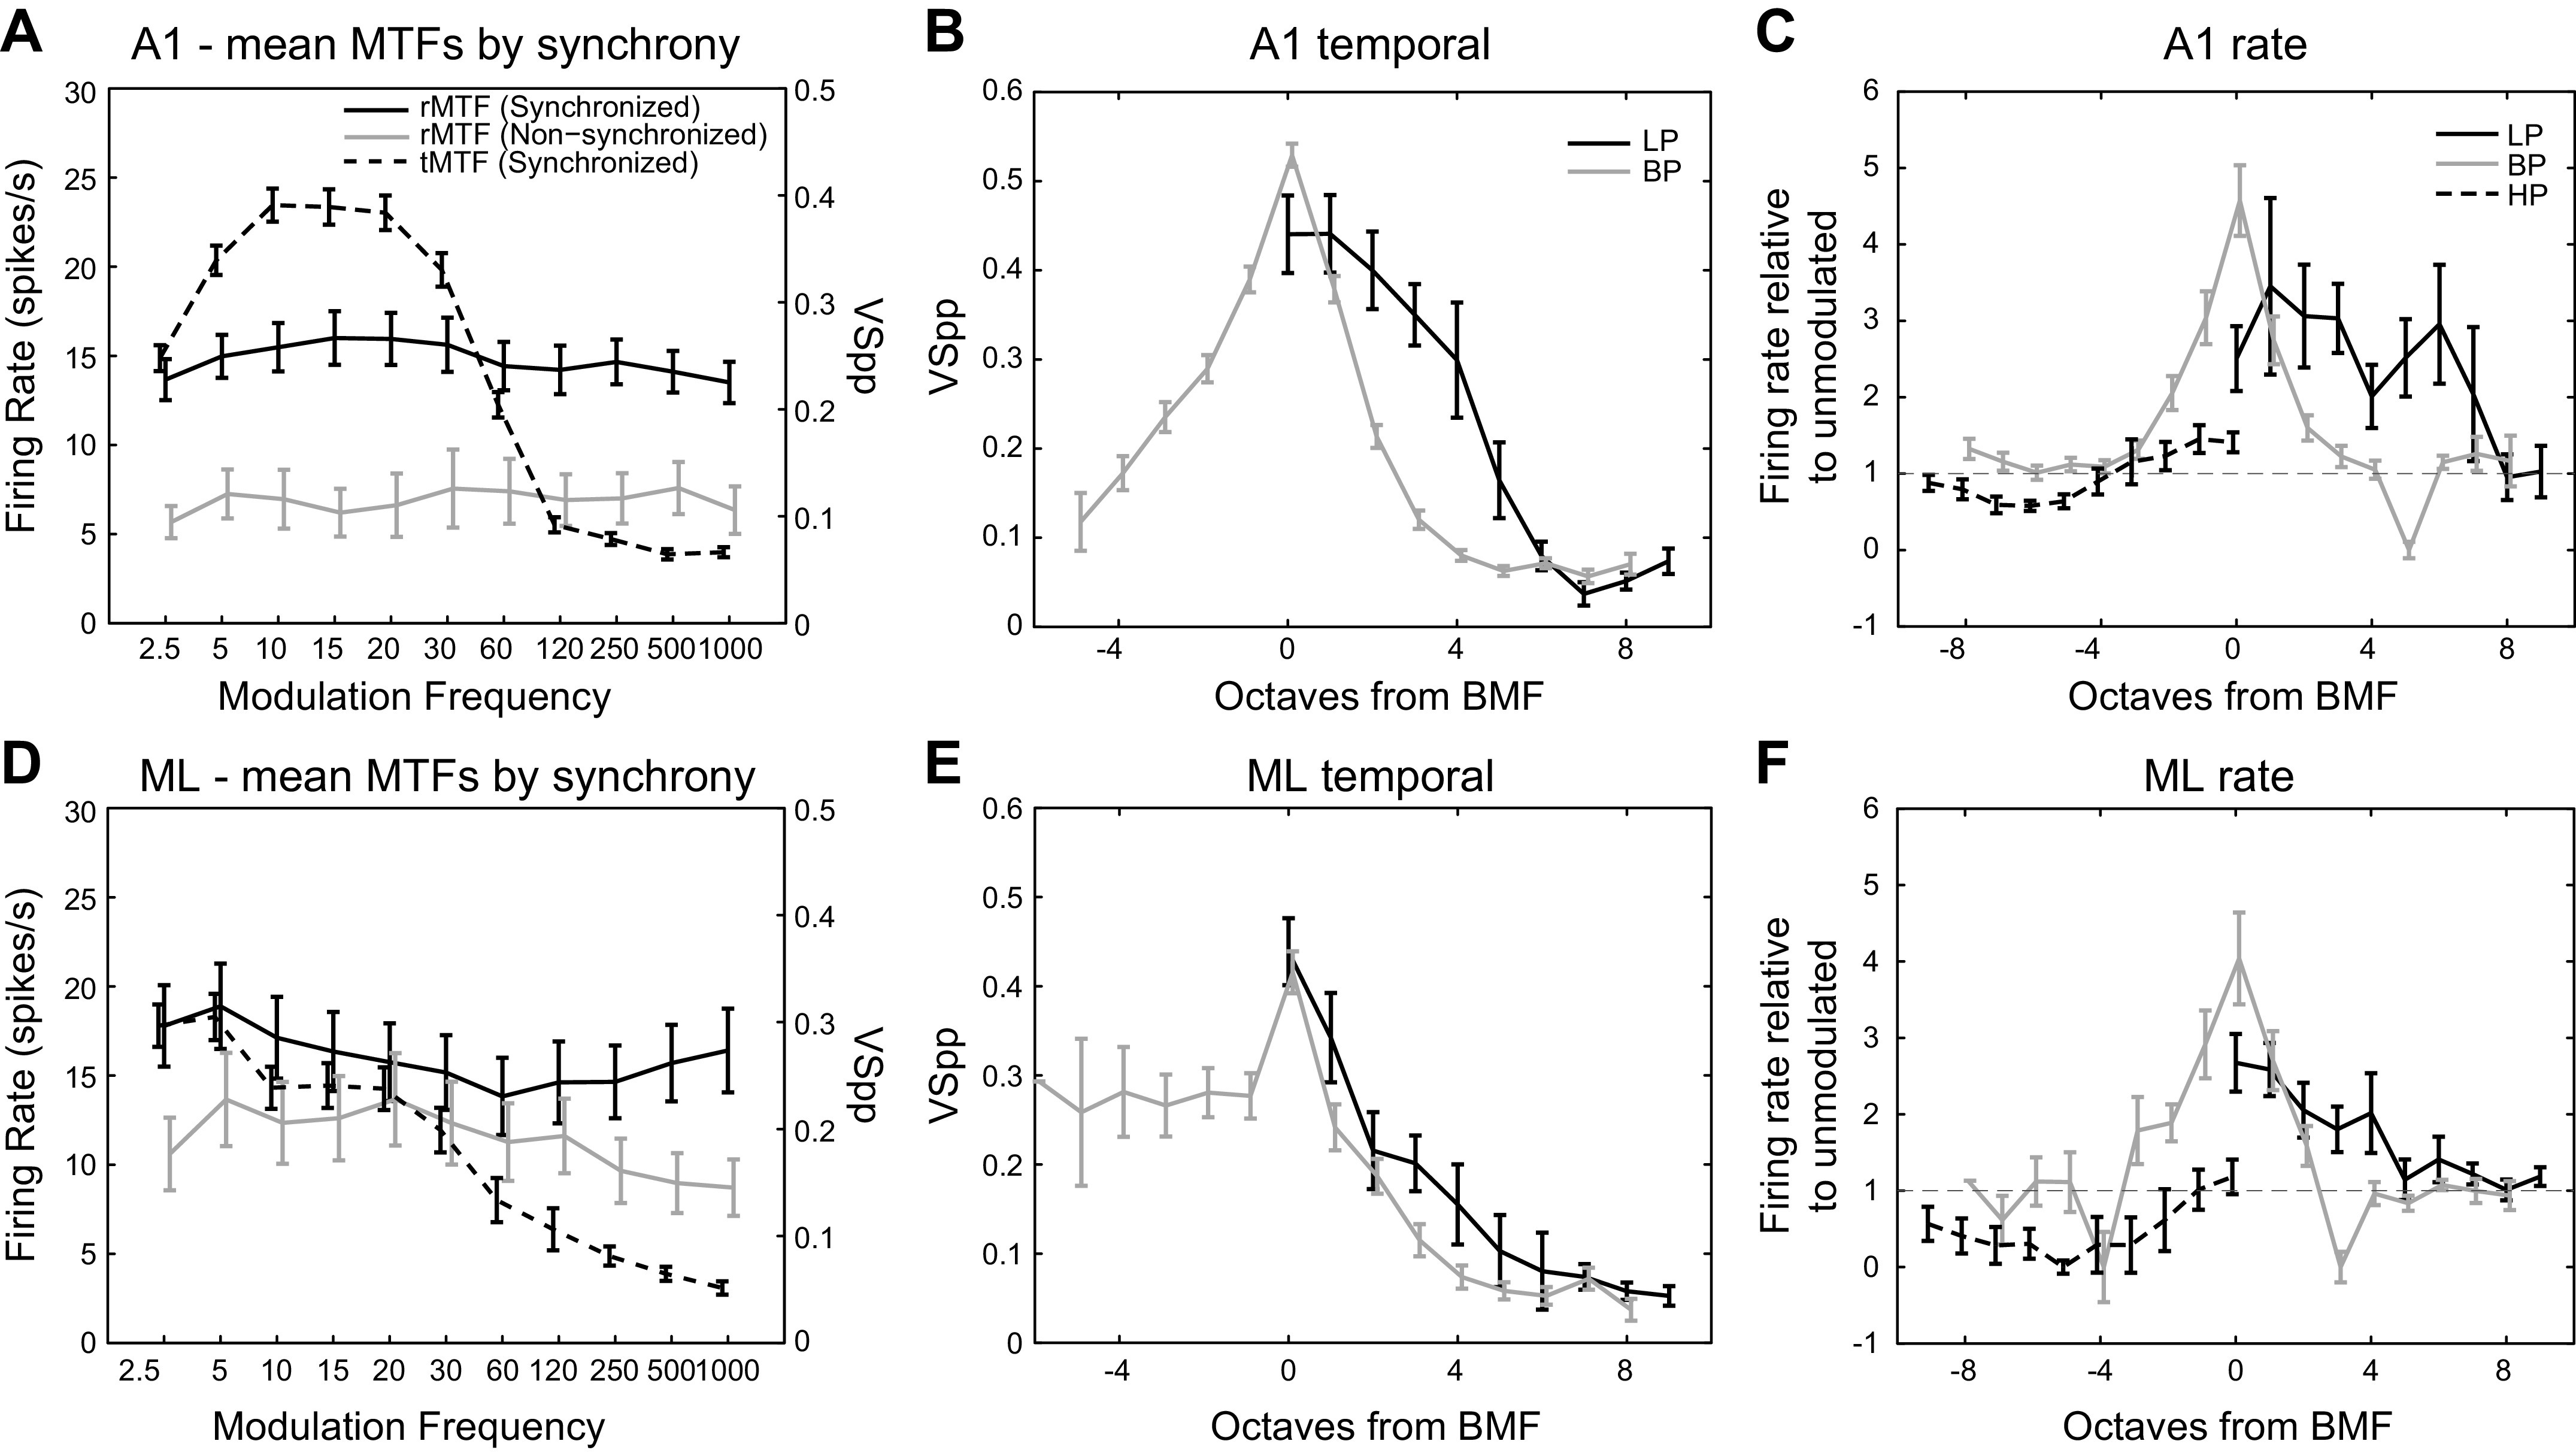
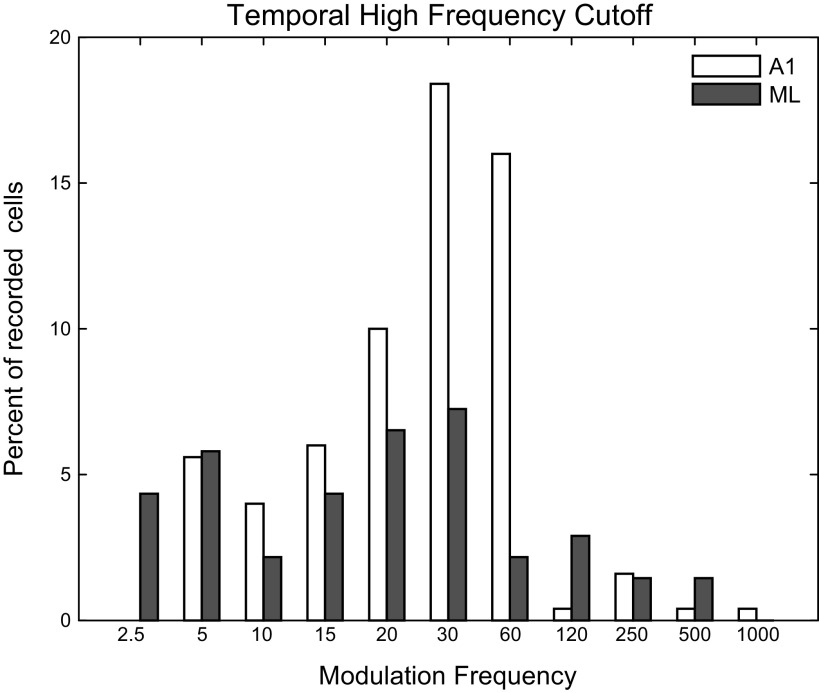
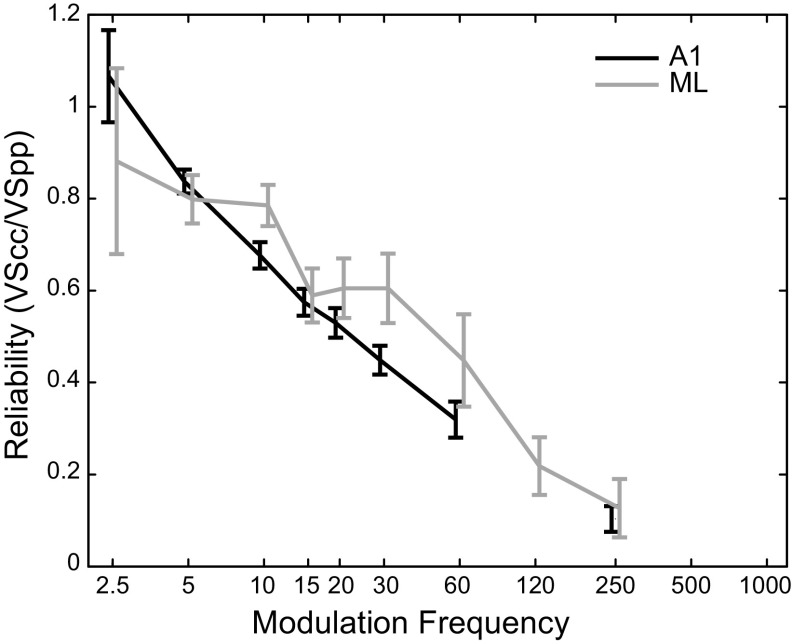
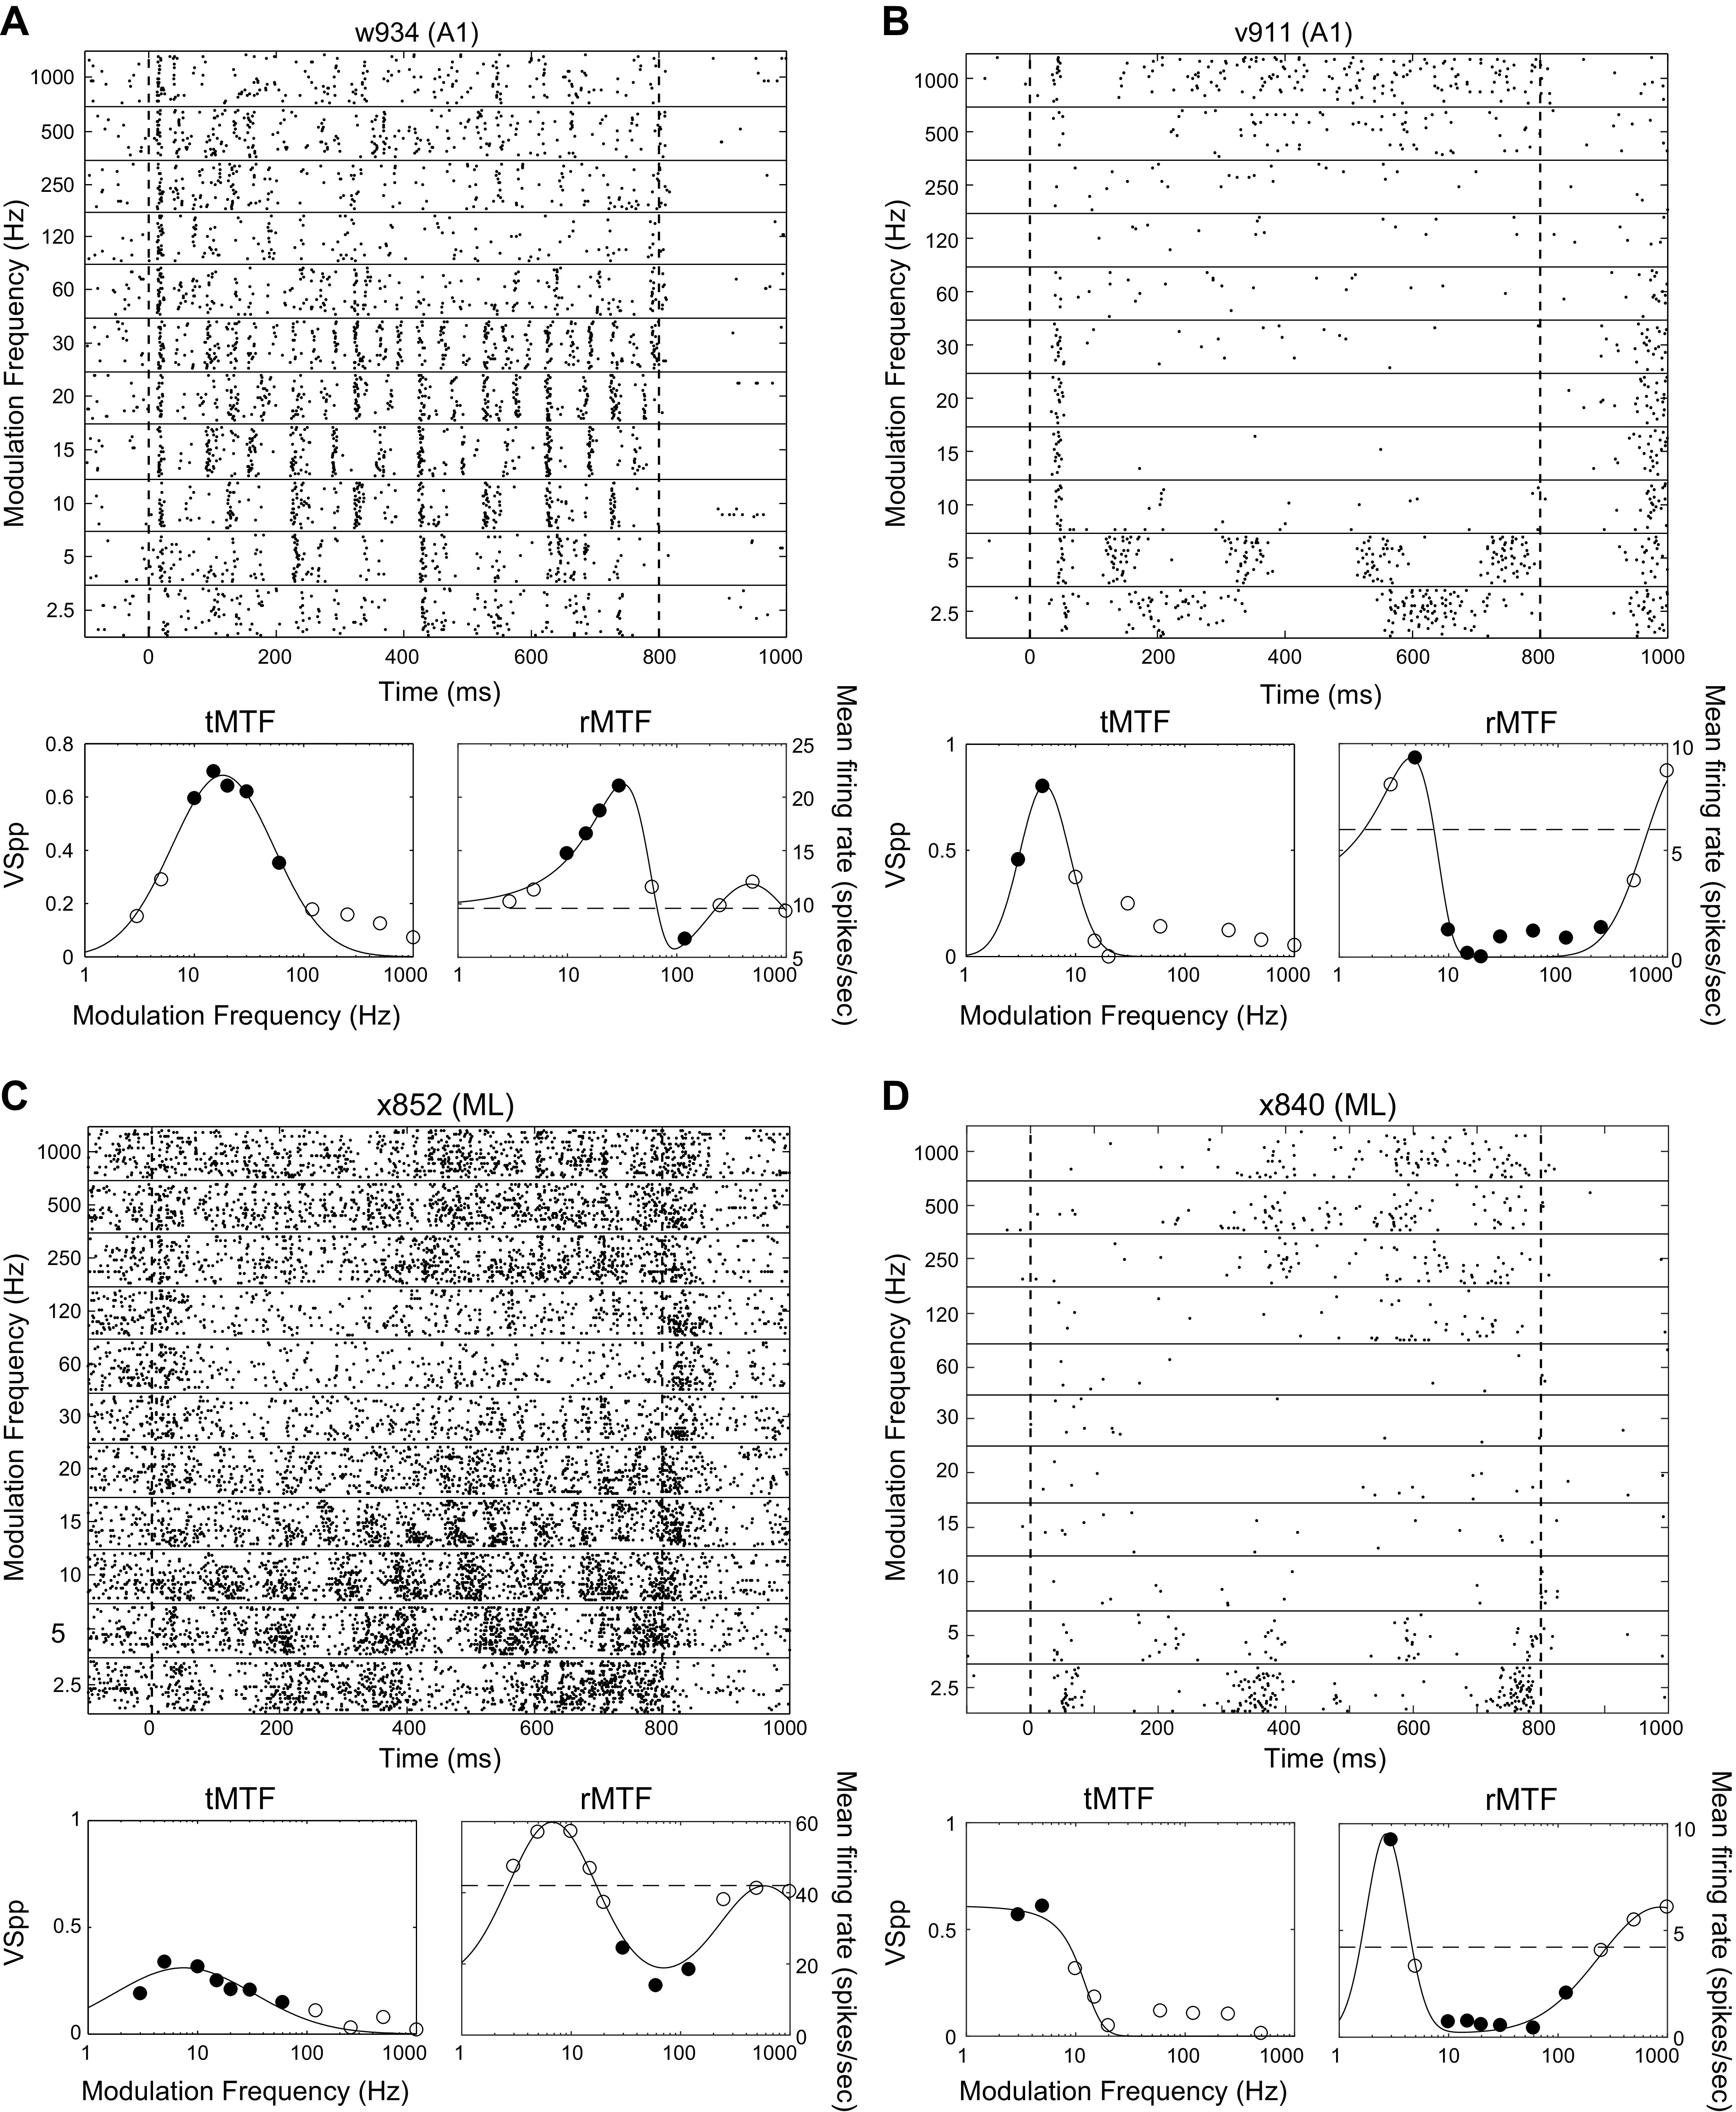
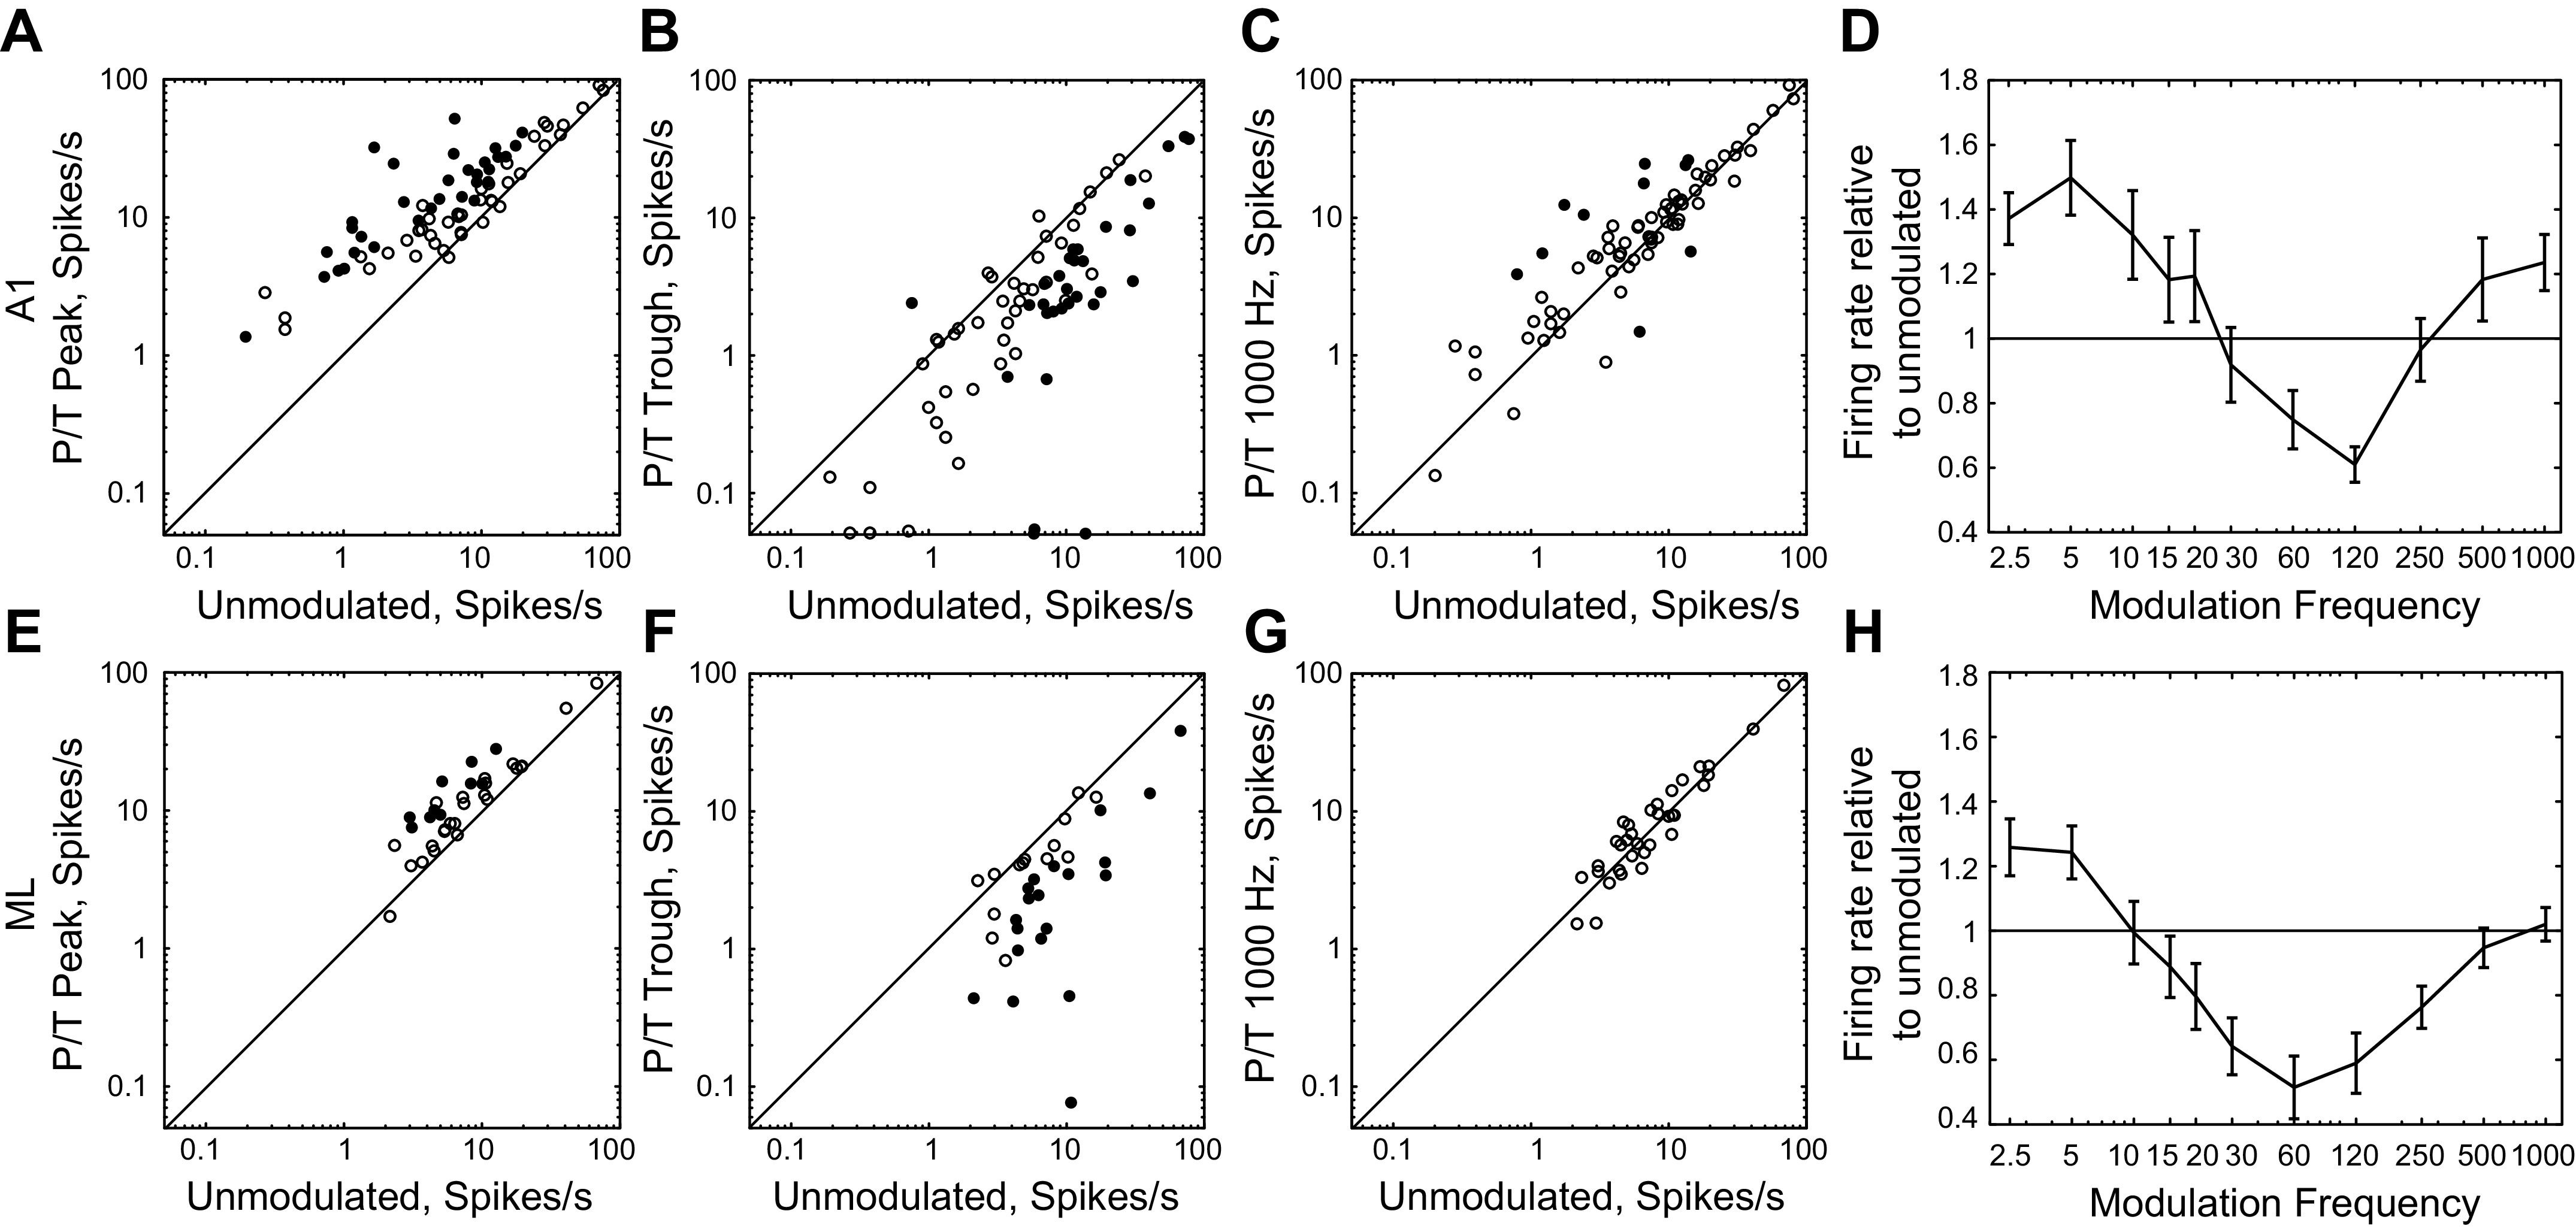
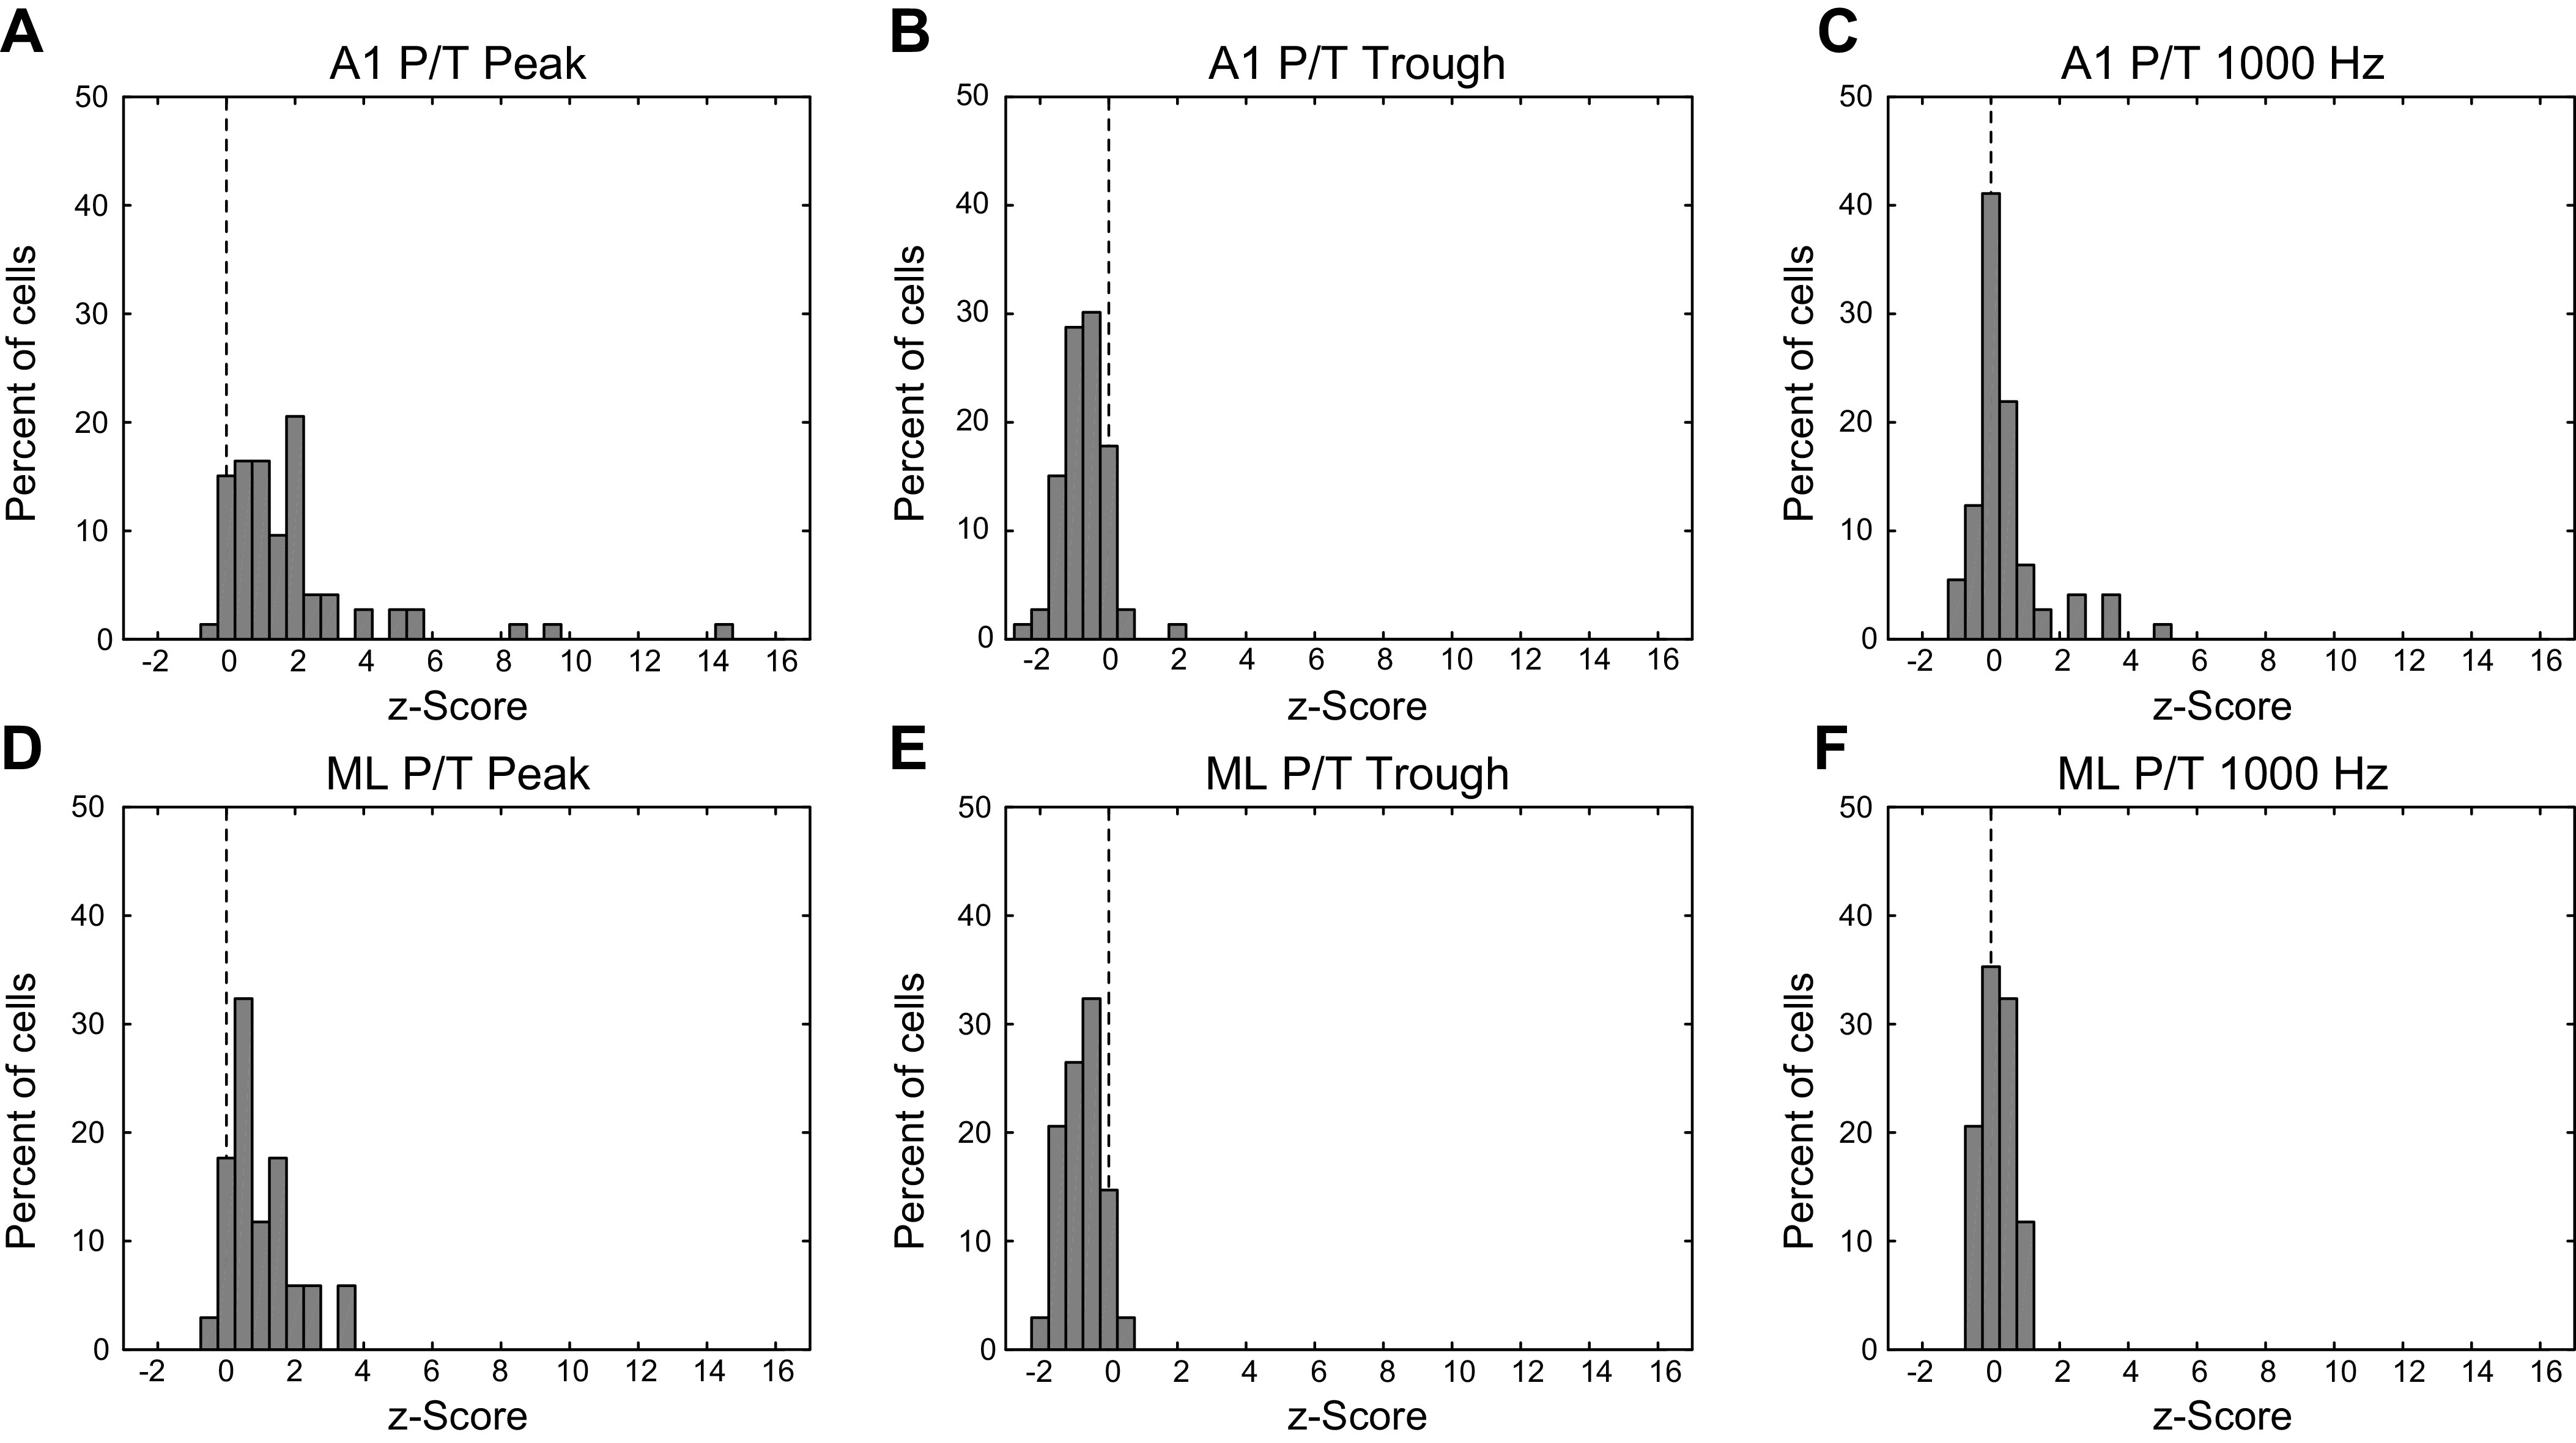
In macaques, the middle lateral auditory cortex (ML) is a belt region adjacent to the primary auditory cortex (A1) and believed to be at a hierarchically higher level. Although ML single-unit responses have been studied for several auditory stimuli, the ability of ML cells to encode amplitude modulation (AM)-an ability that has been widely studied in A1-has not yet been characterized. Here, we compared the responses of A1 and ML neurons to amplitude-modulated (AM) noise in awake macaques. Although several of the basic properties of A1 and ML responses to AM noise were similar, we found several key differences. ML neurons were less likely to phase lock, did not phase lock as strongly, and were more likely to respond in a nonsynchronized fashion than A1 cells, consistent with a temporal-to-rate transformation as information ascends the auditory hierarchy. ML neurons tended to have lower temporally (phase-locking) based best modulation frequencies than A1 neurons. Neurons that decreased their firing rate in response to AM noise relative to their firing rate in response to unmodulated noise became more common at the level of ML than they were in A1. In both A1 and ML, we found a prevalent class of neurons that usually have enhanced rate responses relative to responses to the unmodulated noise at lower modulation frequencies and suppressed rate responses relative to responses to the unmodulated noise at middle modulation frequencies.NEW & NOTEWORTHY ML neurons synchronized less than A1 neurons, consistent with a hierarchical temporal-to-rate transformation. Both A1 and ML had a class of modulation transfer functions previously unreported in the cortex with a low-modulation-frequency (MF) peak, a middle-MF trough, and responses similar to unmodulated noise responses at high MFs. The results support a hierarchical shift toward a two-pool opponent code, where subtraction of neural activity between two populations of oppositely tuned neurons encodes AM.

Keywords: amplitude modulation; lateral belt; primary auditory cortex; temporal coding.


Conflict of interest statement

No conflicts of interest, financial or otherwise, are declared by the authors.

Figures

Fig. 1.
Fig. 1.
Schematic of idealized peak/trough (P/T) cell. Dashed line indicates firing rate to an unmodulated stimulus. The idealized P/T cell has a low-MF peak with enhanced responses relative to the unmodulated response, a middle-MF trough with suppressed responses relative to the unmodulated response, and returns to roughly the level of the unmodulated response at high MFs. At modulation frequencies near the low-frequency peak, the neurons typically phase lock to the AM. AM, amplitude-modulated; MF, modulation frequency.
Fig. 2.
Fig. 2.
Example responses of ML neurons to AM noise. The responses to AM noise, and the modulation transfer functions are shown for four different example neurons (A–D). For each neuron, we show the responses to the 11 tested modulation frequencies with raster plots on the top. Below each raster plot are temporal (left, tMTF) and rate (right, rMTF) modulation transfer functions (MTFs) for the same neurons. Filled dots on the tMTFs indicate modulation frequencies at which there is significant phase locking (t test, P < 0.05 corrected for 11 comparisons), filled dots on the rMTFs indicate modulation frequencies at which the firing rate differed from the firing rate to the unmodulated stimulus (t test, P < 0.05 corrected for 11 comparisons). Dashed line on rMTFs indicates the firing rate to the unmodulated noise stimulus. For all four examples, the only points on the rMTF with significant response differences from the response to unmodulated noise (filled circles) were above the unmodulated noise response (dashed line), so they were all classified as increasing for Table 2. Best frequencies of cells depicted, by panel: A, 6 kHz; B, 11 kHz; C, 1.7 kHz; and D, 31 kHz.
Fig. 3.
Fig. 3.
Firing rate z-scored with respect to the response to unmodulated noise at peak and floor of bandpass cells. Top row, peak of rMTF (A and B). Bottom row, floor (minimum value) of rMTF (C and D). Left column, A1. Right column, ML. Dashed vertical line denotes a z-score of zero. Note that the x-axis in A is broken due to highest values. A1, primary auditory cortex; ML, middle lateral auditory cortex.
Fig. 4.
Fig. 4.
Firing rate of individual cells z-scored with respect to the response to unmodulated noise at 2.5 Hz and 1,000 Hz for LP and HP cells. Triangles indicate A1, circles indicate ML. Black symbols indicate LP cells, gray symbols indicate HP cells. One value for ML LP truncated at 4.0. A1, primary auditory cortex; HP, high-pass; LP, low-pass; ML, middle lateral auditory cortex.
Fig. 5.
Fig. 5.
Best modulation frequencies. Top: best modulation frequencies (BMFs) for rate (shaded) and temporal (open) measures in A1 calculated using only the modulation frequencies tested in a previous report (Yin et al. 2011). Middle: BMFs for A1 calculated using all frequencies tested in this study. Bottom: BMFs for ML calculated using all frequencies tested in this study. A1, primary auditory cortex; ML, middle lateral auditory cortex.
Fig. 6.
Fig. 6.
Distributions of bandwidths. Bandwidths are calculated as the octave width of the fitted curve at half height (see methods), constrained by upper and lower limits that are one octave outside of the range of tested modulation frequencies (MF). Top plots (A and B) are A1 and bottom plots (C and D) are ML. Left: bandwidths of bandpass cells for both rate and temporal measures. Right: rate bandwidths for the lower-MF peak (gray) and the higher-MF peak (hatched) for peak/trough cells. A1, primary auditory cortex; ML, middle lateral auditory cortex.
Fig. 7.
Fig. 7.
Mean modulation transfer functions (MTFs). Top row (A–C) is A1, bottom row (D–F) is ML. Mean MTFs are calculated by taking the mean response (firing rate or vector strength) or the geometric mean response (firing rate relative to unmodulated, right column) of all cells at each MF. Error bars indicate standard error of the mean (right column, standard error of the geometric mean). x-axis values are slightly offset to increase visibility of error bars. Only responsive cells are included. For left column, rate MTFs (rMTFs, solid lines) are referred to the left y-axis and broken down into synchronized and nonsynchronized cells. For left column, temporal MTFs (tMTFs, dotted lines) are referred to the right y-axis. Middle column, tMTFs for low-pass (LP) and bandpass (BP) classes; high-pass (HP) tMTFs were not observed in our data set. x-axis is in octaves from BMF (BP) or octaves from 2.5 Hz (LP). Right column, rMTFs for LP, BP, and HP classes. Firing rate relative to unmodulated is the firing rate to 100% AM divided by the firing rate to unmodulated noise. x-axis is in octaves from BMF (BP) or from 2.5 Hz (LP) or 1,000 Hz (HP). AM, amplitude-modulated.
Fig. 8.
Fig. 8.
Temporal high-frequency cutoffs. The temporal high-frequency cutoff is defined as the highest modulation frequency that results in a response with significantly greater phase locking relative to the response to an unmodulated stimulus. Percentages do not add up to 100 because some cells do not phase lock.
Fig. 9.
Fig. 9.
Reliability of synchronized firing. Mean reliability of synchronized firing in A1 (black) and ML (gray) is estimated by the ratio of VSCC to VSPP. Mean values are calculated only from modulation frequencies (MFs) that significantly phase lock; if fewer than four recorded cells significantly phase locked at a particular MF that point was omitted from the plot (120 Hz in A1). Values above 1.0 (e.g., A1 at the 2.5 Hz MF) are due to fact that cycles that include the 70 ms onset response window are excluded from the VSCC analysis but the corresponding times are not excluded from the VSPP analysis. Plots are offset slightly left and right to allow better visibility of overlapping error bars. Error bars show standard error of the mean. A1, primary auditory cortex; ML, middle lateral auditory cortex; VSCC, cycle-by-cycle vector strength; VSPP: phase-projected vector strength.
Fig. 10.
Fig. 10.
Example responses from peak/trough (P/T) cells. Plots as in Fig. 2. All examples are best fit by the P/T fit (see methods). Filled dots on the tMTFs indicate modulation frequencies at which there is significant phase locking (t test, P < 0.05 corrected for 11 comparisons). Filled dots on the rMTFs indicate modulation frequencies at which the firing rate differed from the firing rate to the unmodulated stimulus (t test, P < 0.05 corrected for 11 comparisons). Dashed line on rMTFs indicates the firing rate to the unmodulated stimulus. Neurons with significant firing rate differences both greater than the response to unmodulated noise at some MFs and less than the response to unmodulated noise at other MFs (A, B, and D) were classified as “mixed” in Table 2. The neuron in C only had significant firing rate differences that were less than the unmodulated noise response and was classified as “decreasing” in Table 2. BFs of cells depicted, by panel: A, 5.5 kHz; B, 11 kHz; C, 2.4 kHz; and D, 27 kHz. MF, modulation frequency; rMTF, rate-based modulation transfer function; tMTF, temporal-based modulation transfer function.
Fig. 11.
Fig. 11.
Firing rate relative to the response to unmodulated noise at low-frequency peak, middle-frequency trough, and high MF region. A–C, E–G: cell-by-cell scatter of firing rate to unmodulated noise (x-axis) against firing rate to AM for various conditions. Top row, A1. Bottom row, ML. A and E: firing rate of peak/trough (P/T) cells at the first P/T peak. B and F: firing rate of P/T cells at the P/T trough. C and G: firing rate of P/T cells at the 1,000 Hz modulation frequency (MF). Closed symbols represent cells for which the two firing rates significantly differ (t test, P < 0.05 after correction for multiple comparisons). Open symbols represent cells for which firing rates do not significantly differ. Diagonal line is a unity line. D and H: mean normalized rMTF of P/T cells (calculated as the geometric mean of P/T rMTFs normalized by their respective firing rate to unmodulated stimuli; error bars are standard error of the geometric mean). A1, primary auditory cortex; AM, amplitude-modulated; ML, middle lateral auditory cortex; rMTF, rate-based modulation transfer function.
Fig. 12.
Fig. 12.
Firing rate z-scored with respect to the response to unmodulated noise at low-frequency peak, mid-frequency trough, and high MF. Top row (A–C) is A1, bottom row (D–F) is ML. Left column, firing rate for peak/trough (P/T) cells at low-MF peak, z-scored with respect to the response to unmodulated noise. Middle column, same as left column, for P/T cell firing rate at middle-MF trough. Right column, same as left column, for P/T cell firing rate at 1,000 Hz. A1, primary auditory cortex; MF, modulation frequency; ML, middle lateral auditory cortex.
Fig. 13.
Fig. 13.
Detection of a stimulus and detection of modulation. Left, percent of cells in A1 (open) and ML (shaded) that detect the stimulus (compared against spontaneous firing). Cells that failed to detect the presence of a stimulus with both spike count and vector strength are labeled as Not Sensitive. Cells that could detect the presence of a stimulus (relative to spontaneous) with spike counts, but not with vector strength are labeled SC Only. Cells that could detect the presence of a stimulus (relative to spontaneous activity) with vector strength, but not with spike counts are labeled VSPP Only. Cells that had responses that significantly differed from the spontaneous firing rate for both spike counts and vector strength are labeled as VSPP + SC. For each category, an A1/ML comparison was made using a z test for the difference of independent proportions (P value noted above bars). Right, same as left, except the comparison was made against the response to the unmodulated stimulus and represents detection of amplitude modulation at 100% depth. A1, primary auditory cortex; ML, middle lateral auditory cortex; SC, spike count; VSPP: phase-projected vector strength.

References

    1. Averbeck BB, Latham PE, Pouget A. Neural correlations, population coding and computation. Nat Rev Neurosci 7: 358–366, 2006. doi:10.1038/nrn1888. - DOI - PubMed
    1. Barbour DL, Wang X. Temporal coherence sensitivity in auditory cortex. J Neurophysiol 88: 2684–2699, 2002. doi:10.1152/jn.00253.2002. - DOI - PubMed
    1. Bendor D, Wang X. Differential neural coding of acoustic flutter within primate auditory cortex. Nat Neurosci 10: 763–771, 2007. doi:10.1038/nn1888. - DOI - PubMed
    1. Bendor D, Wang X. Neural response properties of primary, rostral, and rostrotemporal core fields in the auditory cortex of marmoset monkeys. J Neurophysiol 100: 888–906, 2008. doi:10.1152/jn.00884.2007. - DOI - PMC - PubMed
    1. Bieser A, Müller-Preuss P. Auditory responsive cortex in the squirrel monkey: neural responses to amplitude-modulated sounds. Exp Brain Res 108: 273–284, 1996. doi:10.1007/BF00228100. - DOI - PubMed

Publication types