. 2020 Oct 7:9:e59442.
doi: 10.7554/eLife.59442.

Collagen-rich omentum is a premetastatic niche for integrin α2-mediated peritoneal metastasis

Affiliations

Collagen-rich omentum is a premetastatic niche for integrin α2-mediated peritoneal metastasis

Yen-Lin Huang et al. Elife. .

Abstract

The extracellular matrix (ECM) plays critical roles in tumor progression and metastasis. However, the contribution of ECM proteins to early metastatic onset in the peritoneal cavity remains unexplored. Here, we suggest a new route of metastasis through the interaction of integrin alpha 2 (ITGA2) with collagens enriched in the tumor coinciding with poor outcome in patients with ovarian cancer. Using multiple gene-edited cell lines and patient-derived samples, we demonstrate that ITGA2 triggers cancer cell adhesion to collagen, promotes cell migration, anoikis resistance, mesothelial clearance, and peritoneal metastasis in vitro and in vivo. Mechanistically, phosphoproteomics identify an ITGA2-dependent phosphorylation of focal adhesion kinase and mitogen-activated protein kinase pathway leading to enhanced oncogenic properties. Consequently, specific inhibition of ITGA2-mediated cancer cell-collagen interaction or targeting focal adhesion signaling may present an opportunity for therapeutic intervention of metastatic spread in ovarian cancer.

Keywords: Cell adhesion; Collagen; Peritoneal metastasis; cancer biology; cell biology; focal adhesion kinase; human; integrin alpah 2; mouse; omentum; zebrafish.


Conflict of interest statement

YH, CL, DR, RC, DS, ME, CC, NR, AS, MN, AF, MK, TV, DC, CL, LD, BR, FJ, VH No competing interests declared

Figures
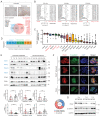
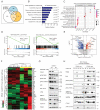
Figure 1.
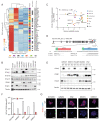
Figure 1.. Altered collagen expression predicts poor outcome in EOC patients coinciding with ITGA2 expression.
(A) Proteomic analysis identifies up- and downregulated ECM-associated proteins in omental metastasis versus normal omentum tissue (n = 8). Representative immunohistochemical staining of normal and metastatic omentum for COL1A1. Scale bar 50 μm. (B) Forest plots of the expression of collagens (COL1A1, COL3A1, and COL5A1) as univariate predictors of overall survival, using the curatedOvarianData (n = 2970) applicable expression and survival information. Hazard ratio (HR) significantly larger than one indicates positive correlation to poor outcome in EOC patients. (C) Box-whisker plots of top 25 collagens gene set variation analysis (GSVA) in 20 non-diseased tissues from GTEx RNA-seq dataset. (D) A schematic figure of integrin receptors and their corresponding ECM ligands. (E) Representative western blot shows the expression of collagen-binding integrins α1, α2, α10, α11, as well as integrin α5 and β1 in omental metastasis and normal omentum. Bar charts with relative integrin expression as mean ± SD (**p<0.05, ***p<0.001; n = 13–19). (F) Representative immunofluorescence images with membranous E-cadherin (green) and ITGA2 (red) staining in ATCs. Pie chart summarizes percentage of ITGA2+ tumor spheroids from EOC patients (n = 15). Scale bar 50 μm. (G) Western blot analysis of ITGA2 and E-cadherin expression in matched EOC patient samples, ascites (AS), primary (OV) and omental metastasis (OM).
Figure 1—figure supplement 1.
Figure 1—figure supplement 1.. Collagens and ECM-associated gene expression correlates with poor survival in patients with ovarian cancer.
(A) Box-whisker plots shows gene expression of 43 collagens (log(TPM)) in normal ovary and omentum tissue from GTEx database. COL1A1, COL1A2, and COL3A1 are the highest expressed collagen genes in ovary and omentum (red) (B) Representative immunohistochemistry staining of COL1A1 in normal omentum and omental metastasis. (C) Correlation matrix of selected fibroblast activated markers and collagen in TCGA dataset. Numbers indicate Pearson correlation coefficients. Positive correlations are displayed in blue and negative correlations in red color. Color intensity and the size of the circle are proportional to the correlation coefficients. Correlations with p-value < 0.01 are considered significant. (D) Forest plots summarize the mRNA expression of indicated gene as a univariate predictor of overall survival in the curatedOvarianData (n = 2970). FAP, fibroblast activated protein. VCAN, versican. ACTA2, smooth muscle actin.
Figure 1—figure supplement 2.
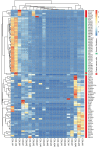
Figure 1—figure supplement 2.. Hierarchical cluster analysis of collagen-expression genes in EOC and fibroblast cell lines.
Unsupervised hierarchical cluster analysis and heat map visualization for expression of collagen-encoding genes among EOC cell lines (n = 47) and human fibroblast derived from various tissue origins (n = 37) using the CCLE dataset.
Figure 1—figure supplement 3.
Figure 1—figure supplement 3.. ITGA2 expression correlates with collagen expression in TCGA and GTEx dataset.
(A) Unsupervised hierarchical cluster analysis and heat map visualization of genes encoding collagen-binding integrins (α1, α2, α10, and α11) from gynecologic tissues data obtaining from GTEx database. (B) ITGA2 expression (log(TPM)) in 22 non-diseased tissues from (GTEx dataset). (C) Spearman’s correlation matrix of ITGA2 and selected collagens in the TCGA-ovarian cancer RNA-seq dataset. The top of the diagonal represents pairwise Spearman’s correlation coefficients and significance level (*p<0.05, **p<0.01, ***p<0.001). On the bottom of the diagonal: bivariate scatter plots with a fitted line are displayed. (D) Correlation between a set of top 25 expressed collagen genes (GSVA) and ITGA2 in TCGA and in (E) GTEx RNA-seq dataset.
Figure 2.
Figure 2.. Distribution of collagen-binding integrin expression and generation of ΔITGA2 in EOC cell lines using CRISPR-Cas9.
(A) Hierarchical cluster analysis and heat map visualization of known collagen-binding integrin-encoding genes among EOC cell lines using the Cancer Cell Line Encyclopedia (CCLE). The original histological subtypes and TP53 genomic mutation status were annotated as previously described (Domcke et al., 2013). (B) Representative western blot showing expression of collagen-binding integrins among eleven EOC cell lines. (C) ITGA2 expression (Spearman correlation R = −0.0012, p=0.99) is independent of histological subtypes and previously described serous suitability scores (Domcke et al., 2013). Representative EOC cell lines used in this study are annotated. (D) CRISPR-Cas9 mediated deletion of ITGA2 targeting exon 29–30, resulting in a 743 and 747 bp genomic deletion. (E) Immunoblot confirms loss of ITGA2 expression in five of ΔITGA2 (KO) cell lines while the binding partner ITGB1 was not altered. (F) Bar chart showed the median fluorescence intensity of ITGA2 expression in WT and ΔITGA2 cells by flow cytometry. (G) Representative fluorescence images with membranous ITGA2 expression in WT and ΔITGA2 cancer spheroids collected from ultra-low attachment plate. Scale bar 100 μm.
Figure 2—figure supplement 1.
Figure 2—figure supplement 1.. Heterogeneous ITGA2 expression in matched primary and metastatic tumor independent of tumor origin and histotypes.
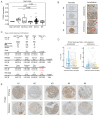
(A) ITGA2 expression among ovarian cancer histotypes from GSE51088 RNA-seq dataset (n = 172). (B) Representative IHC images show the intensity and localization of ITGA2 expression. Green and red arrows point out the positive cytoplasmic and membranous staining, respectively. (C) Summary of the product expression of ITGA2 in the tissue microarray according to grade, histotype, organ, and FIGO stage. (D) Weighted average scores of ITGA2 expression in matched primary and metastatic tissue samples (n = 40). (E) Representative images of IHC staining for ITGA2 protein in five matched primary and metastatic tumors of patients with epithelial ovarian cancer . Scale bar 0.2 mm.
Figure 2—figure supplement 2.
Figure 2—figure supplement 2.. Heterogeneous ITGA2 expression is independent of tumor histotypes and TP53 status in ovarian cancer.
(A) ITGA2 expression among ovarian cancer histotypes from GSE9891 (n = 285), GSE73614 (n = 107) and GSE2109 (n = 204) RNA-seq dataset. (B) ITGA2 expression of CCLE ovarian cancer cell lines is independent of TP53 mutational status (p=0.64). (C) Ranked ITGA2 expression (RPKM) and TP53 mutational status in 42 ovarian cancer cell lines.
Figure 3.
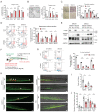
Figure 3.. ITGA2 promotes EOC cell migration, anoikis resistance, and extravasation in vitro and in vivo.
(A) Cell proliferation index of WT and ΔITGA2 cells in collagen-coated plate. (B) Anchorage-dependent colony formation assay for WT and ΔITGA2 cells on collagen-coated plate after 7 days incubation. Bar chart represents the mean ± SD of total colony counts. (C) Chemotaxis cell migration assay and quantification of cell migration (24 hr). Scale bar 200 μm. (D) Cell detachment-induced apoptosis (anoikis) assay. WT and ΔITGA2 cells stained with Annexin V-FITC and DAPI after 3–5 days of cultivation in ultra-low attachment plate to identify apoptotic dead cells (FITC+/DAPI+). Mean ± SD (*p<0.05) from two independent experiments. (E) Western blot shows increased cleaved PARP in the KO compared to WT cells under non-adherent spheroid condition. (F) Scheme of tumor cells transplant model in Tg(kdrl:eGFP) zebrafish. CM-Dil labeled cancer cells were transplanted into zebrafish at two dpf (days post fertilization). (G) At five dpf, fish were enzymatically dissociated to single cells and analyzed in vivo survival of cancer cells by flow cytometry. Representative counter plot shows the percentage of CM-Dil+ cancer cells. Bar chart summarizes data from n = 5 fish per group. (H) Representative confocal images of transplanted fish (n = 5 per group) showing the tumor cluster formation in proximity of the circulatory loop (white arrow) at five dpf. Scale bar 100 μm. (I) Numbers of cluster formation and (J) single cells in tail vein were counted and represented as mean ± SD (unpaired Student’s t-test, *p<0.05).
Figure 3—figure supplement 1.
Figure 3—figure supplement 1.. The dependence of ECM in cell proliferation and colony formation assay.
(A) Cell proliferation index of WT and ΔITGA2 cells in fibronectin-coated and (B) uncoated tissue culture plate. Nunc-Maxisorp 96-well plates were used to coat for 2 μg of fibronectin before seeding cells for proliferation assay. (C) Anchorage-dependent colony formation for WT and ΔITGA2 cells after 7 days in uncoated tissue culture plate. Bar chart represents the mean ± SD of total colony counts. Representative images show colony formation in standard tissue culture plate.
Figure 4.
Figure 4.. ITGA2 promotes cancer cell adhesion to collagen.
(A) Static cancer cell-ECM adhesion assay. Representative images showing OVCAR3 WT and ΔITGA2 cell adhesion to different ECM proteins, including collagen type I, III, IV, laminin, and fibronectin. (B) Bar charts with mean ± SD of the percentage of cell adhesion efficiency of OVCAR3, SKOV3, and IGORV1 cells from three independent experiments. (unpaired Student’s t-test, ***p<0.001) (C) Representative images and bar charts showing the cell adhesion to collagen I in four ITGA2-overexpressed EOC cell lines (unpaired Student’s t-test, ***p<0.001). Scale bar 200 μm. (D) Single cell adhesion on bioprinted collagen was monitored by time-lapse microscopy. Data represent the surface area ratio as mean ± SD (n > 300 single cells were analyzed per group). (E) Representative scanning electron microscope (SEM) images showing the SKOV3 WT and ΔITGA2 cellular adherence on bioprinted collagen at 1, 6, and 24 hr. White arrow indicates the polarized filopodia structure. Scale bar 10 μm. (F) Velocity and displacement of single cells on collagen-coated slides were measured (n > 300 per group from three independent experiments. Unpaired Student’s t-test, *p<0.05, ***p<0.001).
Figure 4—figure supplement 1.
Figure 4—figure supplement 1.. Characterization of constitutive ITGA2 expression in selected ovarian cancer cell lines.
(A) The levels of ITGA2 and ITGB1 expression in WT versus ITGA2-overexpression (OE) in SKOV3ip, BG1, OVCAR4, and A2780 cell lines were determined by flow cytometry and (B) Western blot. (C) Cell-ECM adhesion assay of WT and ITGA2 overexpressed (OE) ovarian cancer cells. Bar chart summarizes percentage of cell to ECM adhesion efficiency from three independent experiments (***p<0.001, unpaired Student’s t-test). (D) Colony formation assay for WT and OE cells for 7 days. Bar chart represents the mean ± SD of total colony counts. (E) Anchorage-independent soft agar assay for WT and OE cells for 10 days in culture. Bar chart shows the quantification of total spheroid numbers (*p<0.05, unpaired Student’s t-test). Scale bar 200 μm. (F) Anchorage-independent growth for IGROV1 WT and ΔITGA2 cells for 10 days in culture. Bar chart shows quantification of total spheroid numbers and diameter in μm (***p<0.001, unpaired Student’s t-test). Scale bar 100 μm.
Figure 5.
Figure 5.. ITGA2 inhibitor selectively blocks ATCs and cancer cell adhesion to collagen.
(A) Flow cytometry analysis of ITGA2 and ITGA5 expression from patient-derived ATCs. (B) Pearson’s correlation of ITGA2 or ITGA5 expression and cell-to-collagen/fibronectin adhesion efficiency (n = 10). (C) ATC adhesion to collagen and fibronectin was performed after 20 mins pretreatment of 1 μM TC-I-15 or DMSO as control. Representative images show that TC-I-15 inhibits primary ATCs adhesion to collagen I but not fibronectin. (D) Box-whisker plots show the percentage of ATCs adhesion efficiency to collagen and fibronectin, respectively. (unpaired Student’s t-test, ***p<0.001). (E) Percentage of IGROV1 cell-ECM adhesion with (+) or without (-) 20 mins pretreatment of TC-I-15. (F) Anchorage-independent cell growth in the presence or absence of TC-I-15 inhibitor for 10 days (TC-I-15 containing medium was refreshed every 2 days). Bar chart shows the mean ± SD of spheroid diameters and spheroid number counts (***p<0.001) in IGROV1 WT and ΔITGA2 cells. Scale bar 100 μm.
Figure 5—figure supplement 1.
Figure 5—figure supplement 1.. ITGA2 expression does not correlate with the expression of ITGA5.
Spearman’s correlation coefficient in scatter plot showing ITGA2 and ITGA5 (RPKM) expression in (A) all cancer cell lines (EOC cell lines highlighted red) and (B) EOC cell lines in CCLE dataset (C) Hierarchical cluster analysis and heat map visualization of selected integrins ITGA2, ITGB1, and ITGA5 among EOC cell lines using the CCLE dataset.
Figure 5—figure supplement 2.
Figure 5—figure supplement 2.. Establishment and characterization of ITGA5 knockout ovarian cancer cell lines.
(A) Immunoblot confirmed loss of ITGA5 expression in IGROV1 and SKOV3 ΔITGA5 (KO) cell lines. (B) Representative flow cytometry analysis of ΔITGA5 cells stained with primary anti-human ITGA5 antibody and goat anti-mouse-FITC secondary antibody. (C) Cell-ECM adhesion assay of WT, ΔITGA2, and ΔITGA5 cancer cells. Bar chart summarizes percentage of cell-ECM adhesion efficiency from two independent experiments (***p<0.001, unpaired Student’s t-test).
Figure 6.
Figure 6.. ITGA2 promotes mesothelial clearance and metastasis to the omentum in vivo.
(A) Cancer cell-mesothelial adhesion assay was performed by seeding equal numbers of fluorophore-labeled WT and ΔITGA2 single cancer cells on a confluent monolayer of MeT-5A cells. Bar chart shows the adhesion ratio of WT vs ΔITGA2 to MeT-5A cells at different time points. (B) Stable RFP-expressing cancer cell spheroids were seeded on top of a GFP-expressing MeT-5A mesothelial monolayer pre-coated with different ECM substrates. Mesothelial clearance activity was measured over time by time-lapse microscopy. Clearance ratio >1 suggests active enhanced clearance activity. Scale bar 200 μm. Line chart summarizes mesothelial clearance activity on different ECM substrates over time. (C) Representative images of mesothelial clearance assay of SKOV3 WT and ΔITGA2 cancer cell line at time point 0 and 20 hr. Scale bar 200 μm. (D) Bar chart shows mesothelial clearance ratio for WT versus ΔITGA2 (n = 5) and (E) WT versus ITGA2-overexpressed (OE) (n = 4) EOC cell lines with mean ± SD (unpaired Student’s t-test, ***p<0.001), each dot represents single spheroid clearance activity. (F) Dot plot shows the total number of tumor implants per animal after 8 weeks intraperitoneal injection of 4 × 10⁶ SKOV3 WT and ΔITGA2 cells in NIH(S)II: nu/nu mice. (G) Representative H and E staining of the xenografts and metastases. Black arrows indicate the tumor metastases. Scale bar 200 μm. (H) Bar chart summarized the number of tumor foci in different organs. Mean ± SD (One-way Anova, *p<0.05). (I) Representative immunofluorescence staining of ITGA2 expression in the omental tumor xenograft.
Figure 7.
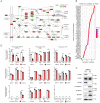
Figure 7.. Identification of ITGA2-dependent activation of FAK and MAPK signaling axis using phosphoproteomics.
(A) Venn-diagram highlights the number of significantly downregulated phosphoproteins shared among three ΔITGA2 ovarian cancer cell lines. (B) Top seven gene ontology (GO) biological process terms with highest statistical significance. The horizontal axis displays the number of genes in the intersection group of three ΔITGA2 ovarian cancer cell lines. (C) GSEA analysis identified up- or downregulated pathways in ΔITGA2 cells. The Cluster Profiler dot plot visualization shows enriched terms as dots. The highest ranking of the significantly enriched pathway is displayed. (D) Reactome pathway analysis of MAPK and cell junction organization pathway comparing ΔITGA2 with WT cells. NES = normalized enrichment score. Nominal p-value calculated by the permutation test in GSEA analysis. (E) Volcano plot shows differentially expressed phosphoproteins between WT and ΔITGA2 cells. y-axis defines the statistical significance -Log10p<2 and x-axis defines the magnitude of Log2-fold change >2 or < −2. Colored circle defines significantly decreased (blue) or increased (red) phosphopeptides in ΔITGA2 cells. (F) Heatmap analysis of KEGG hsa04510:focal adhesion pathway phosphoproteins. Data were analyzed based on three biological replicates of IGROV1 WT and ΔITGA2 cells. (G) Western blot analysis shows major change of phosphoproteins in the focal adhesion signaling upon treatment of 5 μM Defactinib for 24 hr. (H) Western blot analysis shows induced activation and phosphorylation of FAK/Src/MAPK signaling in patient-derived ITGA2high compared to ITGA2low omental tumor (n = 10).
Figure 7—figure supplement 1.
Figure 7—figure supplement 1.. Phosphoproteomics identify ITGA2-dependent activation of the FAK and MAPK signaling axis.
(A) KEGG PathView depicts up- (red) and downregulated (green) phosphoproteins of the focal adhesion pathway comparing ΔITGA2 to WT cells. (B) Dot plot highlights the Pearson correlation coefficient of ITGA2 expression to the genes involved in KEGG_focal adhesion pathway from TCGA-ovarian cancer RNA-seq dataset. (C) Western blot analysis shows altered expression of epithelial adhesion proteins in WT and ΔITGA2 cells. (D) Assessment of the relative abundance of MAPK1/MAPK3, FAK, and AKT phosphopeptides in WT and ΔITGA2 cells by phosphoproteomics.
Figure 7—figure supplement 2.
Figure 7—figure supplement 2.. Functional inhibition targeting ITGA2-dependent FAK/MAPK signaling axis.
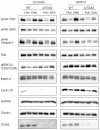
Immunoblot analysis shows downregulation of FAK and MAPK(ERK1/2) phosphorylation in WT and ΔITGA2 cells after 6 hr treatment with 10 μM Defactinib (FAKi) or FR180204 (ERKi).
Figure 7—figure supplement 3.
Figure 7—figure supplement 3.. Functional inhibition of ITGA2-dependent FAK/MAPK signaling axis reduces spheroid formation, mesothelial clearance activity but not cell adhesion.
(A) IGROV1 WT and ΔITGA2 cells were treated with 0, 1, or 10 μM of Defactinib for 16 hr and stained with Annexin V-FITC and DAPI to identify apoptotic dead cells. Data represent the mean ± SD (*p<0.05) from two independent experiments. (B) Anchorage-independent soft agar assay, cells were incubated with or without 5 μM of Defactinib for 10 days. Scale bar 100 μm. (C–D) Bar chart shows the quantification of total colony and the average diameters of spheroids (***p<0.001). (E) Cancer cell-collagen adhesion assay. Representative images show SKOV3 cell adhesion to collagen in the presence of DMSO, 1 μM of TC-I-15, Defactinib (FAK inhibitor) and FR180204 (ERK1/2 inhibitor). Bar chart with mean ± SD of the percentage of cell adhesion efficiency of cancer cells. (unpaired Student’s t-test, ***p<0.001). (F) Mesothelial clearance assay. SKOV3 cancer spheroids were seeded on top of a GFP-expressing MeT-5A mesothelial monolayer in the presence of DMSO or inhibitors for 20 hr. Mesothelial clearance area was measured by the size of black hole (white dash circle) using Image J software. Bar chart represents mean ± SD of clearance area from two independent experiment. Scale bar 200 μm.
Figure 8.
Figure 8.. Schematic representation of the ITGA2-collagen dependent signaling axis in ovarian cancer metastasis.

References

    1. Adorno-Cruz V, Liu H. Regulation and functions of integrin α2 in cell adhesion and disease. Genes & Diseases. 2019;6:16–24. doi: 10.1016/j.gendis.2018.12.003. - DOI - PMC - PubMed
    1. Baronas-Lowell D, Lauer-Fields JL, Borgia JA, Sferrazza GF, Al-Ghoul M, Minond D, Fields GB. Differential modulation of human melanoma cell metalloproteinase expression by alpha2beta1 integrin and CD44 triple-helical ligands derived from type IV collagen. The Journal of Biological Chemistry. 2004;279:43503–43513. doi: 10.1074/jbc.M405979200. - DOI - PubMed
    1. Barretina J, Caponigro G, Stransky N, Venkatesan K, Margolin AA, Kim S, Wilson CJ, Lehár J, Kryukov GV, Sonkin D, Reddy A, Liu M, Murray L, Berger MF, Monahan JE, Morais P, Meltzer J, Korejwa A, Jané-Valbuena J, Mapa FA, Thibault J, Bric-Furlong E, Raman P, Shipway A, Engels IH, Cheng J, Yu GK, Yu J, Aspesi P, de Silva M, Jagtap K, Jones MD, Wang L, Hatton C, Palescandolo E, Gupta S, Mahan S, Sougnez C, Onofrio RC, Liefeld T, MacConaill L, Winckler W, Reich M, Li N, Mesirov JP, Gabriel SB, Getz G, Ardlie K, Chan V, Myer VE, Weber BL, Porter J, Warmuth M, Finan P, Harris JL, Meyerson M, Golub TR, Morrissey MP, Sellers WR, Schlegel R, Garraway LA. The Cancer cell line encyclopedia enables predictive modelling of anticancer drug sensitivity. Nature. 2012;483:603–607. doi: 10.1038/nature11003. - DOI - PMC - PubMed
    1. Bartolomé RA, Barderas R, Torres S, Fernandez-Aceñero MJ, Mendes M, García-Foncillas J, Lopez-Lucendo M, Casal JI. Cadherin-17 interacts with α2β1 integrin to regulate cell proliferation and adhesion in colorectal Cancer cells causing liver metastasis. Oncogene. 2014;33:1658–1669. doi: 10.1038/onc.2013.117. - DOI - PubMed
    1. Bell-McGuinn KM, Matthews CM, Ho SN, Barve M, Gilbert L, Penson RT, Lengyel E, Palaparthy R, Gilder K, Vassos A, McAuliffe W, Weymer S, Barton J, Schilder RJ. A phase II, single-arm study of the anti-α5β1 integrin antibody volociximab as monotherapy in patients with platinum-resistant advanced epithelial ovarian or primary peritoneal Cancer. Gynecologic Oncology. 2011;121:273–279. doi: 10.1016/j.ygyno.2010.12.362. - DOI - PMC - PubMed

Publication types

LinkOut - more resources