. 2020 Nov 3;32(5):801-813.e6.
doi: 10.1016/j.cmet.2020.09.011. Epub 2020 Oct 6.

Ablation of Fat Cells in Adult Mice Induces Massive Bone Gain

Affiliations

Ablation of Fat Cells in Adult Mice Induces Massive Bone Gain

Wei Zou et al. Cell Metab. .

Abstract

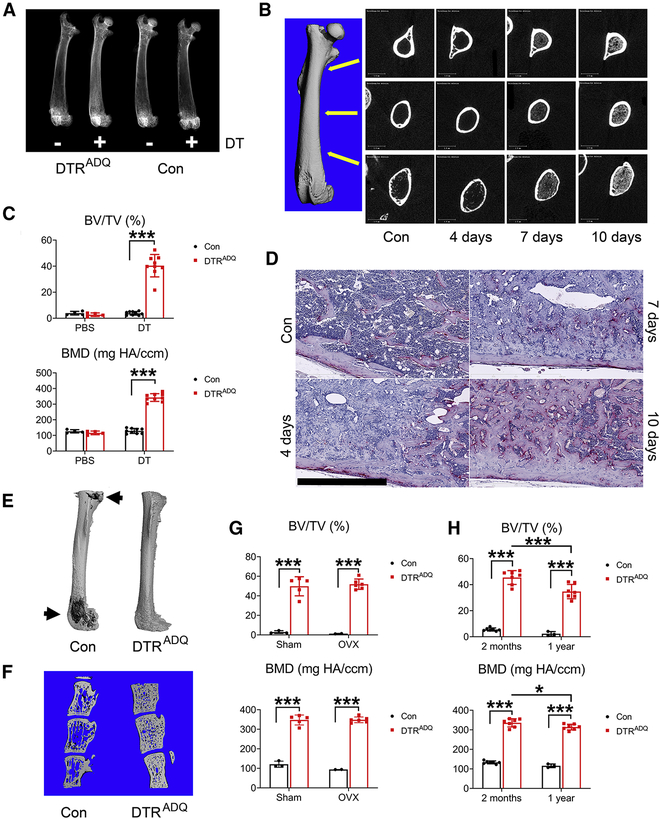
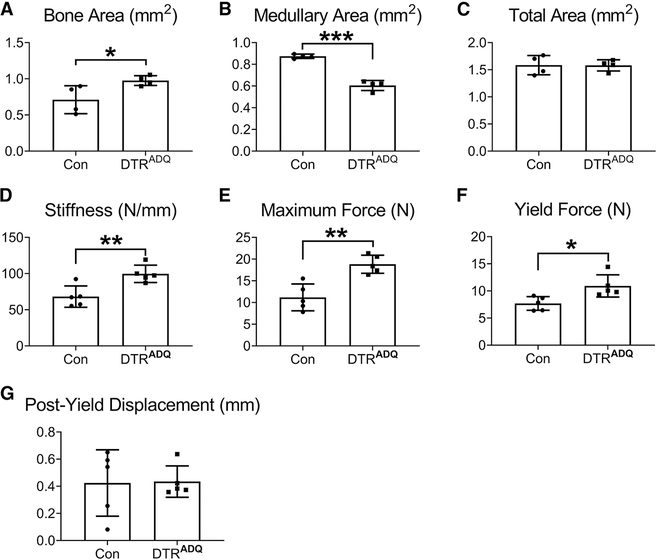
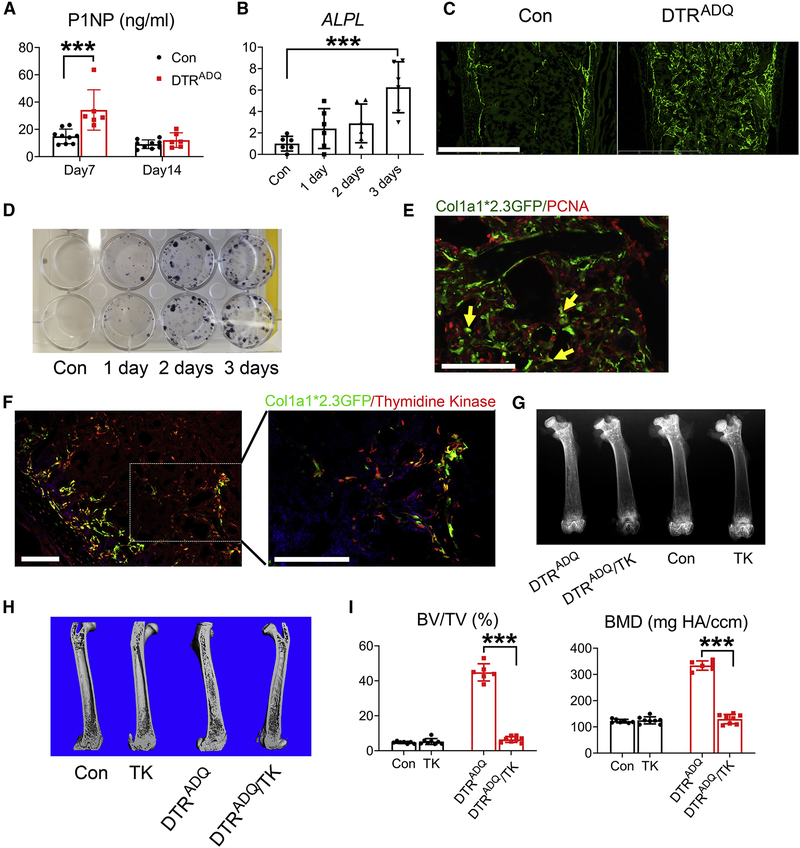
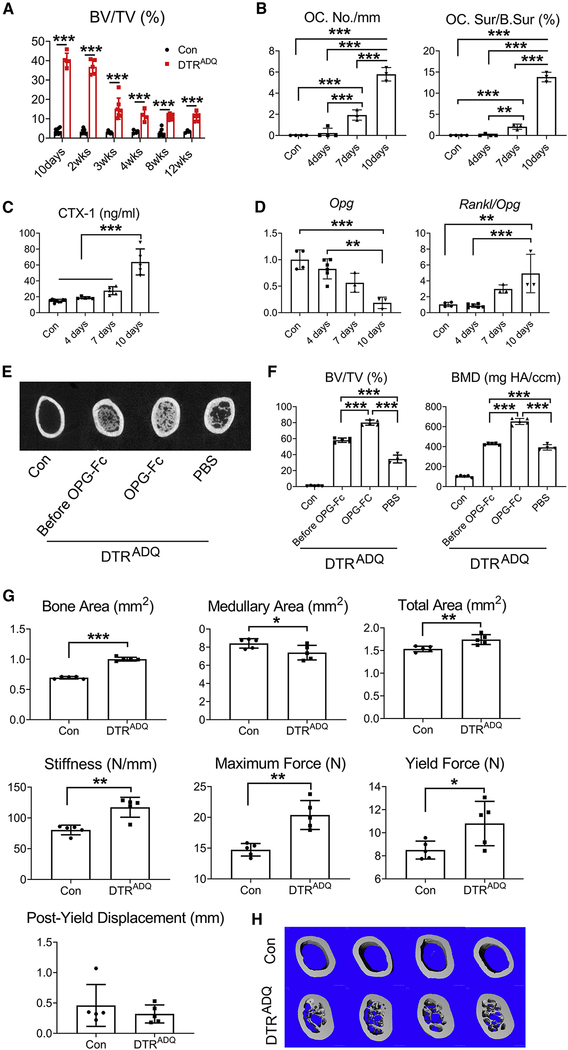
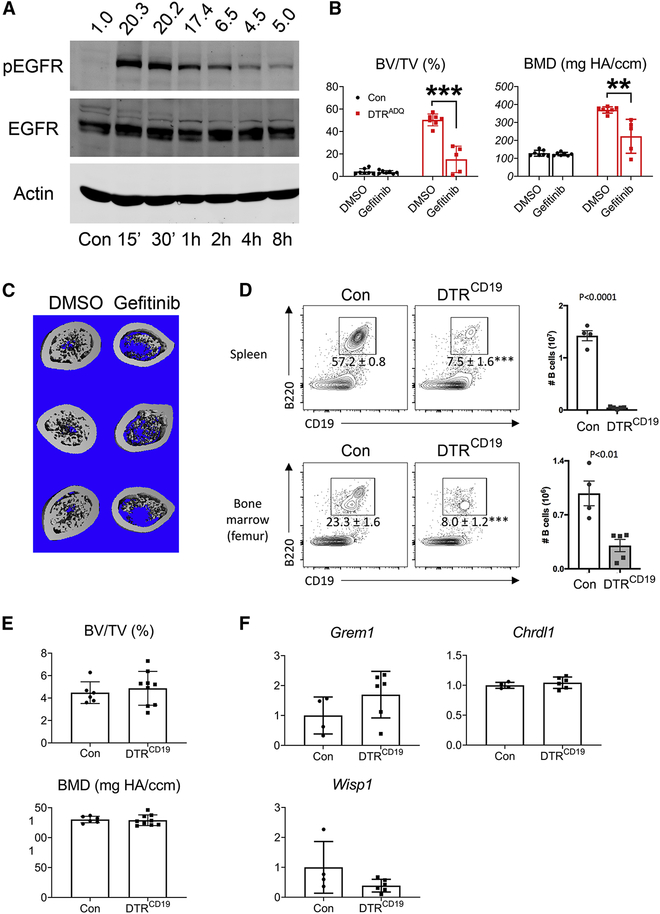
Adipocytes control bone mass, but the mechanism is unclear. To explore the effect of postnatal adipocyte elimination on bone cells, we mated mice expressing an inducible primate diphtheria toxin receptor (DTR) to those bearing adiponectin (ADQ)-Cre. DTR activation eliminates peripheral and marrow adipocytes in these DTRADQ mice. Within 4 days of DTR activation, the systemic bone mass of DTRADQ mice began to increase due to stimulated osteogenesis, with a 1,000% expansion by 10-14 days post-DTR treatment. This adipocyte ablation-mediated enhancement of skeletal mass reflected bone morphogenetic protein (BMP) receptor activation following the elimination of its inhibitors, associated with simultaneous epidermal growth factor (EGF) receptor signaling. DTRADQ-induced osteosclerosis is not due to ablation of peripheral adipocytes but likely reflects the elimination of marrow ADQ-expressing cells. Thus, anabolic drugs targeting BMP receptor inhibitors with short-term EGF receptor activation may be a means of profoundly increasing skeletal mass to prevent or reverse pathological bone loss.

Keywords: BMPR activation; adipocyte; bone formation; heparin-binding epidermal like growth factor.


Conflict of interest statement

Declaration of Interests R.A.B. may receive royalty income based on the CompBio technology developed by R.A.B. and licensed by Washington University to PercayAI. All other authors declare no competing interests.

Figures

Fig 1.
Fig 1.. Adult fat ablated mice are osteosclerotic.
(A-F) 2 month old control (Con) or DTRADQ mice were daily injected with Diphtheria Toxin (DT) (100ng/mouse/day) or PBS. (A) Representative radiographs of femurs after 10 days of DT or PBS injection. n = 6/group. (B) Representative μCT images of DTRADQ femurs, extending from metaphysis to diaphysis, with time of DT injection. n = 6/group. (C) Quantitative μCT analysis of whole femur of Con or DTRADQ mice after 10 days of DT or PBS injection. n = 4–9/group. (D) Representative histological section of femur of 2 month old DTRADQ mice treated with DT with time. n = 5/group. Control (Con) received PBS for 10 days; Scale bar: 800 μm. (E) Representative μCT images of osmium-stained femurs of Con and DTRADQ mice 4 days after DT injection. n = 5/group. Marrow fat in dark gray (arrows), decalcified bone overlaid in light grey. (F) Representative μCT images of vertebrae (L3–5) of Con and DTRADQ mice 10 days after DT injection. n = 5/group. (G) 2 month old Con or DTRADQ mice were subjected to ovariectomy or sham operation. 3 weeks after surgery, mice were daily injected with DT for 10 days. Whole femur BV/TV and BMD were analyzed by μCT. n = 2–6/group. (H) 2 month or 1 year old Con or DTRADQ mice were daily injected with DT for 10 days. Whole femur was analyzed by μCT. n = 3–7/group. Data are presented as mean ± SD. * P < 0.05, *** P < 0.001 as determined by 2 way ANOVA with Holm-Sidak’s post hoc analysis for multiple comparisons test (C, G, H).
Fig 2.
Fig 2.. Post-natal fat ablation enhances bone strength.
2 month-old control (Con) or DTRADQ mice were daily injected with Diphtheria Toxin (DT) (100ng/mouse/day) for 10 days. μCT analysis of femoral (A) diaphyseal bone area, (B) medullary area and (C) total area. Bending tests analysis of femoral (D) stiffness, (E) maximum force (a measure of whole bone strength) and (F) yield force, (G) Post yield displacement. n = 5/group. Data are presented as mean ± SD. * P < 0.05, ** P < 0.01, *** P < 0.001 as determined by unpaired t test.
Fig 3.
Fig 3.. DT/DTRADQ osteosclerosis is due to enhanced osteoblast recruitment and differentiation.
(A) Serum P1NP of Con and DTRADQ mice after 7 days and 14 days of DT injection. n = 6–9/group. (B) qPCR analysis of femoral marrow alkaline phosphatase mRNA of 2month old DTRADQ mice treated with DT with time. Con represents 3 days of PBS injection. n = 6/group. (C) Representative fluorescent microscopic images of femoral diaphysis of DTRADQ mice mated to Col1a1*2.3GFP reporter mice treated with DT for 4 days. Con were mated to Col1a1*2.3GFP reporter mice and treated with DT for 4 days. n = 4/group. Scale bar: 800 μm. (D) CFU-OBs generated from crushed periosteum-stripped femur of DTRADQ mice treated with DT with time. No DT treatment serves as Con. n = 3 independent experiments. (E) PCNA (red) fluorescent immunohistochemical staining of femoral diaphysis of DTRADQ/Col1a1*2.3 GFP mice treated with DT for 4 days. Arrows indicate occasional cells (yellow) expressing both PCNA and GFP. n = 4/group. Scale bar: 100 μm (F) Thymidine Kinase (TK) fluorescent immunohistochemical staining (red) of femoral diaphysis of DTRADQ/Col1a1*2.3 GFP/Col1a1*3.6-TK mice treated with DT for 4 days. n = 4/group. Scale bar: 100 μm. (G-I) Con or DTRADQ mice were mated with Col1a1*3.6 -TK mice. At 2 months of age all genotypes were treated with DT and Ganciclovir for 10 days. G) Representative radiographs of femurs; H) Representative μCT images of femurs; I) Quantitative μCT analysis of whole femur of H. n = 6–8/group. Data are presented as mean ± SD. * P < 0.05, *** P < 0.001 as determined by 1 way (B) or 2 way (A, I) ANOVA with Holm-Sidak’s post hoc analysis for multiple comparisons test.
Fig 4.
Fig 4.. Anti-resorptive therapy maintains DT/DTRADQ-mediated osteosclerosis.
(A) Quantitative μCT analysis of whole femur of Con and DTRADQ mice treated with DT daily with time. n = 3–8/group. (B) Histomorphometric analysis of osteoclast number/mm bone surface and osteoclast surface/bone surface in femoral diaphysis of DTRADQ mice treated with DT with time. No DT treatment serves as control. n = 3–4/group. (C) Serum CTX-1 of DTRADQ mice treated with DT daily with time. Non DT injected DTRADQ mice serve as control. n = 5–9/group. (D) qPCR analysis of femoral bone OPG mRNA and Rankl/OPG ratio of 2month old DTRADQ mice treated with DT with time. No DT treatment DTRADQ mice serve as control. n = 3–6/group. (E-F) 2 months old Con or DTRADQ mice treated with DT for 10 days (Before OPG-Fc) or DTRADQ mice treated with DT, with or without OPG-Fc, for an additional 20 days. (E) Representative μCT image of femoral diaphysis; F) Whole femur quantitative μCT analysis. n = 4–5/group. (G-H) Control (Con) or DTRADQ mice were daily injected with Diphtheria Toxin (DT) (100ng/mouse/day) for 2 months. (G) μCT analysis of femoral diaphyseal bone area, medullary area and total area. Bending tests analysis of femoral stiffness, maximum force, yield force and post yield displacement. n = 5/group. (H) Representative μCT image of femoral diaphysis of Con or DTRADQ mice treated with DT for 2 months. n = 5/group. Data are presented as mean ± SD. * P < 0.05, ** P < 0.01, *** P < 0.001 as determined by unpaired t test (G), 1 way (B,C,D, F) or 2 way (A) ANOVA with Holm-Sidak’s post hoc analysis for multiple comparisons test.
Fig 5.
Fig 5.. DT/DTRADQ-induced osteogenesis is not mediated by loss of peripheral adipose tissue.
(A) 2 months after WT WAT transplantation, mice were administrated DT daily. WT (Con) and sham operated DTRADQ mice serve as controls. Serum glucose was measured before (Day0) or after DT daily treatment (Day1- Day9). n = 4–8/group. (B) Quantitative μCT analysis of whole femur of DTRADQ mice 2 months after WT WAT transplantation, treated with DT for 10 days. WT (Con) and sham operated DTRADQ mice serve as controls. n = 3–8/group. C) Quantitative μCT analysis of whole femur of WT mice 2 months after WT or DTRADQ WAT transplantation treated with DT for 10 days. Non-transplanted DTRADQ mice serve as control. n = 2–8/group. (D) 2 month old control and DTRADQ female mice were parabiosed. 2 months after surgery, DT was directly injected into Con or DTRADQ mice as indicated for 10days. n = 3 pairs/group. Upper panel: the scheme of parabiosis experiment; Lower panel: representative μCT images of femurs of Con and DTRADQ mice of each partner. Data are presented as mean ± SD. * P < 0.05, *** P < 0.001 as determined by 1 way (B, C) or 2 way (A) ANOVA with Holm-Sidak’s post hoc analysis for multiple comparisons test.
Fig 6.
Fig 6.. BMPR signaling mediates adipocyte ablation-induced osteogenesis.
(A) Heatmap of RNA sequencing of bone marrow mRNAs of DTRADQ mice treated with or without (Con) DT with time. (B) CompBio analysis of downregulated and upregulated pathways of RNA sequencing of bone marrow mRNA of DTRADQ mice treated with or without DT for 3 days. (C) qPCR analysis of Chrdl1, Grem1, Adiponectin and Wisp1 mRNA in femoral bone marrow of 2 month old DTRADQ mice treated with DT with time; Con received no DT. n = 3–6/group. (D) qPCR analysis of inflammatory cytokine mRNA in femoral bone marrow of 2 month old DTRADQ mice treated with or without DT for 3 days. n = 6/group. (E) Marrow stromal cells were cultured in the presence (Adipo-Diff) or absence (MSC) of adipocyte differentiation media for 8 days. Chrdl1 and Grem1 gene expression was analyzed by qPCR. n = 6–7/group. (F) immuno-blot analysis of Phospho-Smad1,5,8 in whole bone marrow lysates of DTRADQ mice treated with DT with time. Con received no DT. Densitometric analysis is performed relative to Smad 5. n = 3 independent experiments. (G) Representative fluorescent microscopic images of phosphor-Smad1,5,8 (red) immunohistochemical staining of distal femur of DTRADQ/Col1a1*2.3 GFP mice treated with or without DT for 4 days. n = 3/group. Scale bar: 100 μm. (H) Representative μCT images of femoral diaphysis of DTRADQ mice treated with DT with or without LDN193189 for 10 days. No DT treatment serves as control. n = 6–7/group. (I) Whole femur quantitative μCT analysis of (G). n = 6–7/group. Data are presented as mean ± SD. * P < 0.05, *** P < 0.001 as determined by unpaired t test (D, E) or 1 way ANOVA with Holm-Sidak’s post hoc analysis for multiple comparisons test (C, I).
Fig 7.
Fig 7.. EGFR and BMPR signaling partner to promote osteogenesis.
(A) ST2 cells were treated with HB-EGF (5ng/ml) for indicated time and pEGFR was detected by immunoblot. Actin and EGFR serve as loading controls. Densitometric analysis is performed relative to EGFR. n = 3 independent experiments. (B) Quantitative μCT analysis of whole femur of DTRADQ mice treated with DT in the presence or absence of Gefitinib (100mg/Kg) daily for 10 days. n = 5–7/group. (C) μCT images of femoral diaphysis of (B). n = 5–7/group. (D) Con and DTRCD19 mice were treated with DT daily for 3 days. Upper panel: Left: FACS plots of CD19+ B220+ B cells in the spleen, pre-gated on CD45+ cells. Numbers show frequencies of CD45+ cells that are B cells. Right: Numbers of CD45+ CD19+ B220+ B cells in the spleen. Lower panel: Left: FACS plots of CD19+ B220+ B cells in the femur bone marrow, pre-gated on CD45+ cells. Numbers show frequencies of CD45+ cells that are B cells. Right: Numbers of CD45+ CD19+ B220+ B cells in the bone marrow. n = 4–5/group. (E) Quantitative μCT analysis of whole femur of Con and DTRCD19 mice after treated with DT daily for 10 days. n = 6–9/group. (F) Con and DTRCD19 mice were treated with DT daily for 3 days. qPCR analysis of femoral marrow Chrdl1, Grem1 and Wisp1 mRNA. n = 4–6/group. Data are presented as mean ± SD. ** P < 0.01, *** P < 0.001 as determined by unpaired t test (D-F) or 1 way ANOVA with Holm-Sidak’s post hoc analysis for multiple comparisons test (B).

References

    1. Ahn J, Serrano de la Pena L, Shore EM, and Kaplan FS (2003). Paresis of a bone morphogenetic protein-antagonist response in a genetic disorder of heterotopic skeletogenesis. J. Bone Joint Surg. Am 85-a, 667–674. - PubMed
    1. Al-Shawi R, Burke J, Jones CT, Simons JP, and Bishop JO (1988). A Mup promoter-thymidine kinase reporter gene shows relaxed tissue-specific expression and confers male sterility upon transgenic mice. Mol. Cell. Biol 8, 4821–4828. - PMC - PubMed
    1. Appelman-Dijkstra NM, and Papapoulos SE (2016). From disease to treatment: from rare skeletal disorders to treatments for osteoporosis. Endocrine 52, 414–426. - PMC - PubMed
    1. Black DM, Bilezikian JP, Ensrud KE, Greenspan SL, Palermo L, Hue T, Lang TF, McGowan JA, Rosen CJ, and Pa THSI (2005). One year of alendronate after one year of parathyroid hormone (1–84) for osteoporosis. N. Engl. J. Med 353, 555–565. - PubMed
    1. Chandra A, Lan S, Zhu J, Siclari VA, and Qin L (2013). Epidermal growth factor receptor (EGFR) signaling promotes proliferation and survival in osteoprogenitors by increasing early growth response 2 (EGR2) expression. J. Biol. Chem 288, 20488–20498. - PMC - PubMed

Publication types