. 2020 Oct 6;33(1):108231.
doi: 10.1016/j.celrep.2020.108231.

Respiratory Supercomplexes Promote Mitochondrial Efficiency and Growth in Severely Hypoxic Pancreatic Cancer

Affiliations

Respiratory Supercomplexes Promote Mitochondrial Efficiency and Growth in Severely Hypoxic Pancreatic Cancer

Kate E R Hollinshead et al. Cell Rep. .

Abstract

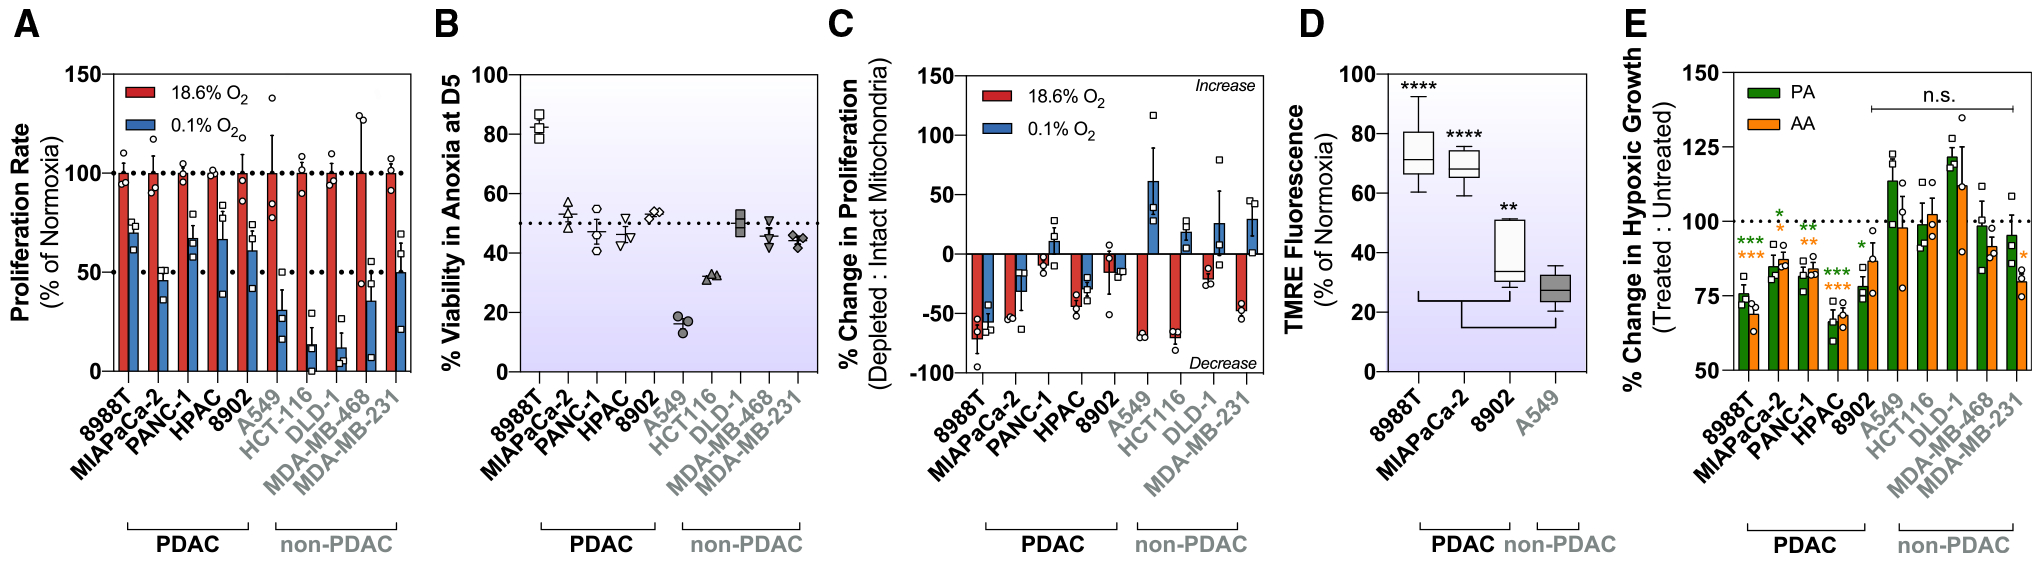
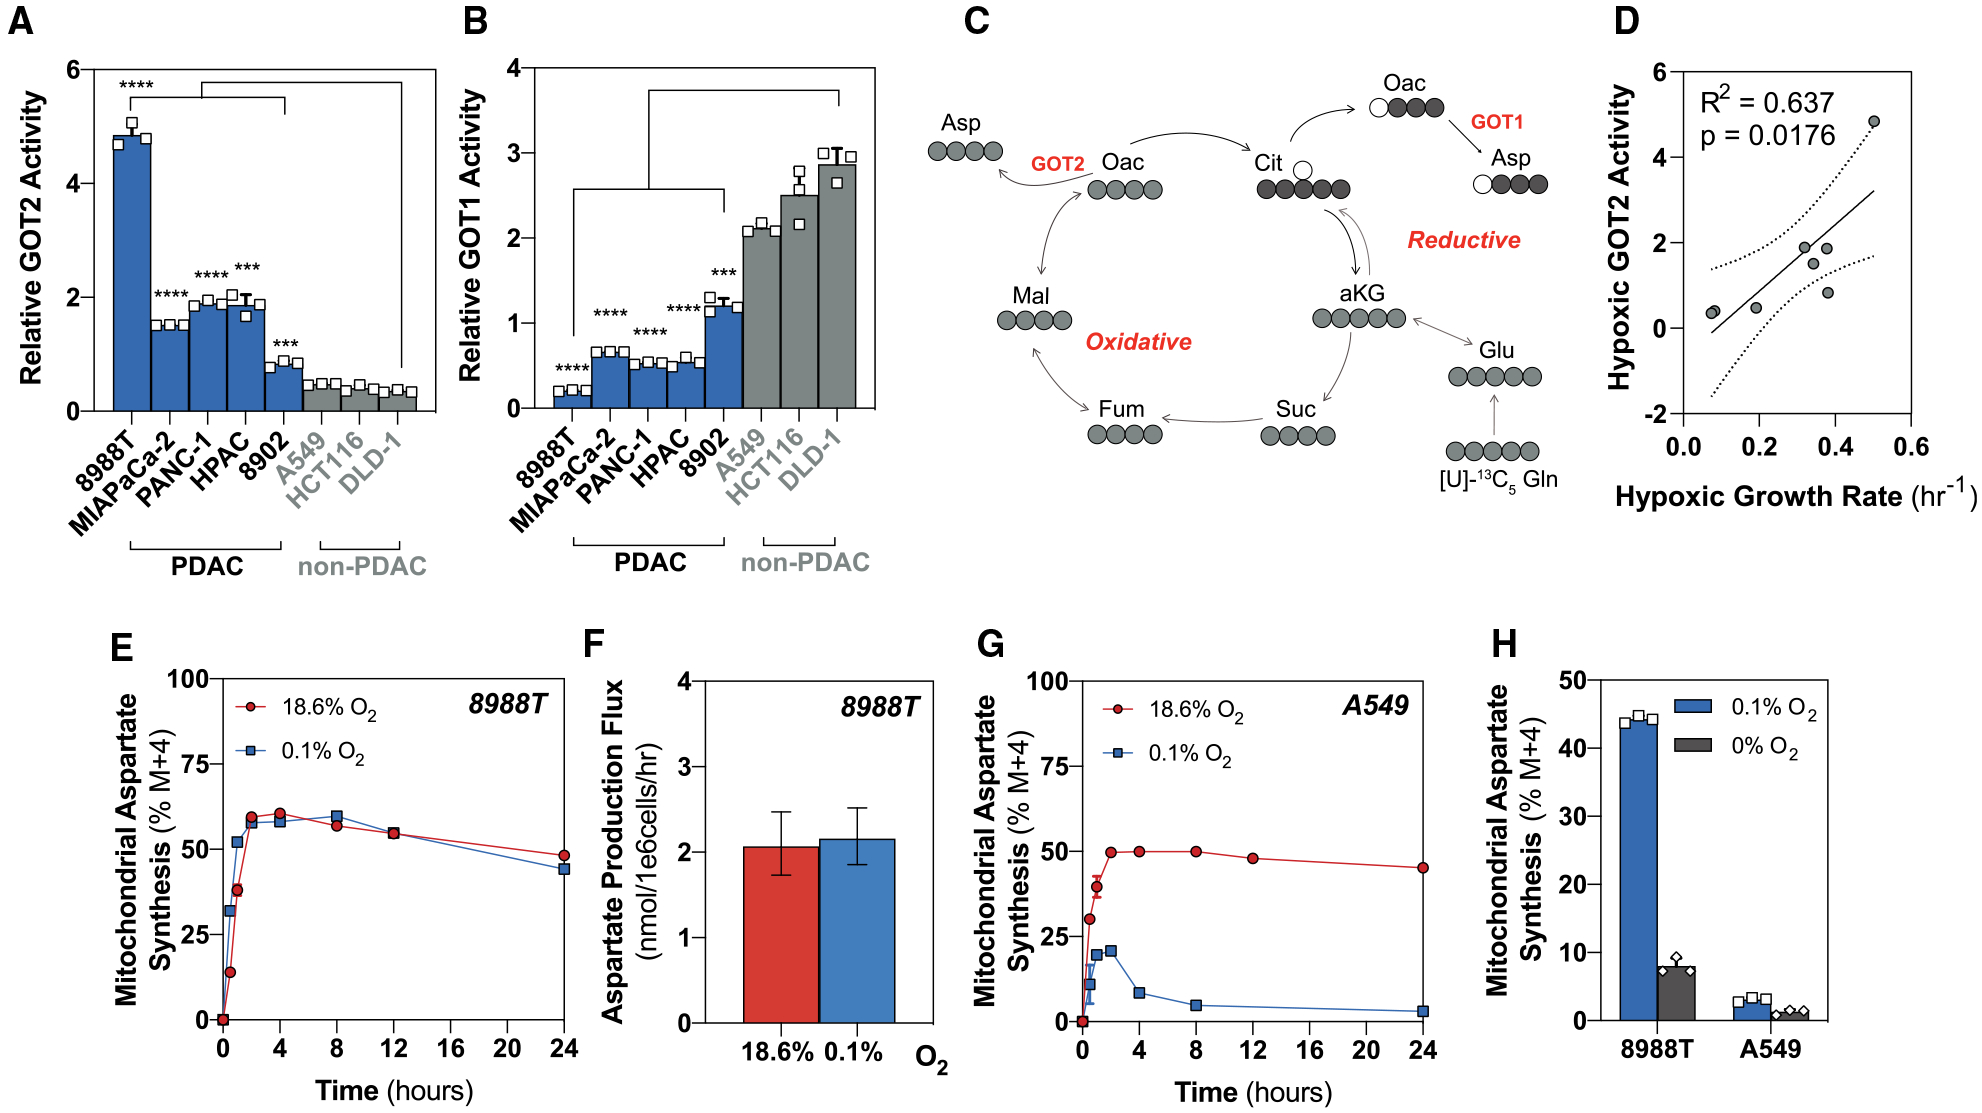
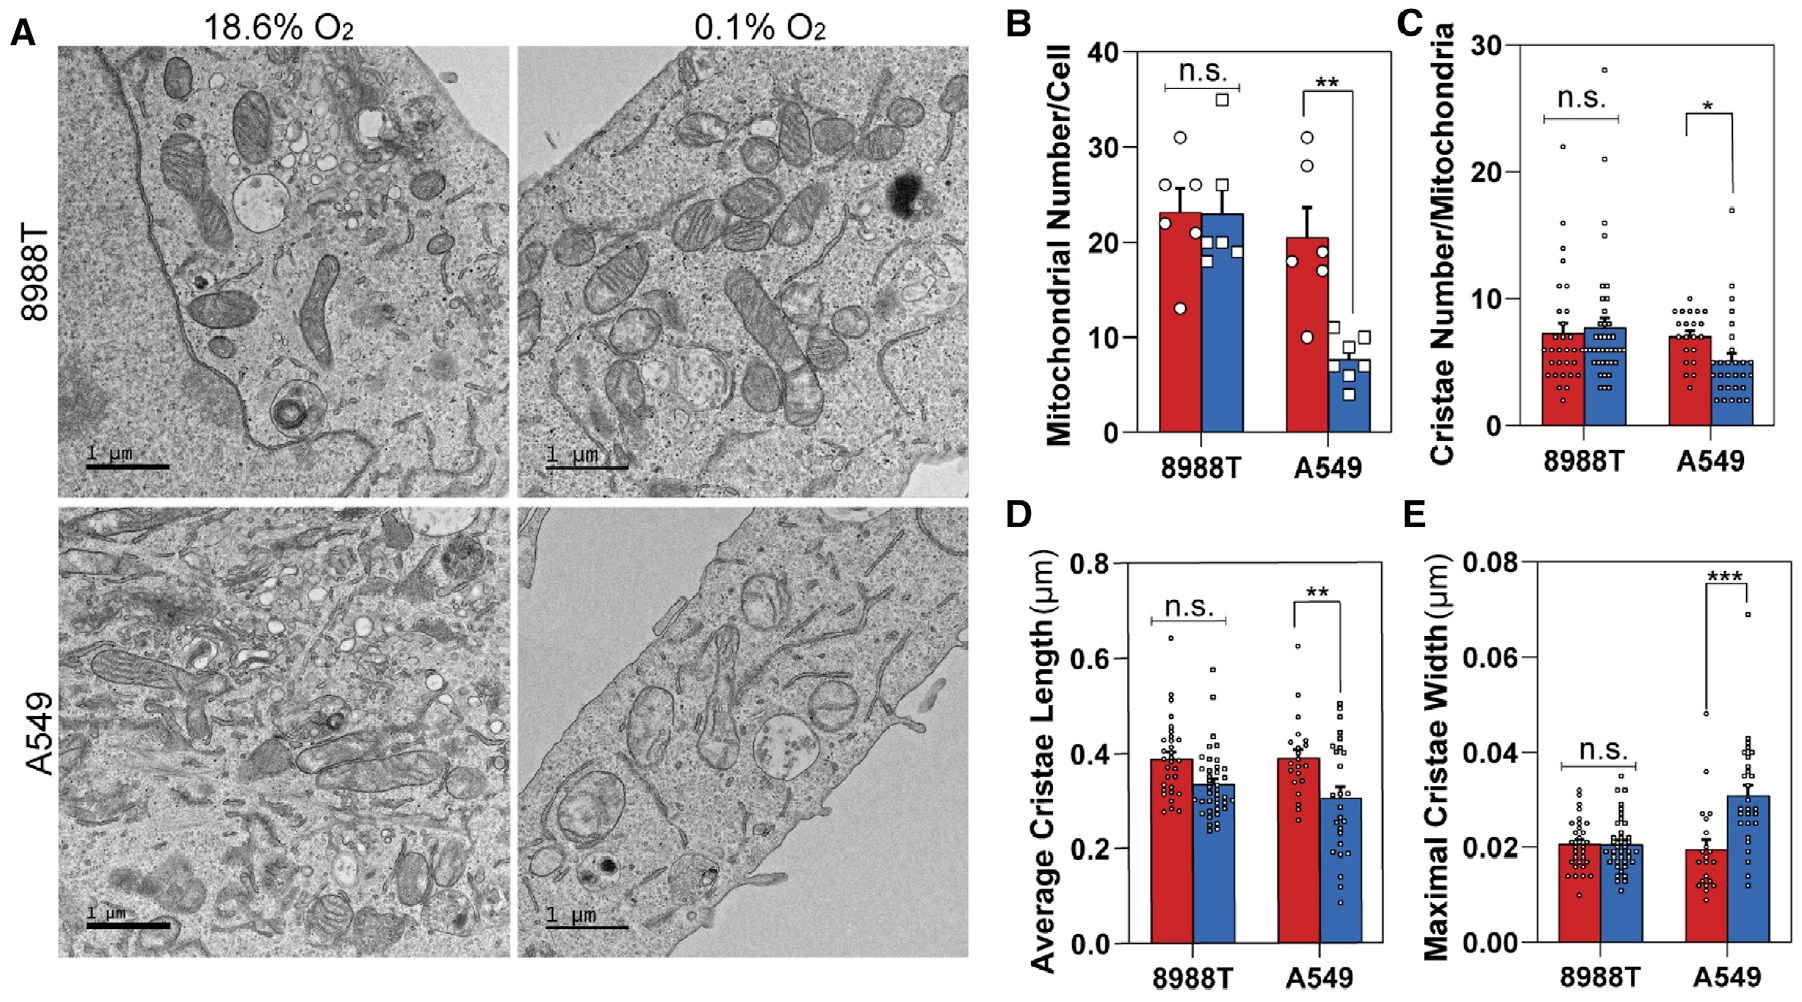
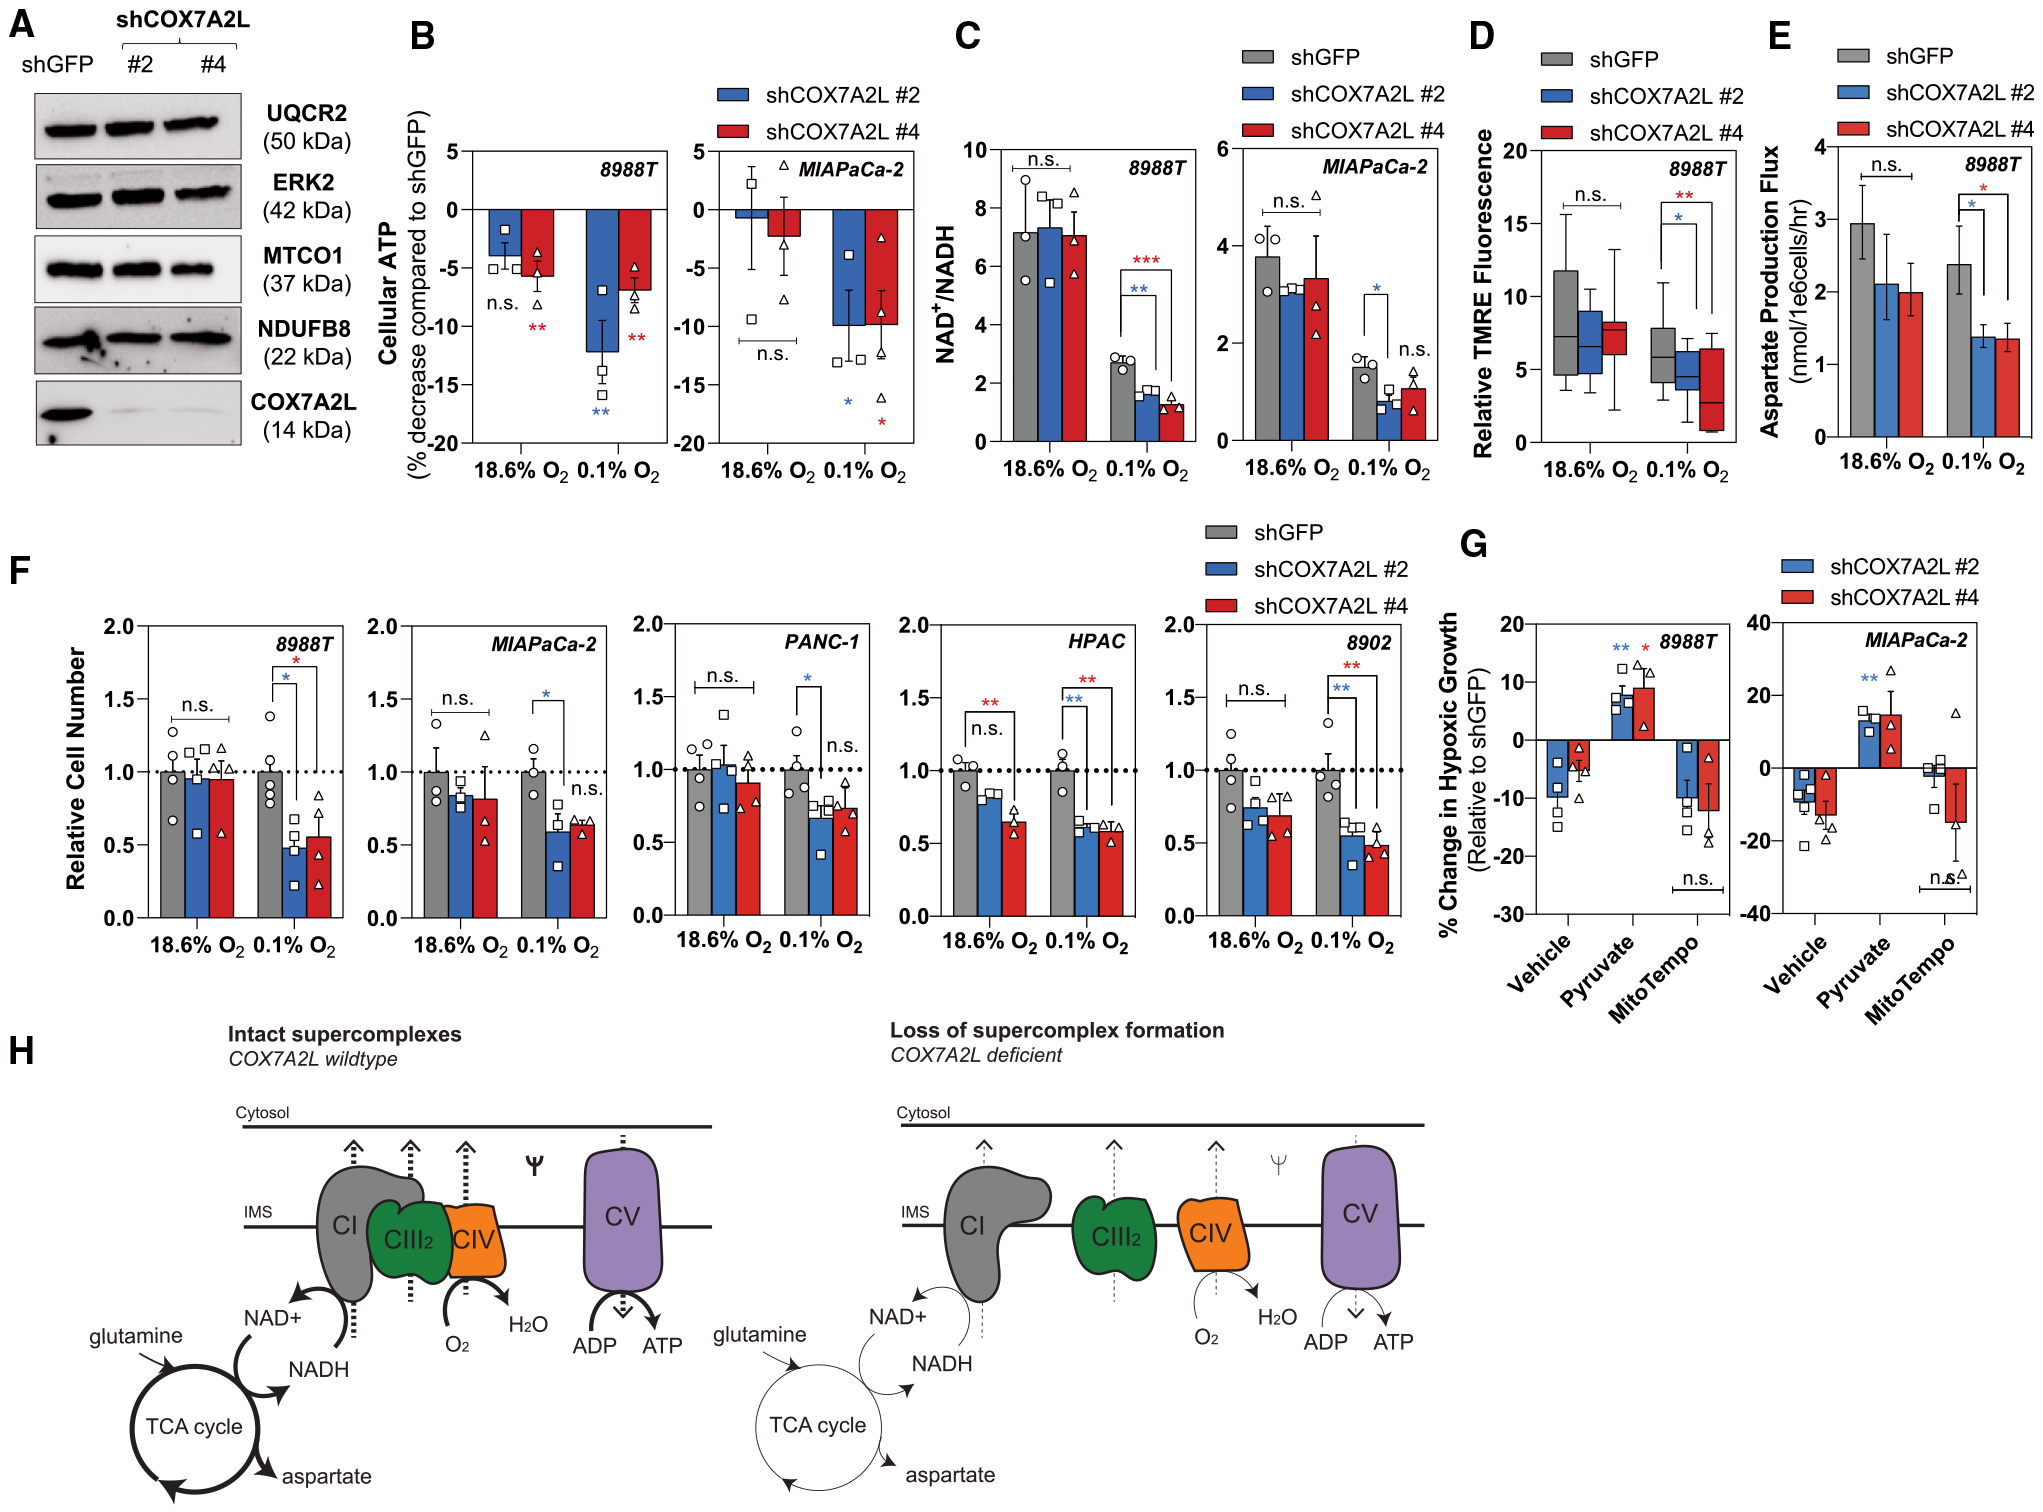
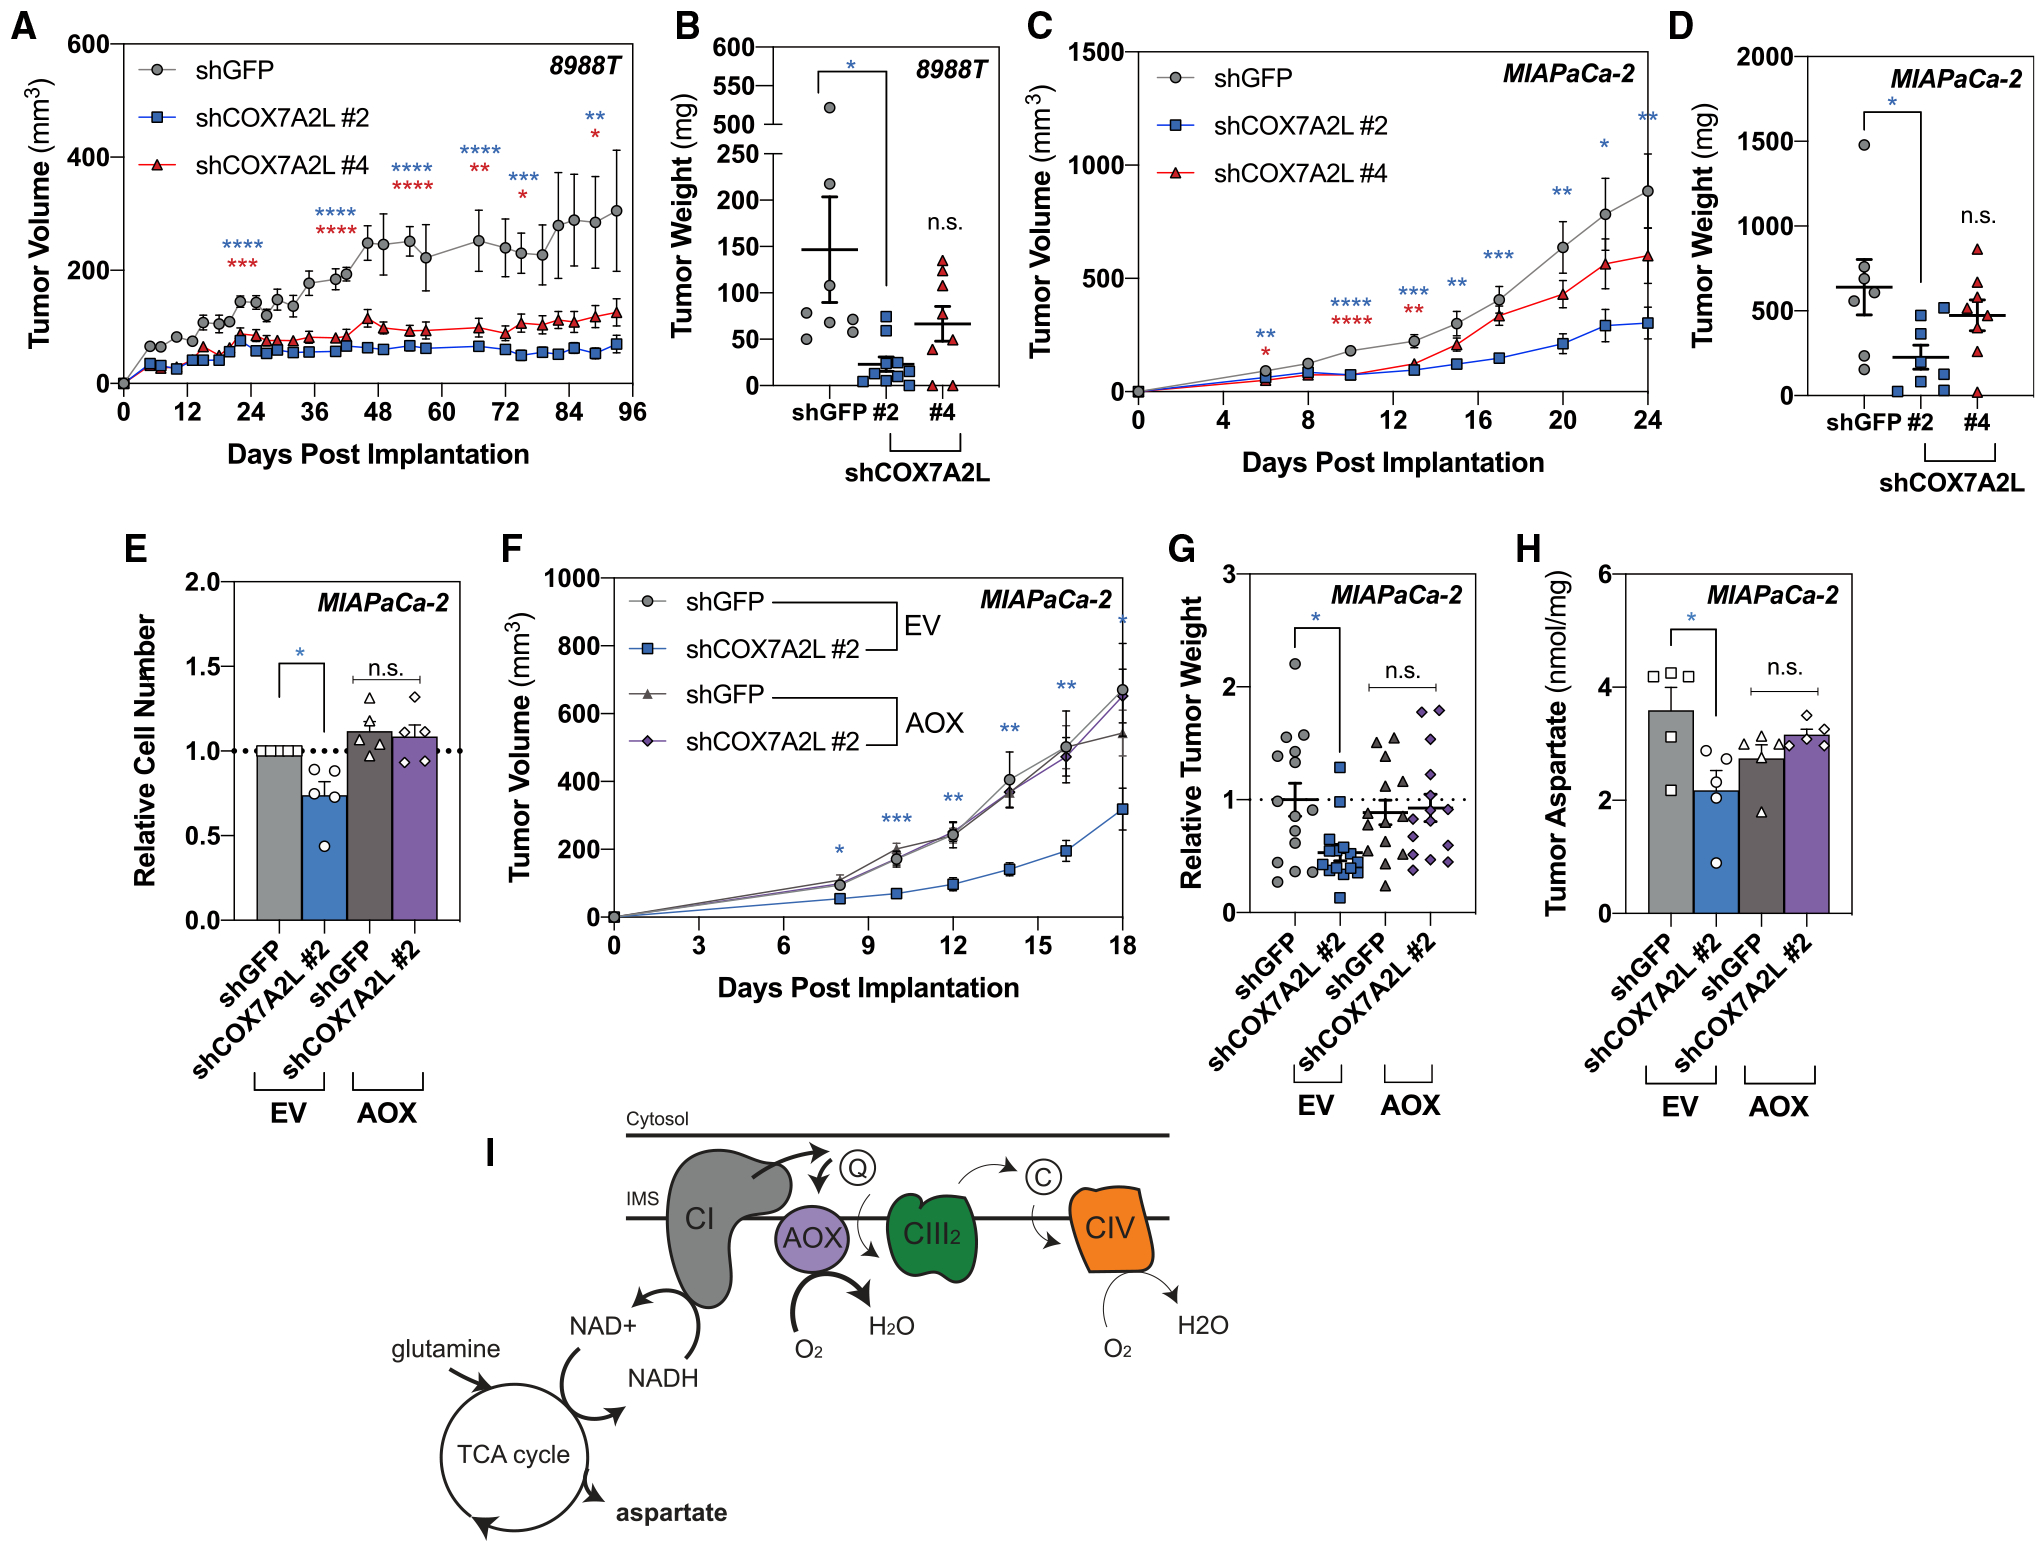
Pancreatic ductal adenocarcinoma (PDAC) is characterized by extensive fibrosis and hypovascularization, resulting in significant intratumoral hypoxia (low oxygen) that contributes to its aggressiveness, therapeutic resistance, and high mortality. Despite oxygen being a fundamental requirement for many cellular and metabolic processes, and the severity of hypoxia in PDAC, the impact of oxygen deprivation on PDAC biology is poorly understood. Investigating how PDAC cells survive in the near absence of oxygen, we find that PDAC cell lines grow robustly in oxygen tensions down to 0.1%, maintaining mitochondrial morphology, membrane potential, and the oxidative metabolic activity required for the synthesis of key metabolites for proliferation. Disrupting electron transfer efficiency by targeting mitochondrial respiratory supercomplex assembly specifically affects hypoxic PDAC proliferation, metabolism, and in vivo tumor growth. Collectively, our results identify a mechanism that enables PDAC cells to thrive in severe, oxygen-limited microenvironments.

Keywords: COX7A2L; aspartate; electron transport chain; hypoxia; pancreatic cancer; respiration; supercomplexes.


Conflict of interest statement

Declaration of Interests A.C.K. has financial interests in Vescor Therapeutics. A.C.K. is an inventor on patents pertaining to KRAS-regulated metabolic pathways, redox control pathways in pancreatic cancer, targeting GOT1 as a therapeutic approach, and the autophagy control of iron metabolism. A.C.K. is on the Scientific Advisory Board of Rafael/Cornerstone Pharmaceuticals. A.C.K. is a consultant for Deciphera. The other authors declare no competing interests.

Figures

Figure 1.
Figure 1.. Pancreatic Cancer Cells Sustain Growth during Severe Hypoxia
(A) Relative proliferation rates of cells exposed to 0.1% oxygen, shown as a percentage of normoxic growth (mean ± SEM, n = 3). Proliferation rates were calculated using the exponential growth equation from three independent growth curves shown in Figure S1. (B) Percentage of viable cells after 5 days (D5) in anoxia (0% O2) (mean ± SEM, n = 3). (C) Change in normoxic and hypoxic (0.1% O2) growth in cells with intact or depleted mitochondria (p0). p0 is shown as a percentage of intact mitochondria (mean ± SEM, n = 3). (D) Membrane potential measurements using tetramethylrhodamine (TMRE) in normoxic and hypoxic (0.1% O2) conditions. 10–20 fields recorded per condition. Hypoxic data are shown as a percentage of normoxic conditions. (E) Hypoxic (0.1% O2) cells treated with ETC inhibitors piericidin A (25 nM), and antimycin A (50 nM) for 5 days. Treated cells are shown as a percentage of untreated cells (mean ± SEM, n = 3). Significance was determined using Dunnett’s multiple comparison test in (D) and (E), where n.s. ≥ 0.05, *p < 0.05, **p < 0.01, ***p < 0.001, and ****p ≤ 0.0001.
Figure 2.
Figure 2.. Pancreatic Cancer Cells Uniquely Maintain Oxidative Metabolism during Severe Hypoxia
(A) Relative GOT2 activity after 24 h in hypoxia (0.1% O2) determined by calculating the fraction of M+4:M+3 at steady state from [U]-13C5 glutamine (mean ± SD, n = 3). (B) Relative GOT1 activity after 24 h in hypoxia (0.1% O2) determined by calculating the fraction of M+3:M+4 at steady state from [U]-13C5 glutamine (mean ± SD, n = 3). (C) Schematic to show downstream label incorporation from [U]-13C5 glutamine. M+4 is produced through the oxidative activity of mitochondrial aspartate aminotransferase 2 (GOT2) (light gray), and M+3 is produced through the reductive activity of cytosolic aspartate aminotransferase (GOT1) (dark gray). (D) Linear regression between hypoxic (0.1% O2) GOT2 activity (M+4:M+3) and the hypoxic (0.1% O2) growth rate (per hour). Hypoxic (0.1% O2) growth rates were calculated from the growth curves in Figure S1. (E) Kinetic labeling data in normoxic and severely hypoxic (0.1% O2) 8988T cells using [U]-13C5 glutamine (mean ± SD, n = 3). (F) Aspartate production flux in normoxic and severely hypoxic (0.1% O2) 8988T cells calculated from [U]-13C5 glutamine (mean ± 95% confidence interval [CI], n = 3). (G) Kinetic labeling data in normoxic and severely hypoxic (0.1% O2) A549 cells using [U]-13C5 glutamine (mean ± SD, n = 3). (H) Percentage of aspartate (M+4) from [U]-13C5 glutamine in 8988T and A549 cells at steady state after 24 h in anoxic (0% O2) or hypoxic (0.1% O2) conditions (mean ± SD, n = 3). Values for hypoxic (0.1% O2) 8988T and A549 are shown in (E) and (G). Significance was determined using Dunnett’s multiple comparison test in (A) and (B), where ***p < 0.001 and ****p ≤ 0.0001.
Figure 3.
Figure 3.. Pancreatic Cancer Cells Maintain Mitochondrial Morphology During Severe Hypoxia
(A) Representative TEM images of 8988T (upper) and A549 (lower) cell lines after 24 h in normoxia (left) or severe hypoxia (0.1% O2) (right). (B) Quantification of mitochondrial number per cell in 8988T and A549 cells in normoxia or severe hypoxia (0.1% O2). A minimum of six images were collected per condition at 3,400× magnification in a user-blinded fashion (mean ± SEM, n = 6). (C) Quantification of cristae number per mitochondria in 8988T and A549 cells in normoxia or severe hypoxia (0.1% O2). Cristae numbers from 21–39 mitochondria were counted per condition at random from images collected in a user-blinded fashion (mean ± SEM, n > 20). (D) Quantification of average cristae length in 8988T and A549 cells in normoxia or severe hypoxia (0.1% O2). Average cristae length was calculated from 21–39 mitochondria per condition at random from images collected in a user-blinded fashion (mean ± SEM, n > 20). (E) Quantification of maximal cristae width in 8988T and A549 cells in normoxia or severe hypoxia (0.1% O2). Maximal cristae width was calculated from 21–39 mitochondria per condition at random from images collected in a user-blinded fashion (mean ± SEM, n > 20). Significance was determined using an unpaired Student’s two-tailed t test in (B)–(E), where n.s. ≥ 0.05, *p < 0.05, **p < 0.01, and ***p < 0.001.
Figure 4.
Figure 4.. Mitochondrial Respiratory Supercomplexes Are Required for Metabolic Fitness in Severely Hypoxic Pancreatic Cancer Cells
(A) Representative western blot demonstrating COX7A2L knockdown in 8988T cells with unchanged expression of endogenous complex I (NDUFB8), complex III (UQCR2), and complex IV (MTCO1). ERK2 used as a loading control. (B) Percentage decrease in cellular ATP levels in 8988T cells (left) and MIAPaCa-2 cells (right) with loss of COX7A2L after 24 h of severe hypoxia (0.1% O2). ATP levels were normalized to protein content. Data are shown as a percentage of shGFP (green fluorescent protein) (mean ± SEM, n = 3). (C) Ratio of NAD+/NADH in 8988T cells (left) and MIAPaCa-2 cells (right) on loss of COX7A2L after 8 h of severe hypoxia (0.1% O2) (mean ± SD, n = 3). (D) Relative TMRE fluorescence in 8988T cells on knockdown of COX7A2L in normoxia and severe hypoxia (0.1% O2). TMRE values were normalized to mitochondrial size and FCCP treatment. 12–22 fields recorded per condition. (E) Aspartate production flux in 8988T cells with loss of COX7A2L in normoxia and severe hypoxia (0.1% O2) quantified using [U]-13C5 glutamine (mean ± 95% CI, n = 3). (F) Relative cell number of 8988T, MIAPaCa-2, PANC-1, HPAC, and 8902 cells with knockdown of COX7A2L after 5 days in normoxic or severely hypoxic (0.1% O2) conditions. Data are shown relative to shGFP control (mean ± SEM, n ≥ 3). (G) Percentage of change in cellular growth of 8988T cells (left) and MIAPaCa-2 cells (right) with loss of COX7A2L (vehicle) treated with exogenous pyruvate (0.25 mM) or mitoTempo (20 μM) for 5 days in severe hypoxia (0.1% O2). Data are shown relative to shGFP (mean ± SEM, n > 3). (H) Schematic illustrating the metabolic consequences from loss of supercomplex formation in hypoxic pancreatic cancer cells. Intact supercomplexes (left) and loss of supercomplexes (right) are demonstrated using the respirasome (complexes I, III2, and IV). Significance was determined using Dunnett’s multiple comparison test in (B)–(G), where n.s. ≥ 0.05, *p < 0.05, **p < 0.01, and ***p < 0.001.
Figure 5.
Figure 5.. Respiratory Efficiency through Supercomplex Assembly Is Important for In Vivo Growth
(A) Measurements to determine tumor volume were recorded to assess tumor growth after 2 × 10⁶ 8988T cells with loss of COX7A2L were implanted subcutaneously (mean SEM, n ≥ 8 per group, p = 0.015 at day 93). (B) Tumor weight was measured at the endpoint (mean SEM, n ≥ 8 per group, p = 0.021 at day 93). (C) Measurements to determine tumor volume were recorded to assess tumor growth after 2 × 10⁶ MIAPaCa-2 cells with loss of COX7A2L were implanted subcutaneously (mean SEM, n ≥ 7 per group, p = 0.0059 at day 24). (D) Tumor weight was measured at the endpoint (mean SEM, n ≥ 7 per group, p = 0.0302 at day 24). (E) Relative cell number after 5 days of proliferation at 1% oxygen in MIAPaCa-2 cells expressing empty vector (EV) or AOX on loss of COX7A2L (mean ± SEM, n = 5, p = 0.0223). (F) Measurements to determine tumor volume were recorded to assess tumor growth after 2 × 10⁶ MIAPaCa-2 cells expressing EV or AOX on loss of COX7A2L were implanted subcutaneously (mean SEM, n ≥ 9 per group, p = 0.0271 at day 18). (G) Tumor weight was measured at the endpoint from two independent experiments (mean SEM, n ≥ 14 per group, p = 0.0147). (H) Tumor aspartate levels quantified by gas chromatography-mass spectrometry (GC-MS) from 5 mg of tissue harvested at day 12 (mean SEM, n = 5, p = 0.0116). (I) Schematic demonstrating how AOX-expressing pancreatic cancer cells rescue the metabolic and proliferative defects associated with loss of supercomplex formation in hypoxic pancreatic cancer cells. Significance was determined using Dunnett’s multiple comparison test in (A)–(G), where n.s. ≥ 0.05, *p < 0.05, **p < 0.01, ***p < 0.001, and ****p ≤ 0.0001.

References

    1. Ameri K, Jahangiri A, Rajah AM, Tormos KV, Nagarajan R, Pekmezci M, Nguyen V, Wheeler ML, Murphy MP, Sanders TA, et al. (2015). HIGD1A Regulates Oxygen Consumption, ROS Production, and AMPK Activity during Glucose Deprivation to Modulate Cell Survival and Tumor Growth. Cell Rep. 10, 891–899. - PMC - PubMed
    1. An H, Ordureau A, Paulo JA, Shoemaker CJ, Denic V, and Harper JW (2019). TEX264 Is an Endoplasmic Reticulum-Resident ATG8-Interacting Protein Critical for ER Remodeling during Nutrient Stress. Mol. Cell 74, 891–908.e10. - PMC - PubMed
    1. Ast T, and Mootha VK (2019). Oxygen and mammalian cell culture: are we repeating the experiment of Dr. Ox? Nat. Metab 1, 858–860. - PubMed
    1. Bahr JT, and Bonner WD Jr. (1973a). Cyanide-insensitive respiration. I. The steady states of skunk cabbage spadix and bean hypocotyl mitochondria. J. Biol. Chem 248, 3441–3445. - PubMed
    1. Bahr JT, and Bonner WD Jr. (1973b). Cyanide-insensitive respiration. II. Control of the alternate pathway. J. Biol. Chem 248, 3446–3450. - PubMed

Publication types

MeSH terms