. 2020 Oct 6;32(4):561-574.e7.
doi: 10.1016/j.cmet.2020.09.012.

Exposure to Static Magnetic and Electric Fields Treats Type 2 Diabetes

Affiliations

Exposure to Static Magnetic and Electric Fields Treats Type 2 Diabetes

Calvin S Carter et al. Cell Metab. .

Erratum in

  • Exposure to Static Magnetic and Electric Fields Treats Type 2 Diabetes.
    Carter CS, Huang SC, Searby CC, Cassaidy B, Miller MJ, Grzesik WJ, Piorczynski TB, Pak TK, Walsh SA, Acevedo M, Zhang Q, Mapuskar KA, Milne GL, Hinton AO Jr, Guo DF, Weiss R, Bradberry K, Taylor EB, Rauckhorst AJ, Dick DW, Akurathi V, Falls-Hubert KC, Wagner BA, Carter WA, Wang K, Norris AW, Rahmouni K, Buettner GR, Hansen JM, Spitz DR, Abel ED, Sheffield VC. Carter CS, et al. Cell Metab. 2020 Dec 1;32(6):1076. doi: 10.1016/j.cmet.2020.11.001. Cell Metab. 2020. PMID: 33264599 No abstract available.
  • Exposure to Static Magnetic and Electric Fields Treats Type 2 Diabetes.
    Carter CS, Huang SC, Searby CC, Cassaidy B, Miller MJ, Grzesik WJ, Piorczynski TB, Pak TK, Walsh SA, Acevedo M, Zhang Q, Mapuskar KA, Milne GL, Hinton AO Jr, Guo DF, Weiss R, Bradberry K, Taylor EB, Rauckhorst AJ, Dick DW, Akurathi V, Falls-Hubert KC, Wagner BA, Carter WA, Wang K, Norris AW, Rahmouni K, Buettner GR, Hansen JM, Spitz DR, Abel ED, Sheffield VC. Carter CS, et al. Cell Metab. 2022 Nov 1;34(11):1893. doi: 10.1016/j.cmet.2022.10.003. Cell Metab. 2022. PMID: 36323238 No abstract available.

Abstract

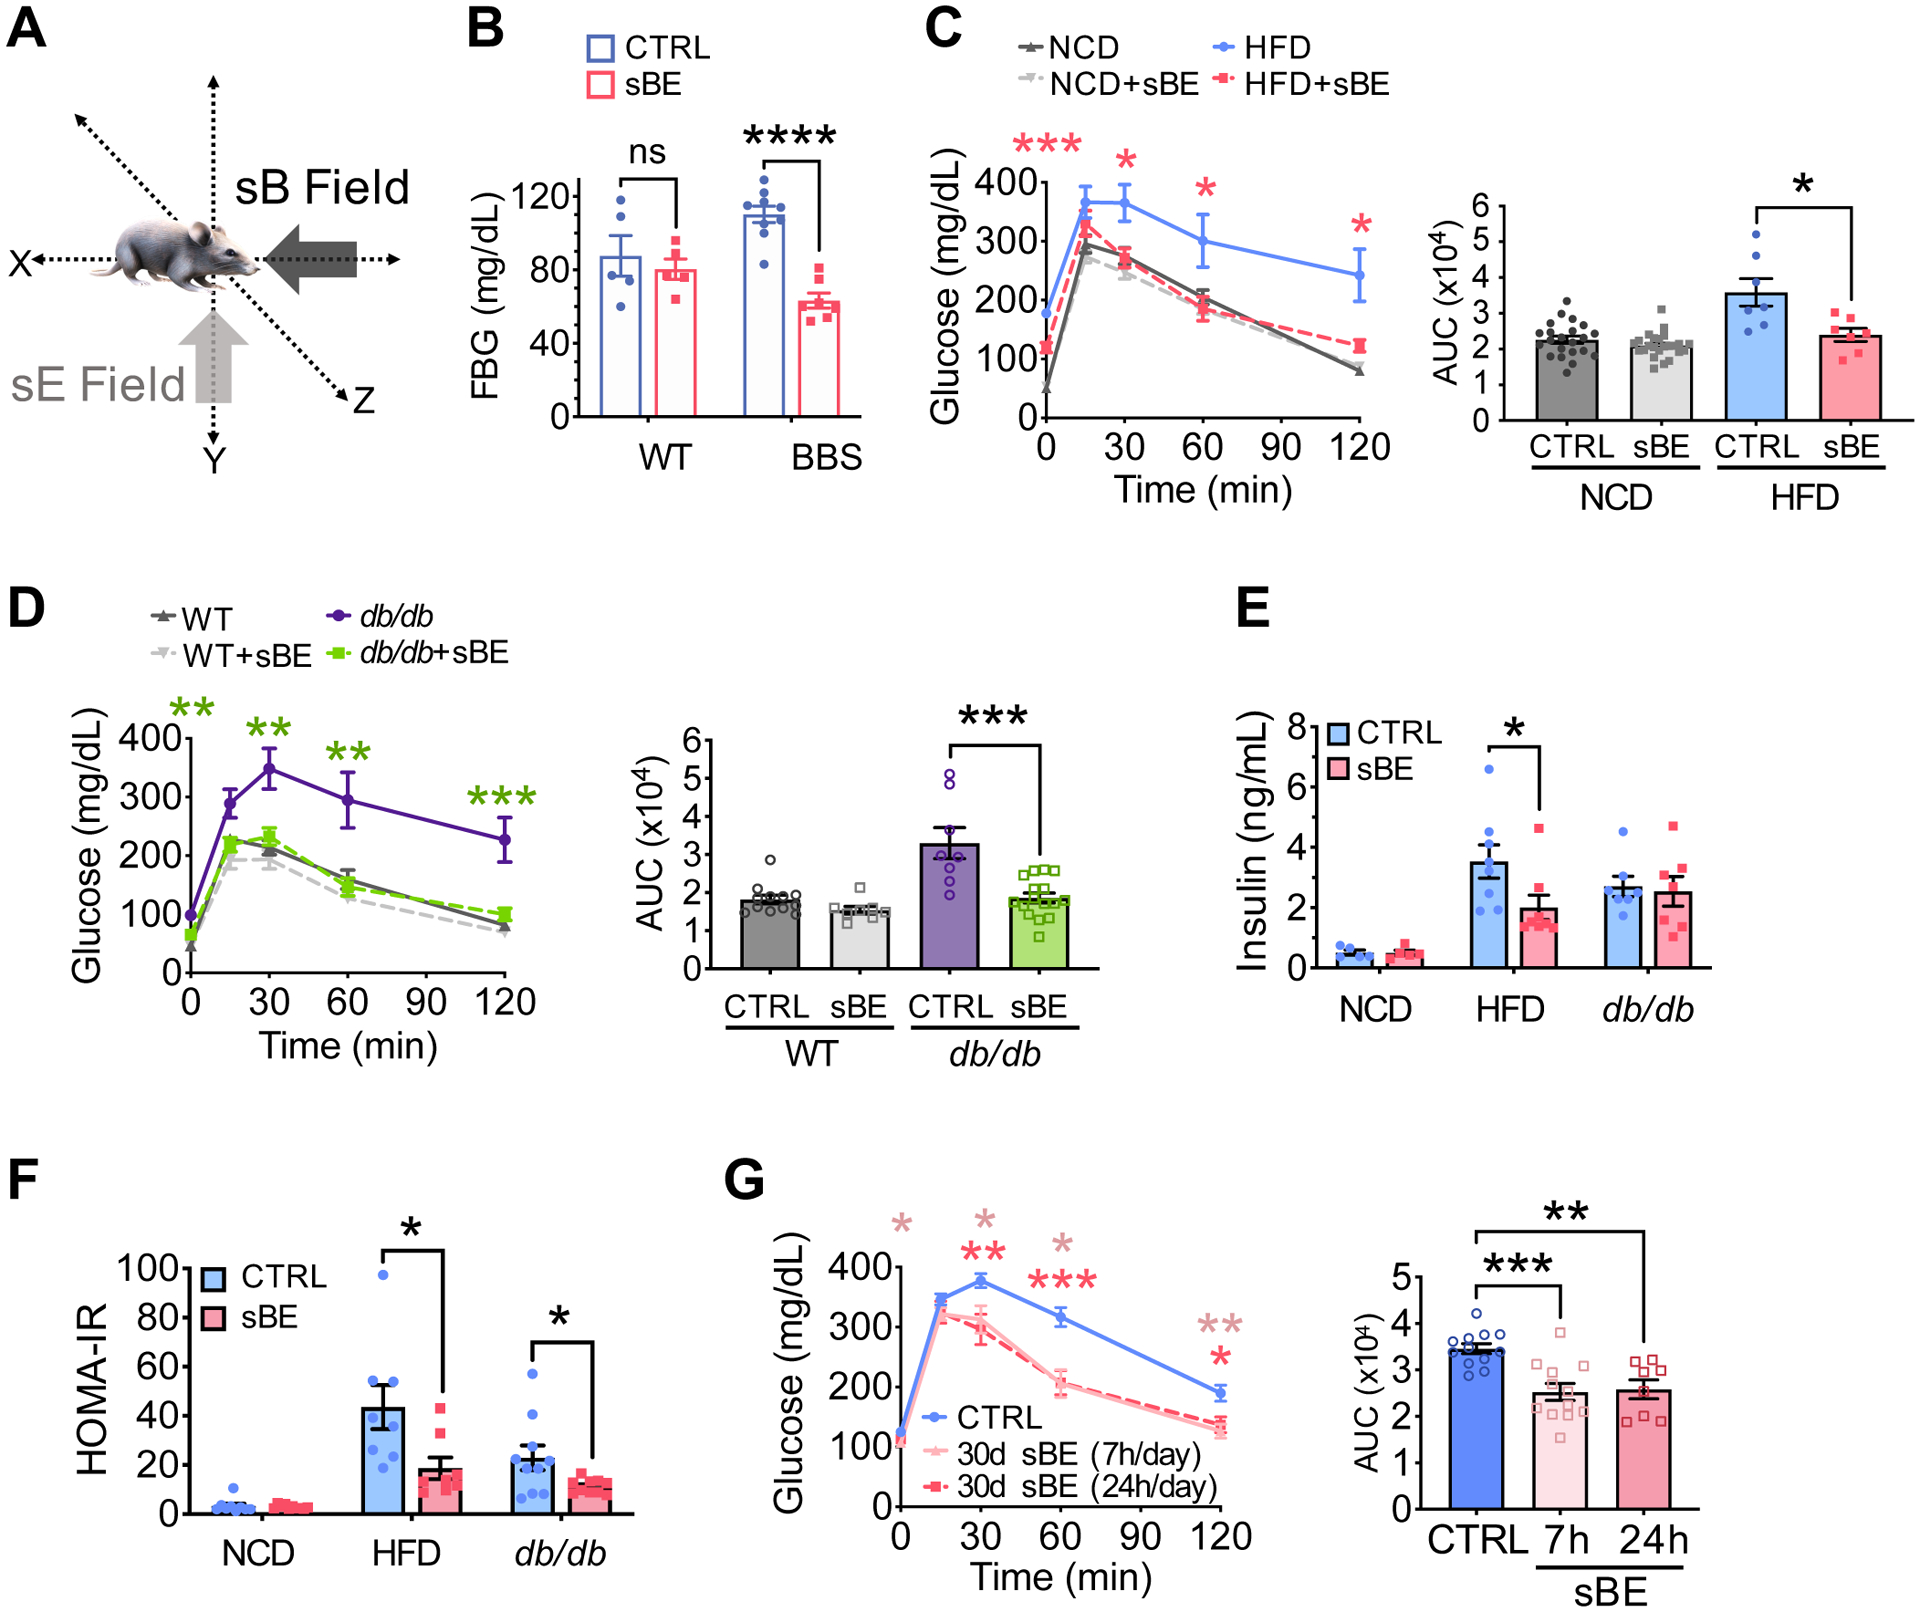
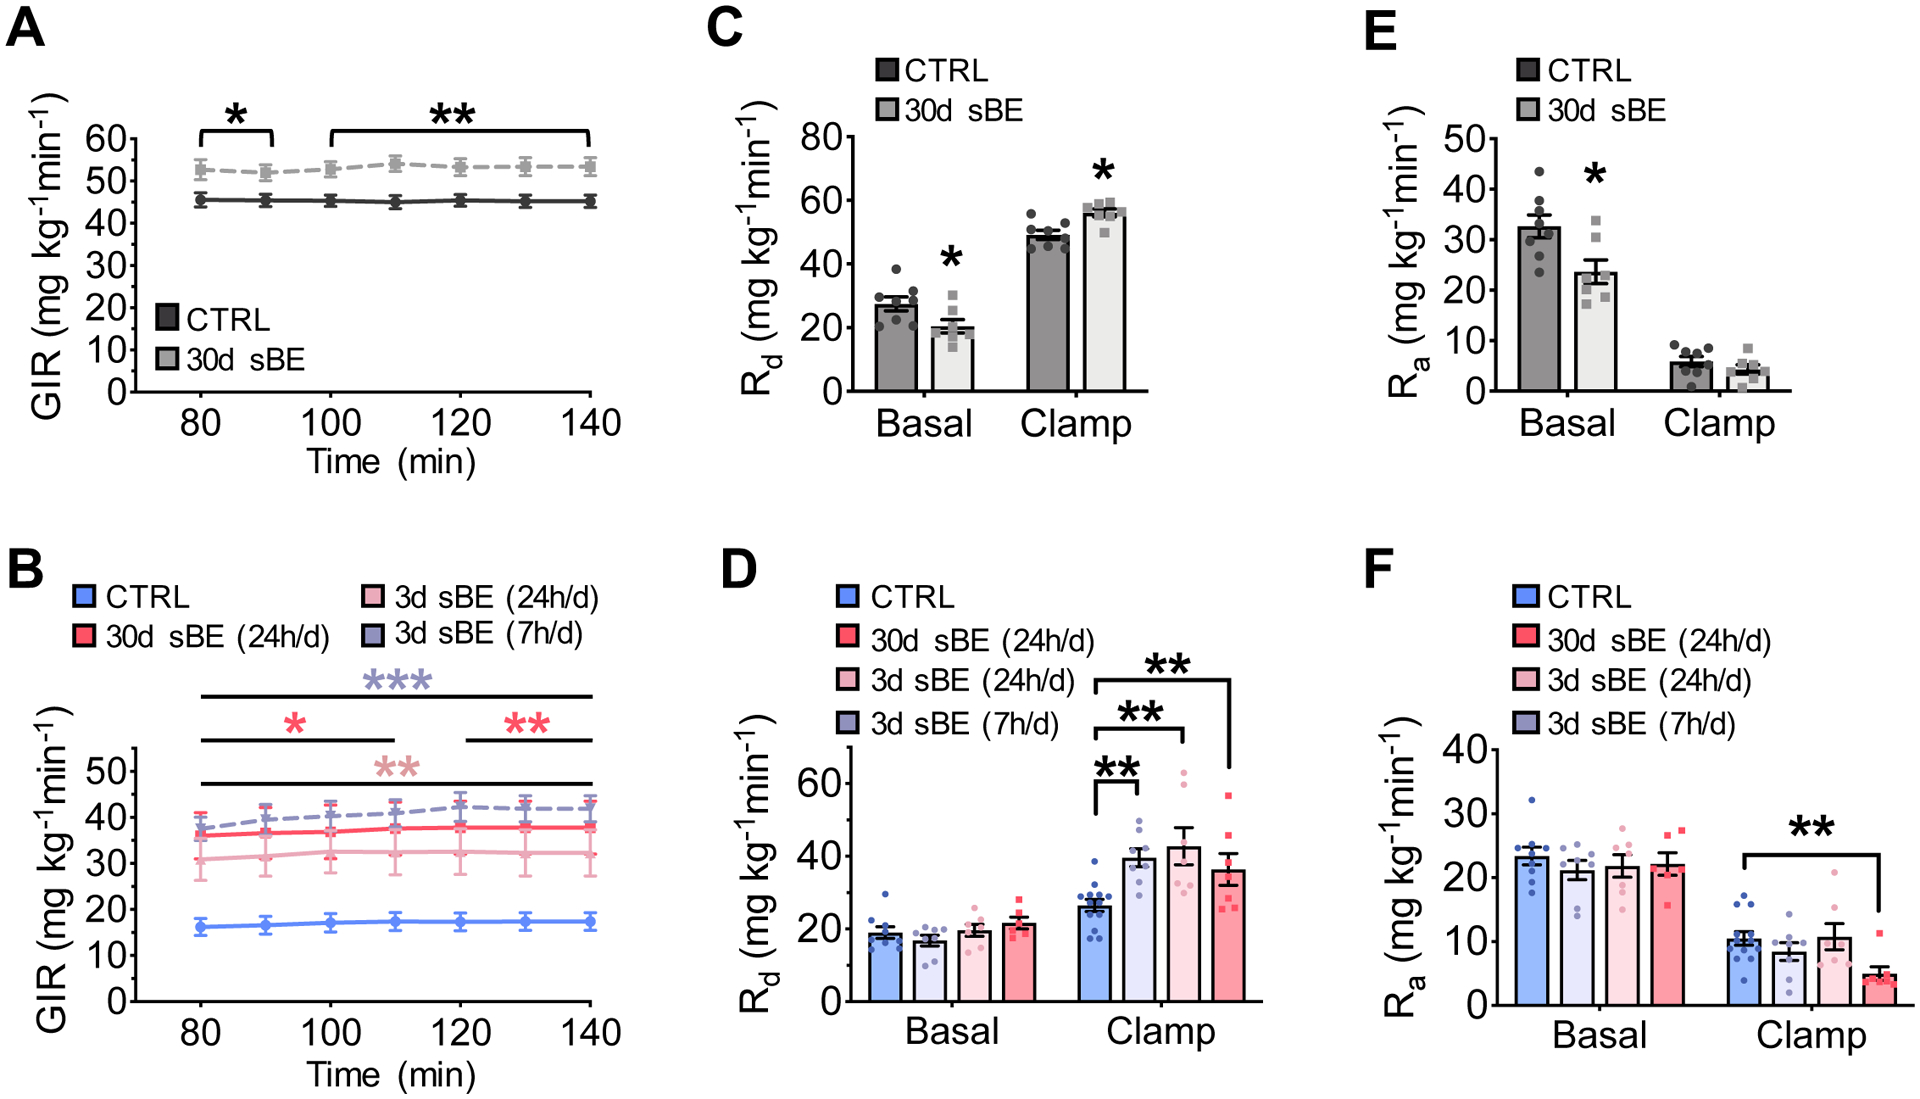
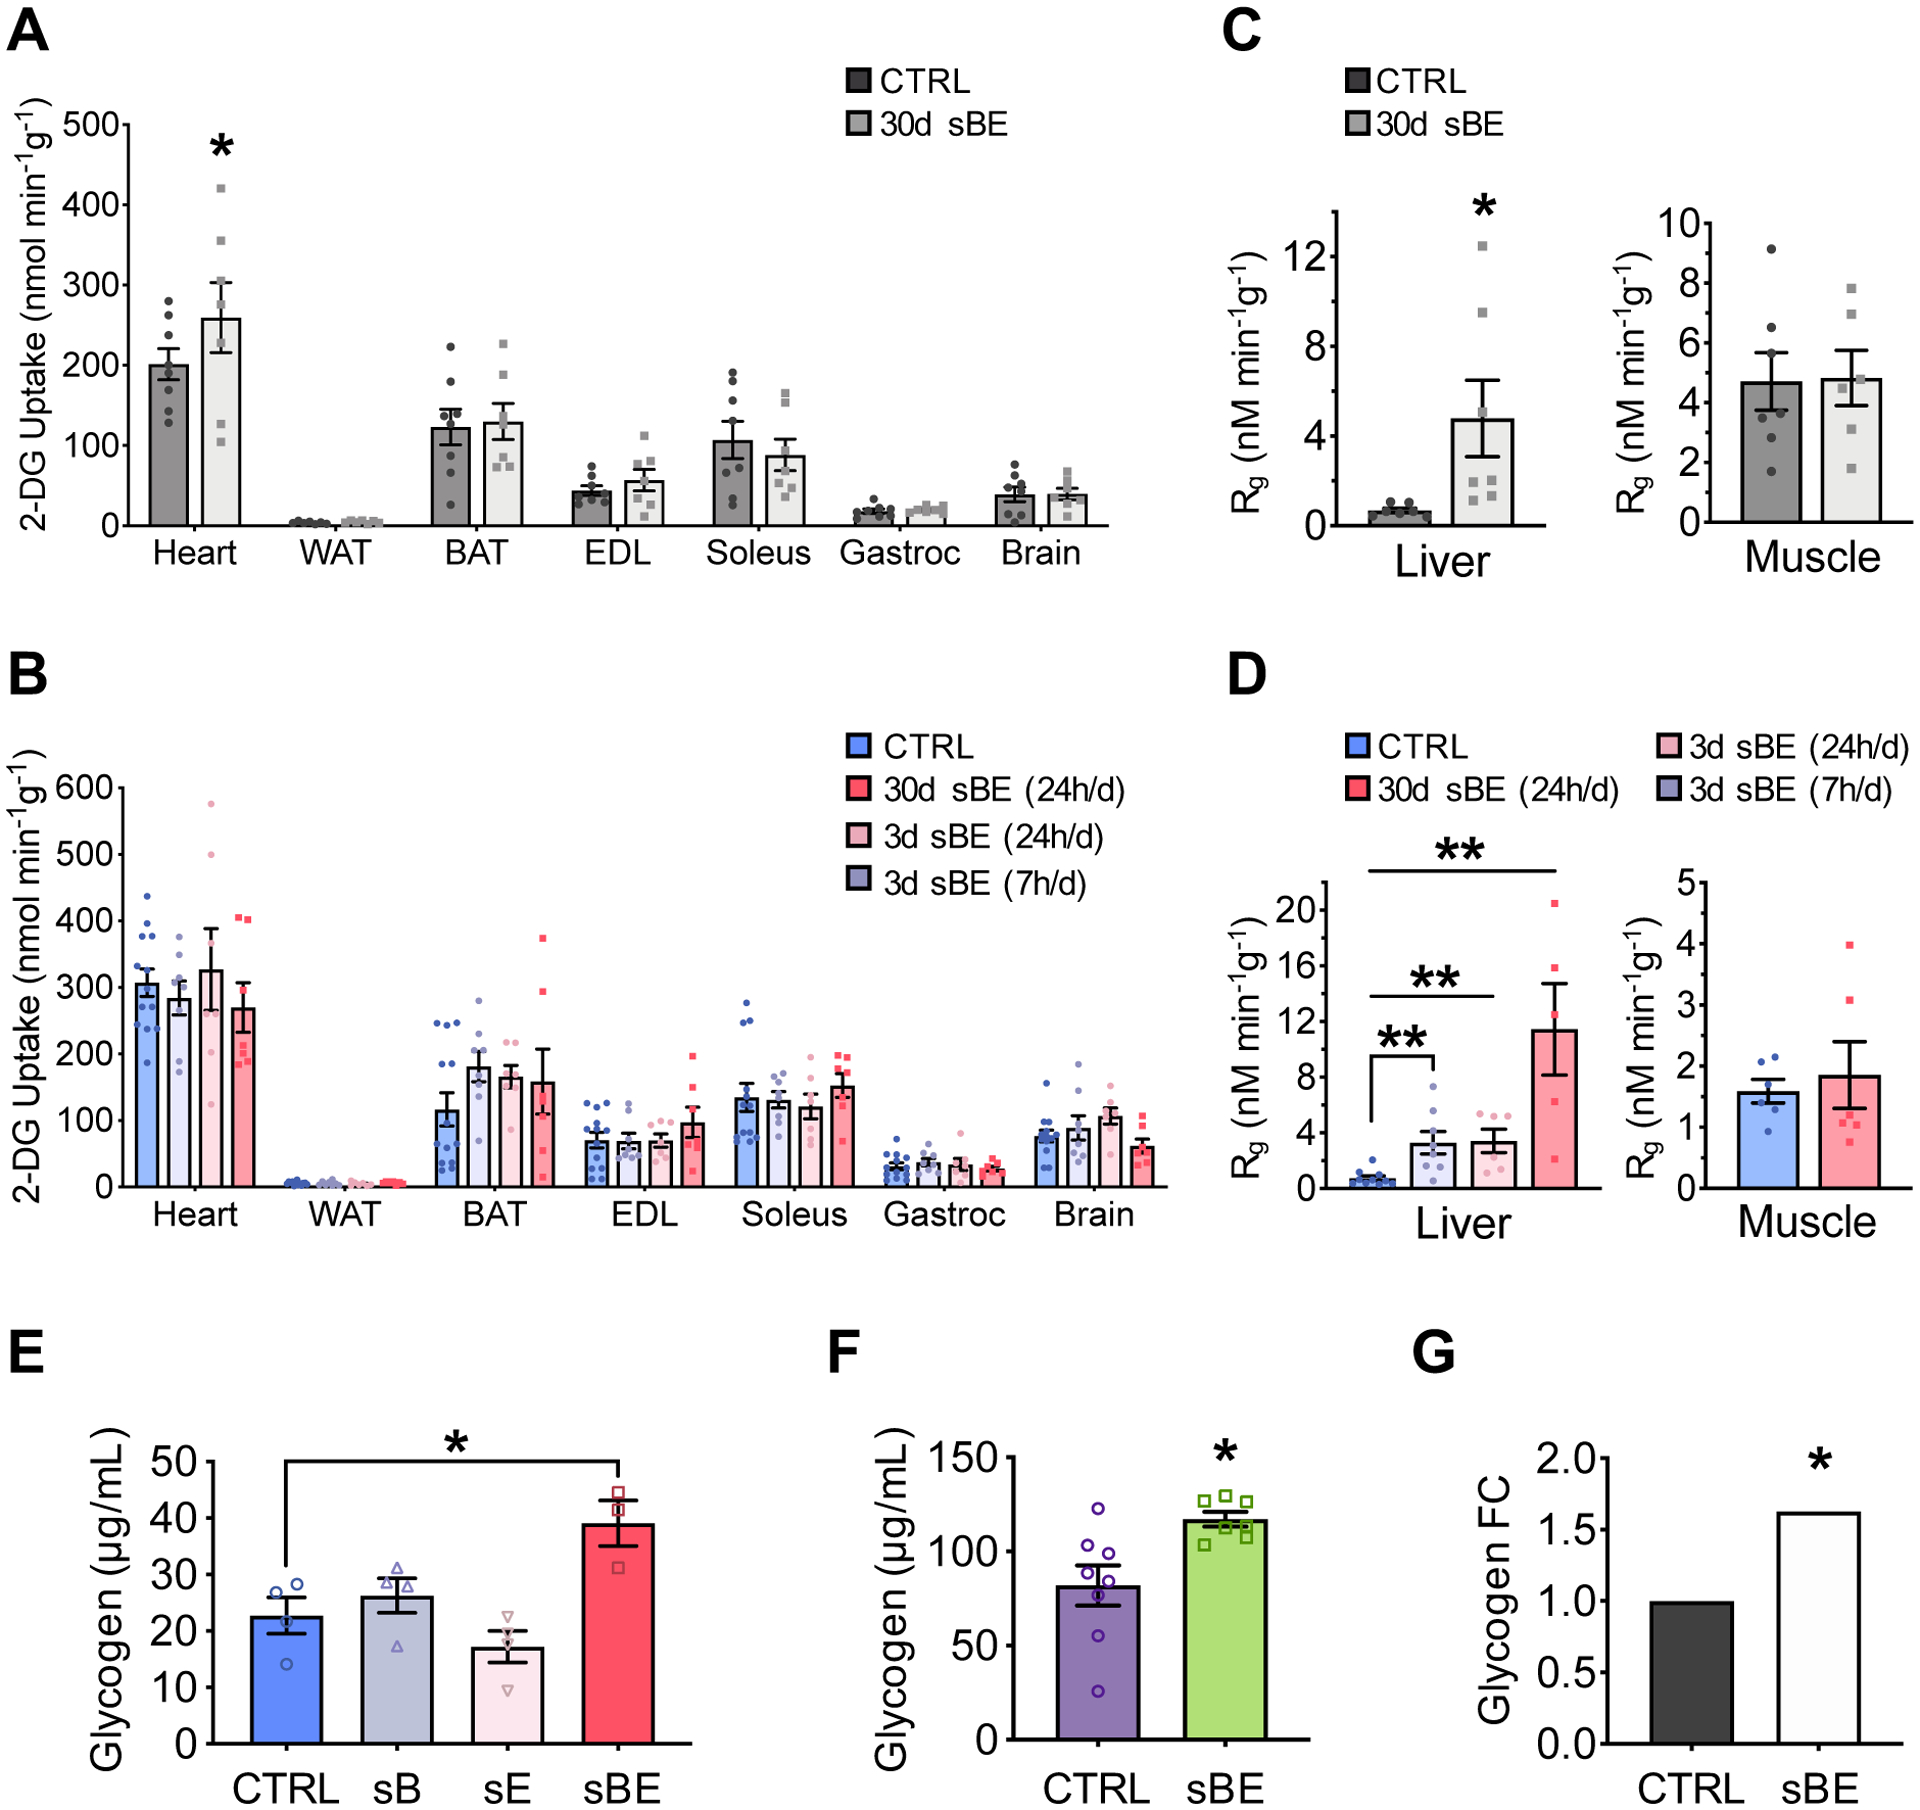
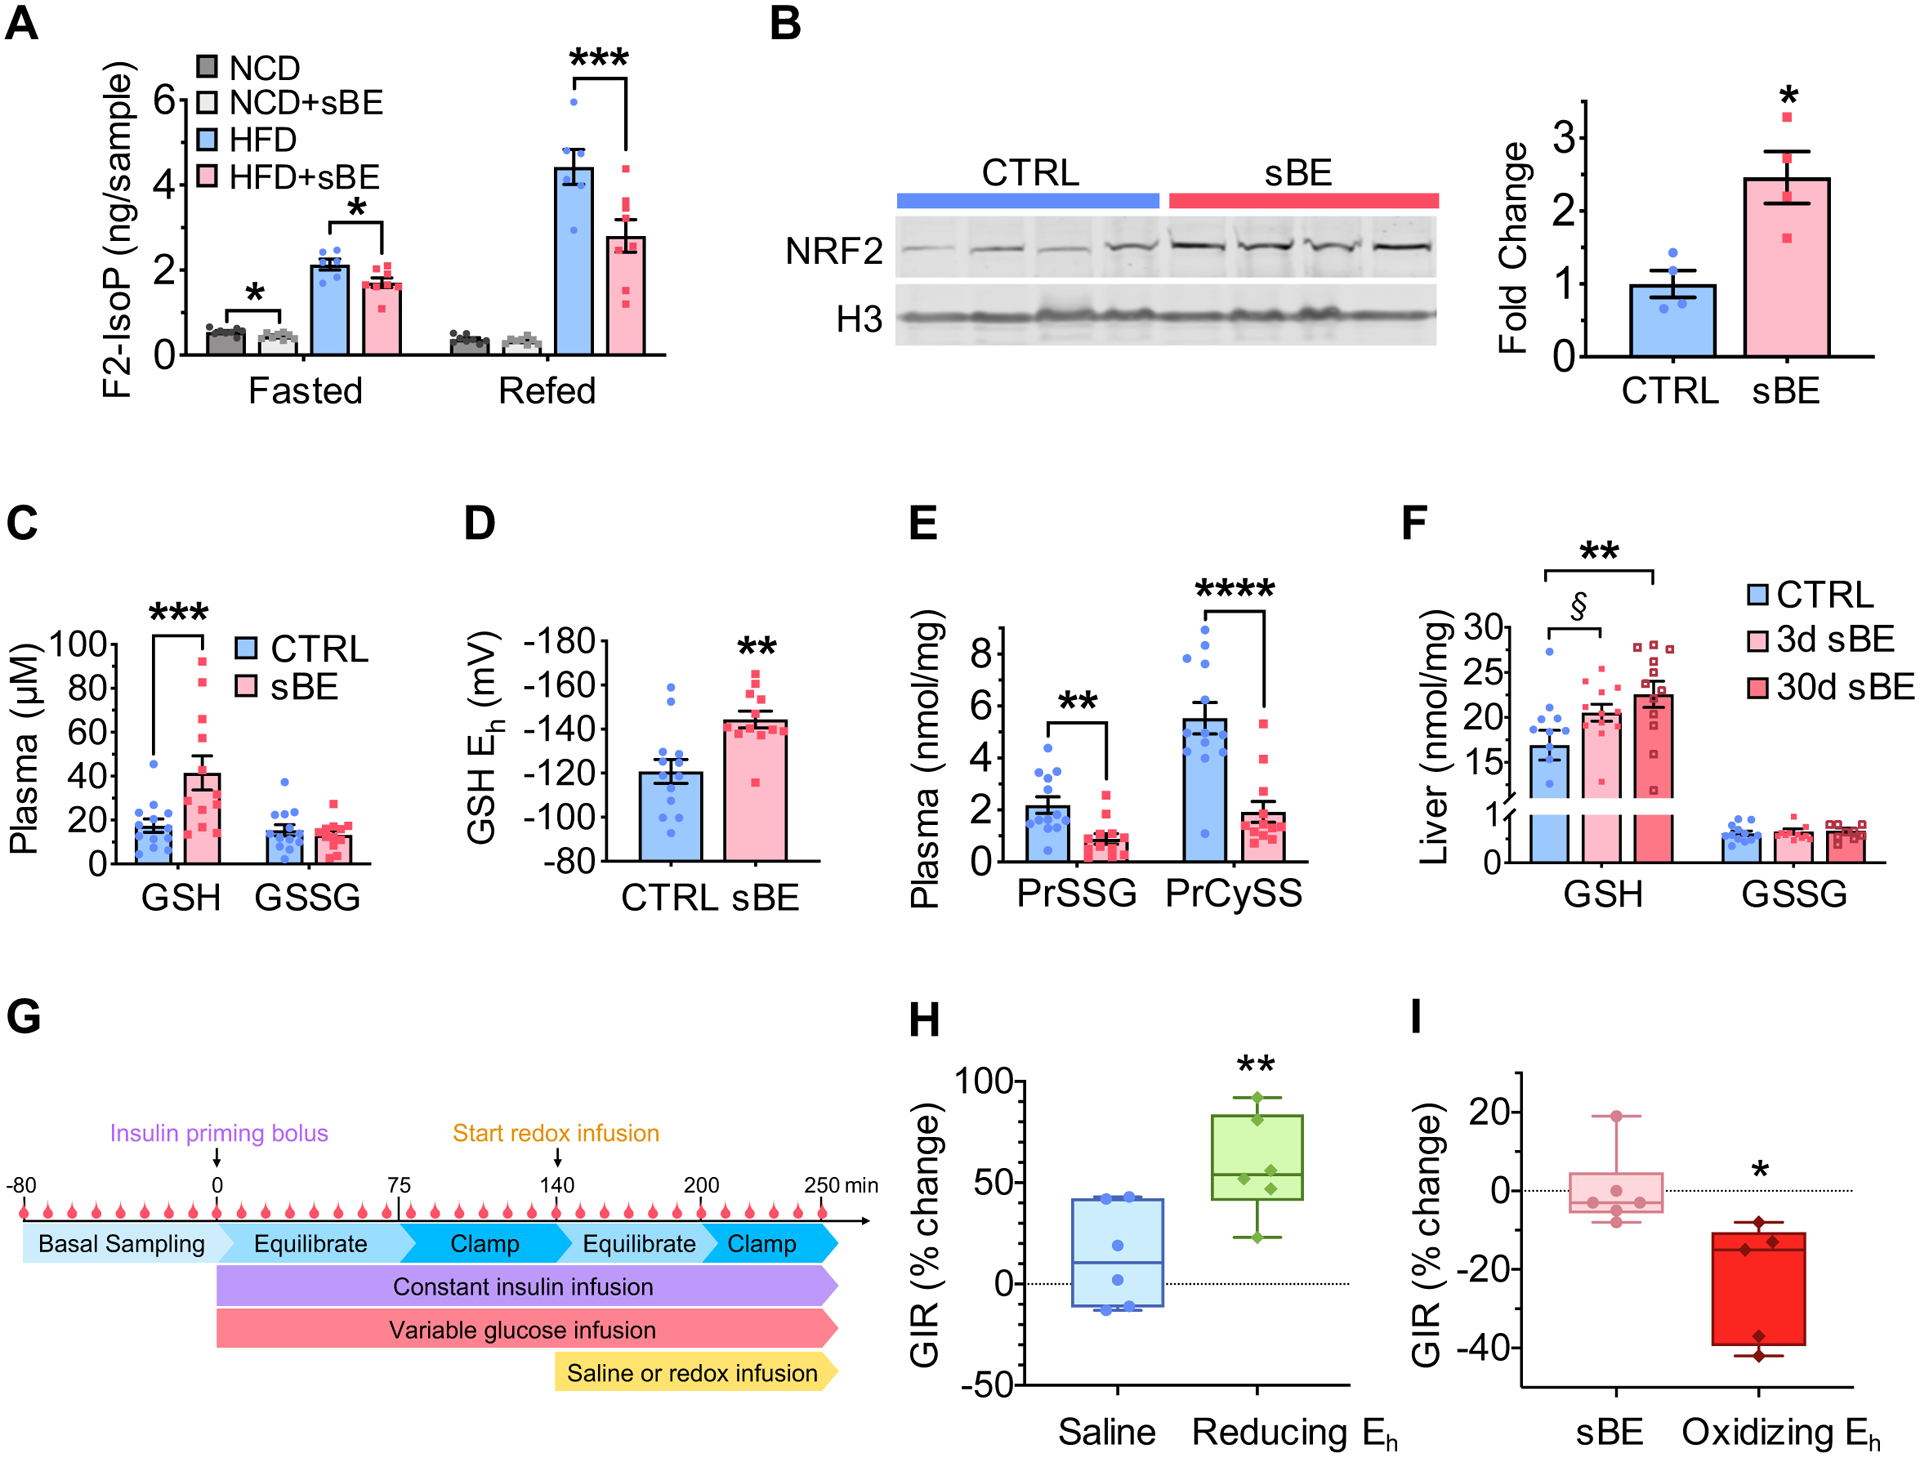
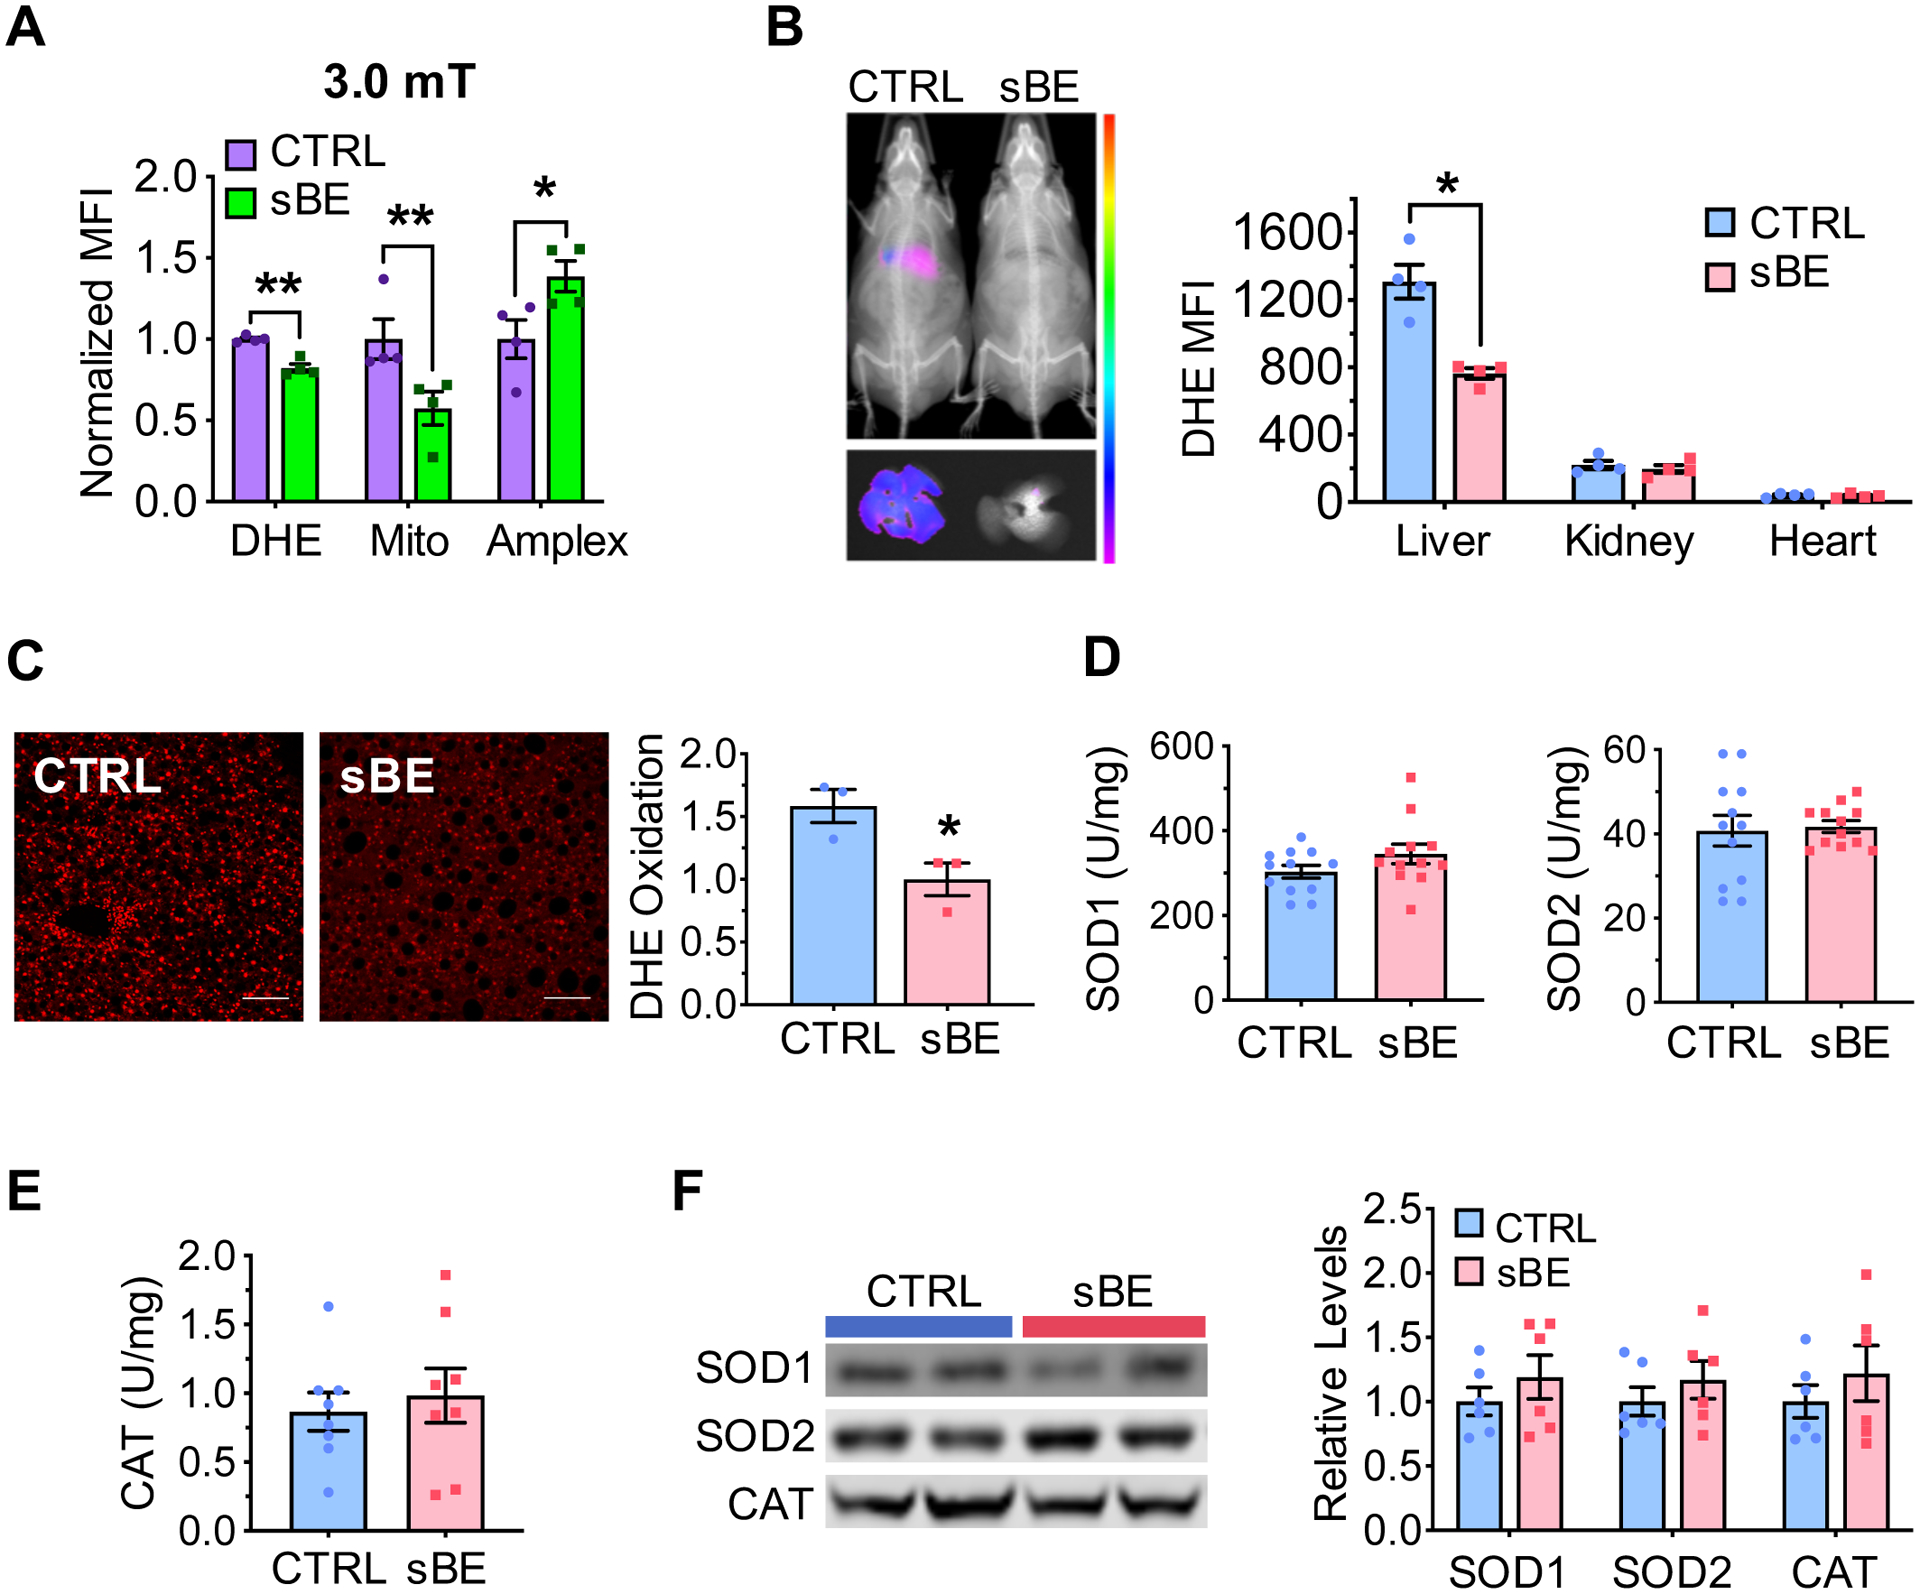
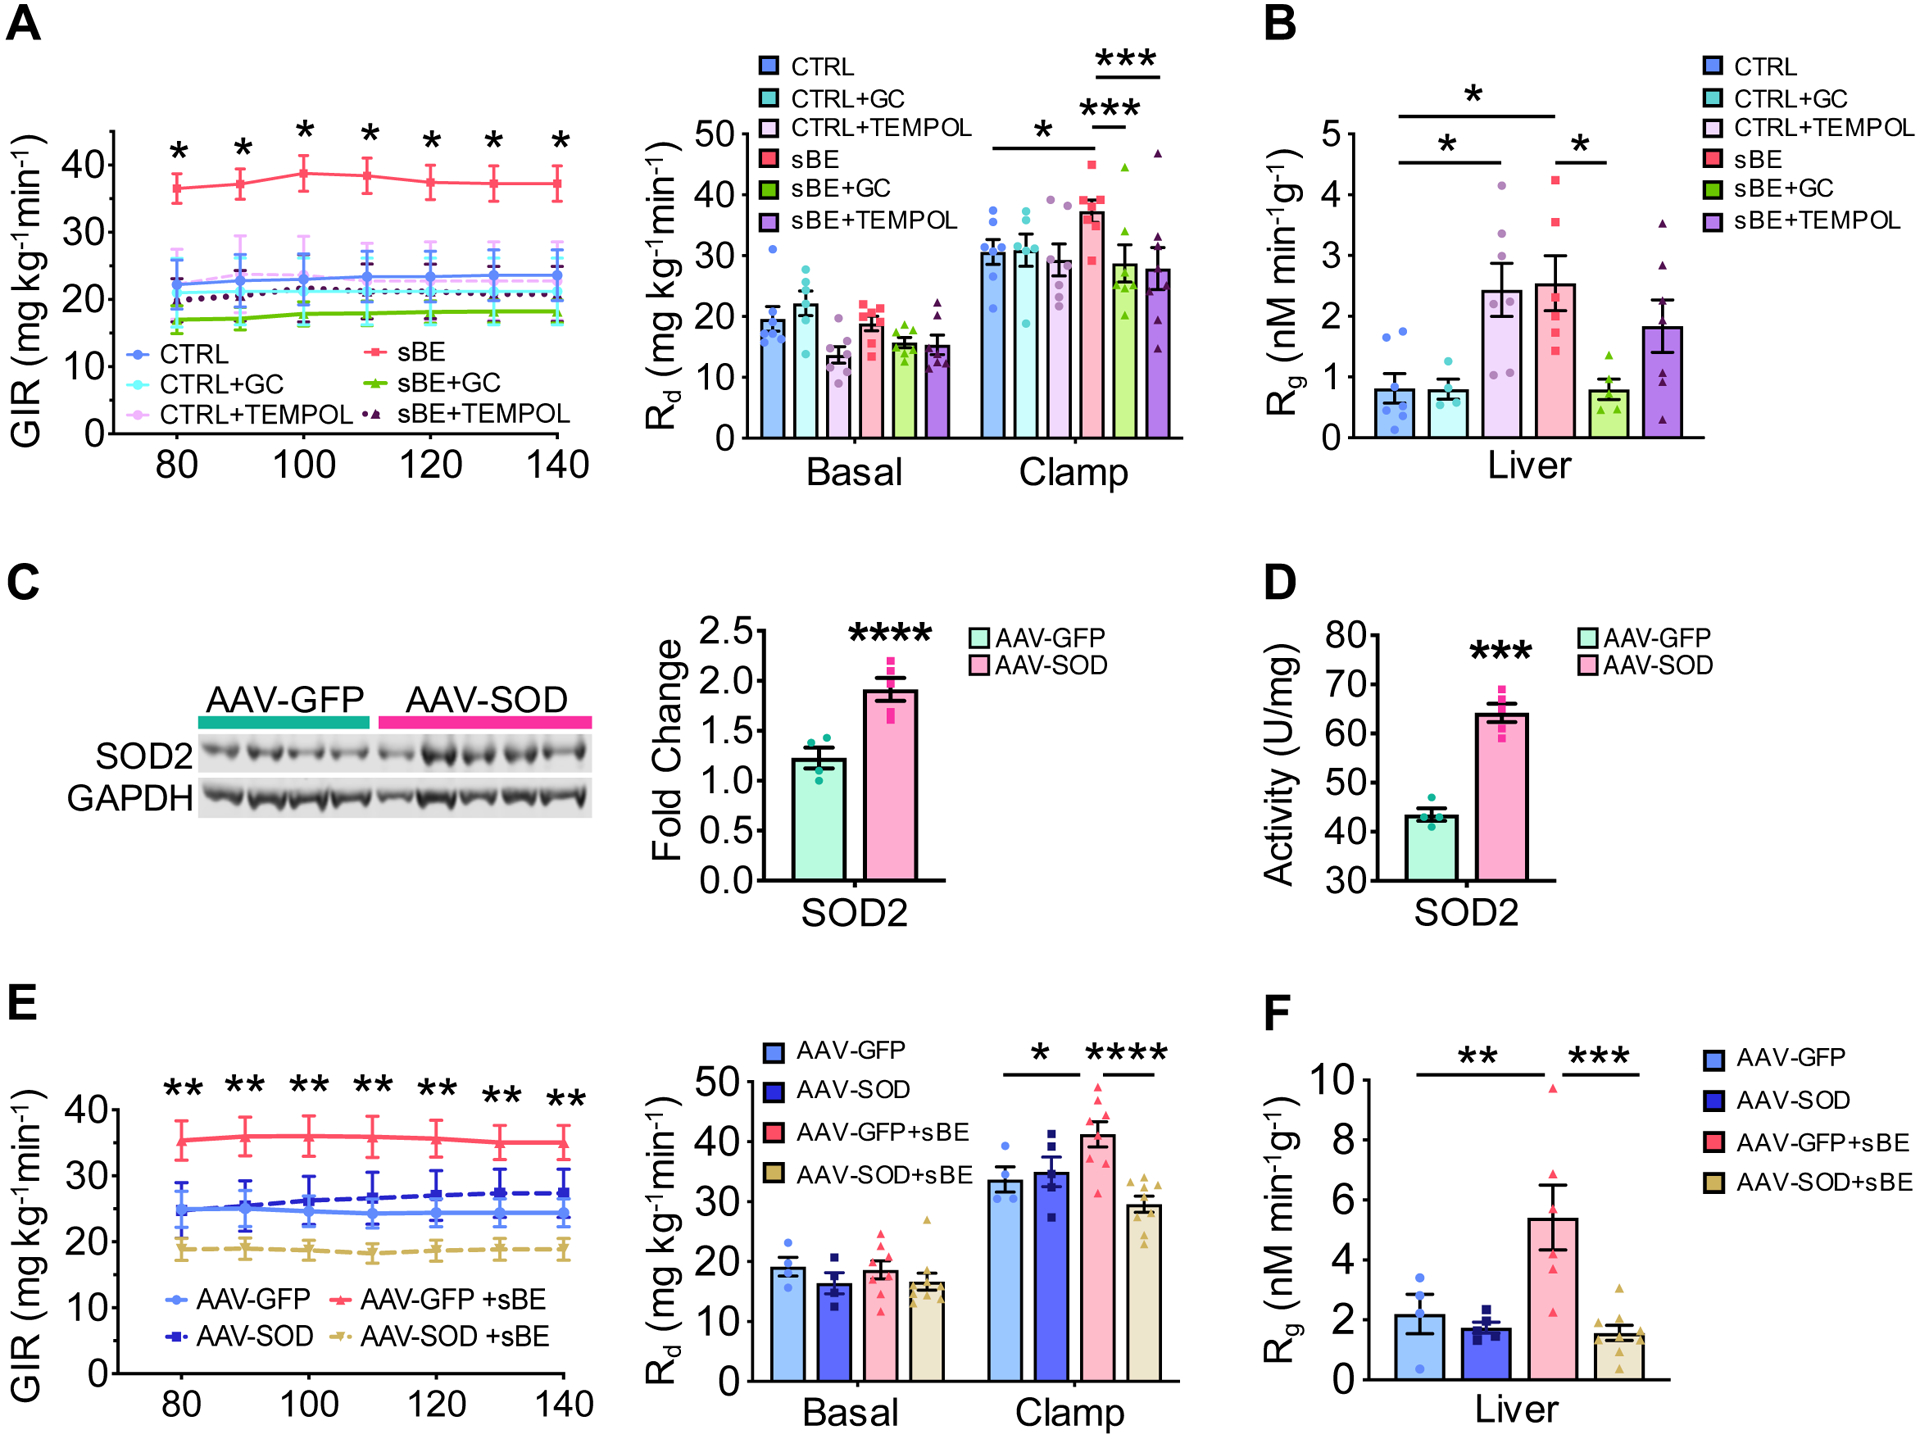
Aberrant redox signaling underlies the pathophysiology of many chronic metabolic diseases, including type 2 diabetes (T2D). Methodologies aimed at rebalancing systemic redox homeostasis have had limited success. A noninvasive, sustained approach would enable the long-term control of redox signaling for the treatment of T2D. We report that static magnetic and electric fields (sBE) noninvasively modulate the systemic GSH-to-GSSG redox couple to promote a healthier systemic redox environment that is reducing. Strikingly, when applied to mouse models of T2D, sBE rapidly ameliorates insulin resistance and glucose intolerance in as few as 3 days with no observed adverse effects. Scavenging paramagnetic byproducts of oxygen metabolism with SOD2 in hepatic mitochondria fully abolishes these insulin sensitizing effects, demonstrating that mitochondrial superoxide mediates induction of these therapeutic changes. Our findings introduce a remarkable redox-modulating phenomenon that exploits endogenous electromagneto-receptive mechanisms for the noninvasive treatment of T2D, and potentially other redox-related diseases.

Keywords: ROS; electromagnetic fields; glutathione; insulin resistance; liver; mitochondria; radical pair mechanism; redox; superoxide; type 2 diabetes.


Conflict of interest statement

Declaration of Interests C.S.C., S.C.H., V.C.S., C.C.S., and M.J.M. have patents pending related to this work. C.S.C., S.C.H., and W.A.C. are founders of Geminii, Inc. D.R.S. has a Sponsored Research Agreement with Galera Therapeutics.

Figures

Figure 1.
Figure 1.. sBE exposure improves glucose tolerance.
(A) Illustration of static magnetic (sB) and vertically oriented electrostatic fields (sE), in combination termed sBE. (B) Fasting blood glucose (FBG) levels after a 16 h fast in Bardet-Biedl Syndrome (BBS) mice and their wildtype (WT) littermates after 30 days of sBE exposure (WT mice, n = 5/group; BBS mice, n ≥ 7/group). (C) Glucose tolerance test (GTT) and FBG shown as timepoint 0 min (left) and area under the curve (AUC) (right) for normal chow diet (NCD) and high fat diet (HFD) mice exposed to sBE for 30 days (NCD mice, n ≥ 22/group; HFD mice, n = 7/group). (D) GTT and FBG shown as timepoint 0 min (left) and area under the curve (AUC) (right) for WT and leptin-receptor deficient mice (db/db) exposed to sBE for 30 days (n ≥ 8 mice/group). (E) Plasma insulin levels after a 16 h fast in NCD, HFD, and db/db mice exposed to sBE for 30 days (n ≥ 8 mice/group). (F) Homeostatic Model Assessment of Insulin Resistance (HOMA-IR) of NCD, HFD, and db/db mice exposed to sBE for 30 days (n ≥ 8 mice/group). (G) GTT and FBG (left) and area under the curve (AUC) (right) for HFD mice exposed to 30 days of sBE for 7 h per day or 24 h per day (n ≥ 8 mice/group). Data presented as mean ± SEM. Data panels (A–F) analyzed by two-tailed, unpaired t-test. Data panel (G) analyzed by one-way ANOVA with Tukey’s correction for multiple comparisons. ns = not significant. *P < 0.05, **P < 0.01, ***P < 0.001, ****P < 0.0001.
Figure 2.
Figure 2.. sBE exposure enhances insulin sensitivity.
(A–F) Euglycemic-hyperinsulinemic clamps were performed on NCD and HFD mice exposed to sBE following a 6 h fast. (A) Glucose infusion rate (GIR) in NCD mice exposed to 30 days of continuous sBE (n ≥ 7 mice/group). (B) GIR in HFD mice exposed to sBE continuously (24 h/day) for 30 days, continuously (24 h/day) for 3 days, or for 7 h/day for a total of 3 days (n ≥ 7mice/group). (C) Rate of glucose disposal (Rd) in NCD mice (n ≥ 7mice/group). (D) Rd in HFD mice (n ≥ 7mice/group). (E) Rate of glucose appearance (Ra) in NCD mice (n ≥ 7mice/group). (F) Ra in HFD mice (n ≥ 7mice/group). Data presented as mean ± SEM. NCD mice data analyzed by two-tailed, unpaired Student’s t-test. HFD mice data analyzed by one-way ANOVA with Dunnett’s correction for multiple comparisons. *P < 0.05, **P < 0.01, ***P < 0.001.
Figure 3.
Figure 3.. sBE exposure enhances glucose incorporation into liver glycogen.
(A–D) Euglycemic-hyperinsulinemic clamped conditions. (A,B) 14C-2-deoxyglucose uptake into tissues in: (A) NCD mice (n ≥ 7/group) and (B) HFD mice (n ≥ 7/group). (C,D) 14C-2-deoxyglucose incorporation into liver and muscle glycogen in (C) NCD mice (n ≥ 7/group) and (D) HFD mice (n ≥ 6/group). (E) Total liver glycogen levels in HFD mice treated with static magnetic fields (sB), static electric fields (sE), or both static magnetic and electric fields (sBE) for 25 days (n ≥ 7/group). (F) Total liver glycogen levels in db/db mice treated with sBE for 30 days (n ≥ 7/group). (G) Glycogen produced by primary human hepatocytes after 6 hours of sBE exposure presented as fold change (n = 5 biological replicates across 5 different days). Data presented as mean ± SEM. Data panels (A), (C), and (F) analyzed by two-tailed, unpaired Student’s t-test. Data panels (B–E) analyzed by one-way ANOVA with Dunnett’s correction for multiple comparisons. Data panel (G) analyzed by mixed effects modeling. *P < 0.05, **P < 0.01.
Figure 4.
Figure 4.. sBE exposure alters the systemic redox state to enhance the insulin response.
(A) Plasma F2-isoprostanes in 3 day sBE-exposed NCD- and HFD mice fasted for 16 h and refed for 4 h (n = 8 mice/group). (B) Western blot image (left) and quantification (right) of 3-day sBE-exposed HFD mouse liver nuclear fractions NRF2 normalized to histone 3 (H3) (n = 4 mice/group). (C–E) Measurements of analytes in plasma collected from control HFD mice and 3 day sBE-exposed HFD mice. (C) Plasma concentration of glutathione (GSH) and glutathione disulfide (GSSG) (n ≥ 12 mice/group). (D) Half-cell reduction potential of GSH in plasma (n ≥ 12 mice/group). (E) Protein glutathionylation (PrSSG) and protein cysteinylation (PrCySS) in plasma (n ≥ 12 mice/group). (F) Livers were collected from 3 day and 30 day sBE-exposed HFD mice and assessed for GSH and GSSG presented as a concentration (nmol per mg of protein) (n ≥ 10 mice/group). §P = 0.07. **P < 0.01 (G) Schematic of euglycemic-hyperinsulinemic clamp procedure with the infusion of a reducing or oxidizing redox solution. (H–I) Euglycemic-hyperinsulinemic clamp paired studies performed on HFD mice. (H) Percent change in glucose infusion rate (GIR) of untreated HFD mice basally clamped at 150 mg/dL plasma glucose and then re-clamped at this concentration during an infusion of saline or a reducing solution of GSH/GSSG (reducing Eh) (Saline infusion, n = 6 mice; Reducing Eh infusion, n = 6 mice). (I) Percent change in GIR from 3 day sBE-exposed HFD mice basally clamped at 150 mg/dL plasma glucose and then re-clamped at this concentration during an infusion of saline or an oxidizing solution of GSH/GSSG (oxidizing Eh) (sBE-exposed with saline infusion, n ≥ 5 mice; sBE-exposed with oxidizing Eh infusion, n ≥ 5 mice). Data presented as mean ± SEM. Data panels (A) and (F) analyzed by with Sidak’s multiple comparison t-tests. Data panels (B–E) analyzed by two-tailed, unpaired Student’s t-test. Data panels (H) and (I) analyzed by two-tailed, paired Student’s t-test. *P < 0.05, **P < 0.01, ***P < 0.001, ****P < 0.0001.
Figure 5.
Figure 5.. sBE exposure alters ROS homeostasis without altering ROS enzyme function.
(A) Normalized mean fluorescent intensity (MFI) of dihydroethidium (DHE), MitoSox (Mito), and Amplex Red (Amplex) in Hepa1–6 cells exposed to 3.0 mT sBE (n = 4 biological replicates/group). (B) Representative images (left) of DHE oxidation in 3 day sBE-exposed HFD mice in vivo, whole mouse (top) and liver (bottom) and MFI quantification (right) in liver, kidneys, and heart (n = 4 mice/group). (C) Representative images (left) of liver sections (scale, 100 μm) collected from HFD mice exposed to 3 days of sBE and stained with DHE and quantification (right) of the mean fluorescent intensity as a surrogate of DHE oxidation (n = 300 nuclei/mouse, n = 3 mice/group). (D–F) HFD mice were exposed to sBE for 3 days and assessed for ROS related liver enzyme function. (D) Liver superoxide dismutase 1 (SOD1) (left) and SOD2 activity (right) (n = 12 mice/group). (E) Liver catalase activity (n = 8 mice/group). (F) Western blot images (left) and quantifications (right) for protein expression of SOD1, SOD2, and catalase (CAT) in liver (n = 6/group). Data presented as mean ± SEM. Data panel (A) analyzed with Sidak’s multiple comparison t-tests. Data panel (B–F) analyzed by two-tailed, unpaired Student’s t-test. *P < 0.05, **P < 0.01.
Figure 6.
Figure 6.. Hepatic superoxide mediates the insulin sensitizing effects of sBE exposure.
(A–B) Euglycemic-hyperinsulinemic clamps were performed after a 6 h fast on HFD mice exposed concurrently to sBE for 3 days and a pharmacological superoxide dismutase mimetic, GC or TEMPOL. (A) GIRs (left) and glucose rate of disappearance (Rd) (right) (n ≥ 6 mice/group). (B) 14C-2-deoxyglucose incorporation into liver glycogen (n ≥ 6 mice/group). (C) Liver protein expression of SOD2 in HFD mice overexpressing liver-specific superoxide dismutase 2 (AAV-SOD) or control green fluorescent protein (AAV-GFP) (AAV-GFP, n = 4 mice; AAV-SOD, n = 5 mice). (D) Liver activity of SOD2 in AAV-GFP and AAV-SOD mice (AAV-GFP, n = 4 mice; AAV-SOD, n = 5 mice). (E–F) Euglycemic-hyperinsulinemic clamps were performed after a 6 h fast on AAV-SOD or AAV-GFP HFD mice after 3 days of sBE exposure. (E) GIRs (left) and Rd (right) (AAV-GFP, n = 4 mice; AAV-SOD, n = 5 mice; AAV-GFP+sBE, n = 8 mice; AAV-SOD+sBE, n = 9 mice). (F) 14C-2-deoxyglucose incorporation into liver glycogen (AAV-GFP, n = 4 mice; AAV-SOD, n = 5 mice; AAV-GFP+sBE, n = 8 mice; AAV-SOD+sBE, n = 9 mice). Data presented as mean ± SEM. Data panels (A–B) and (E–F) analyzed by two-way ANOVA with Sidak’s multiple comparisons. Data panels (C–D) analyzed by two-tailed, unpaired Student’s t-test. *P < 0.05, **P < 0.01, ***P < 0.001, ****P < 0.0001.

Comment in

References

    1. Aebi H (1984). Catalase in vitro. Methods Enzymol 105, 121–126. - PubMed
    1. Aksu U, Ergin B, Bezemer R, Kandil A, Milstein DMJ, Demirci-Tansel C, and Ince C (2015). Scavenging reactive oxygen species using tempol in the acute phase of renal ischemia/reperfusion and its effects on kidney oxygenation and nitric oxide levels. Intensive Care Med Exp 3, 57–57. - PMC - PubMed
    1. Anderson EJ, Lustig ME, Boyle KE, Woodlief TL, Kane DA, Lin CT, Price JW 3rd, Kang L, Rabinovitch PS, Szeto HH, et al. (2009). Mitochondrial H2O2 emission and cellular redox state link excess fat intake to insulin resistance in both rodents and humans. J Clin Invest 119, 573–581. - PMC - PubMed
    1. Ayala JE, Bracy DP, Malabanan C, James FD, Ansari T, Fueger PT, McGuinness OP, and Wasserman DH (2011). Hyperinsulinemic-euglycemic clamps in conscious, unrestrained mice. Journal of visualized experiments : JoVE, 3188. - PMC - PubMed
    1. Ayala JE, Bracy DP, McGuinness OP, and Wasserman DH (2006). Considerations in the Design of Hyperinsulinemic-Euglycemic Clamps in the Conscious Mouse. Diabetes 55, 390. - PubMed

Publication types

Substances