. 2020 Dec:94:110-133.
doi: 10.1016/j.matbio.2020.09.003. Epub 2020 Oct 4.

Sox9 deletion causes severe intervertebral disc degeneration characterized by apoptosis, matrix remodeling, and compartment-specific transcriptomic changes

Affiliations

Sox9 deletion causes severe intervertebral disc degeneration characterized by apoptosis, matrix remodeling, and compartment-specific transcriptomic changes

Maria Tsingas et al. Matrix Biol. 2020 Dec.

Abstract

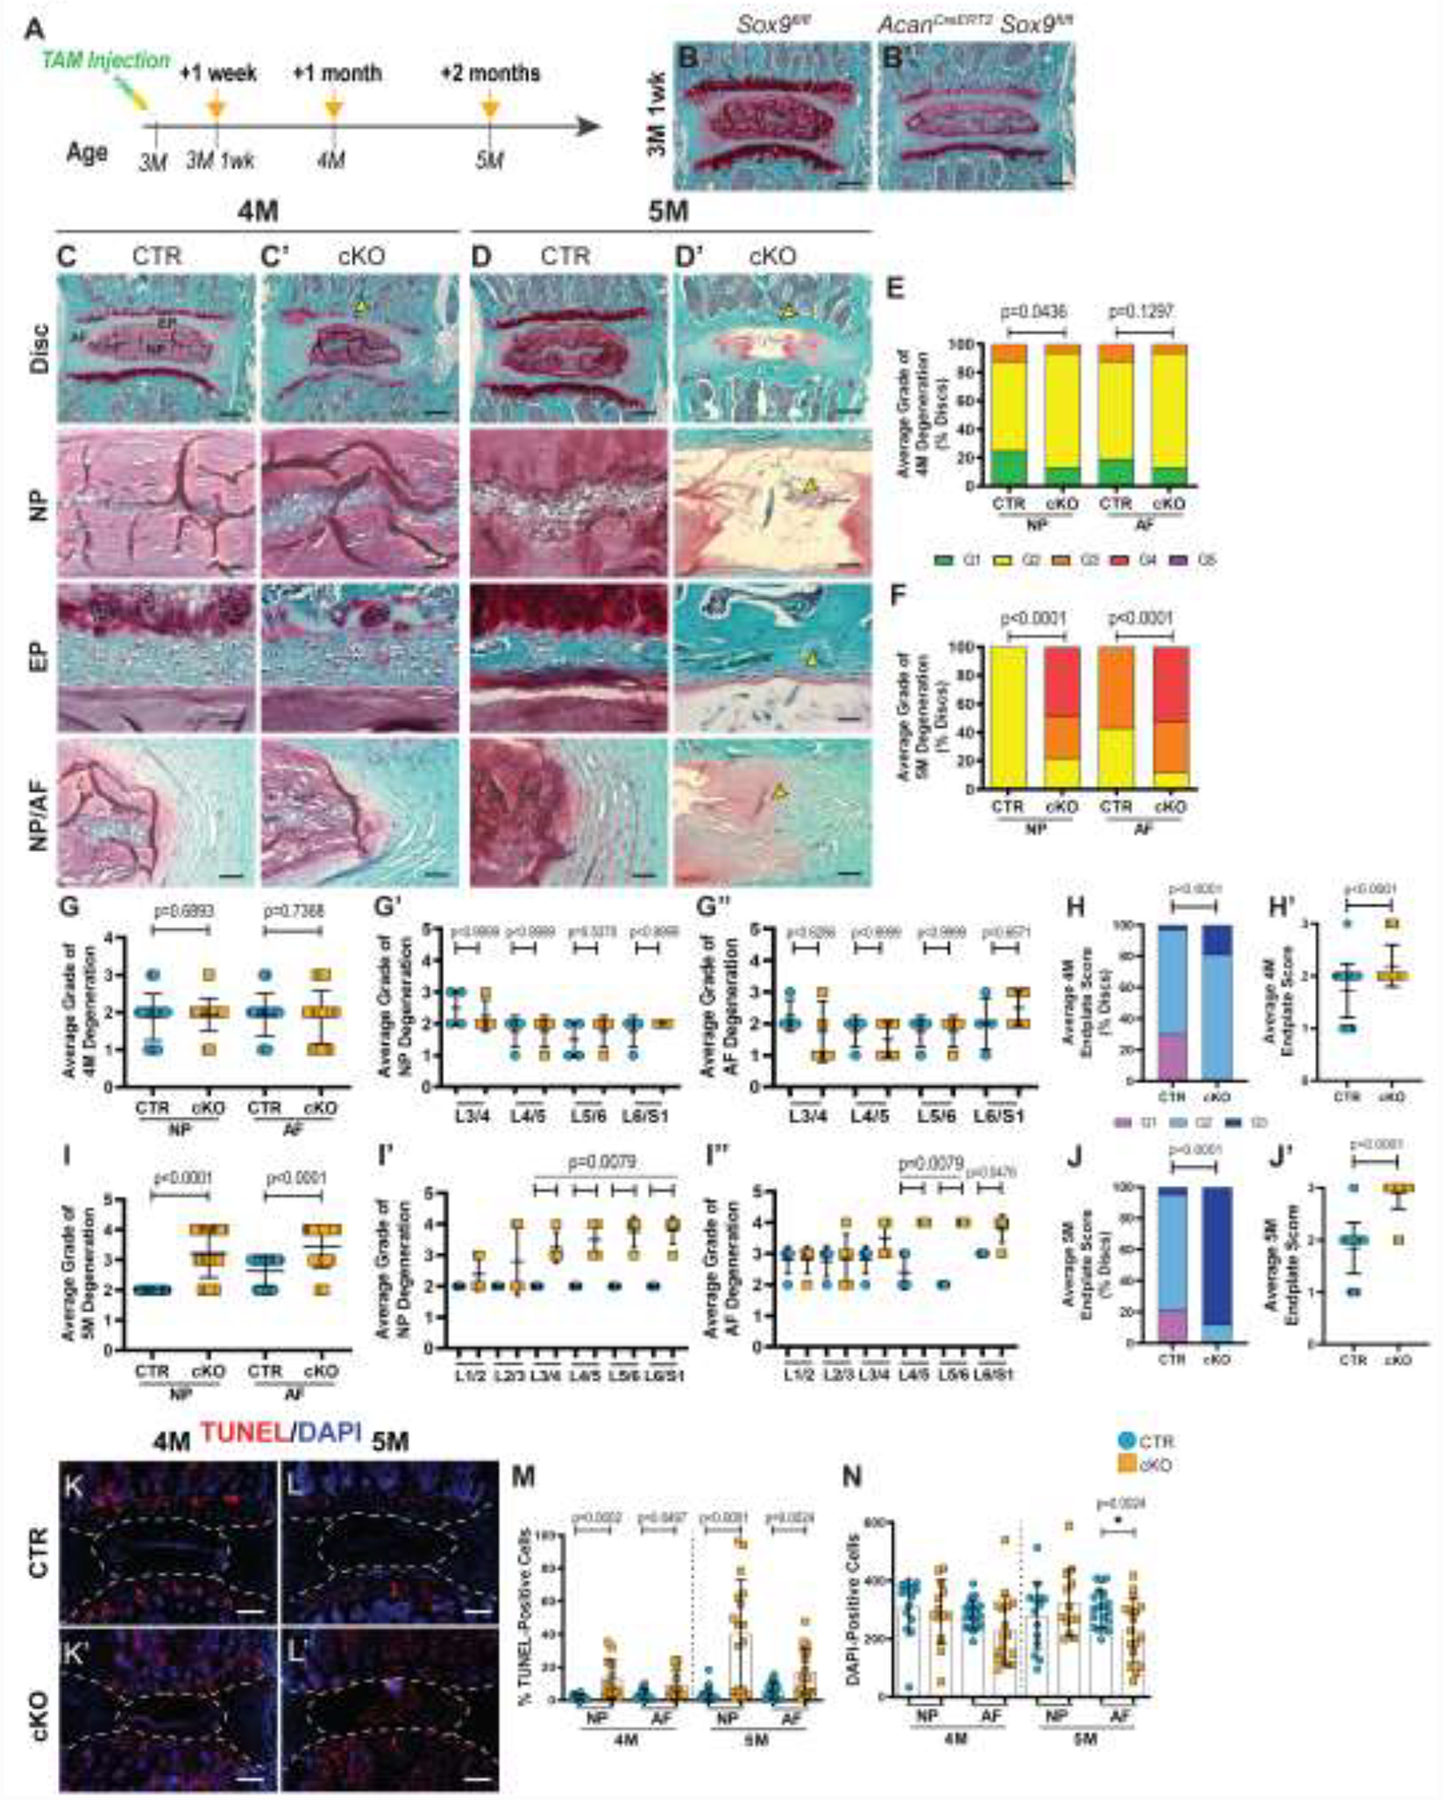
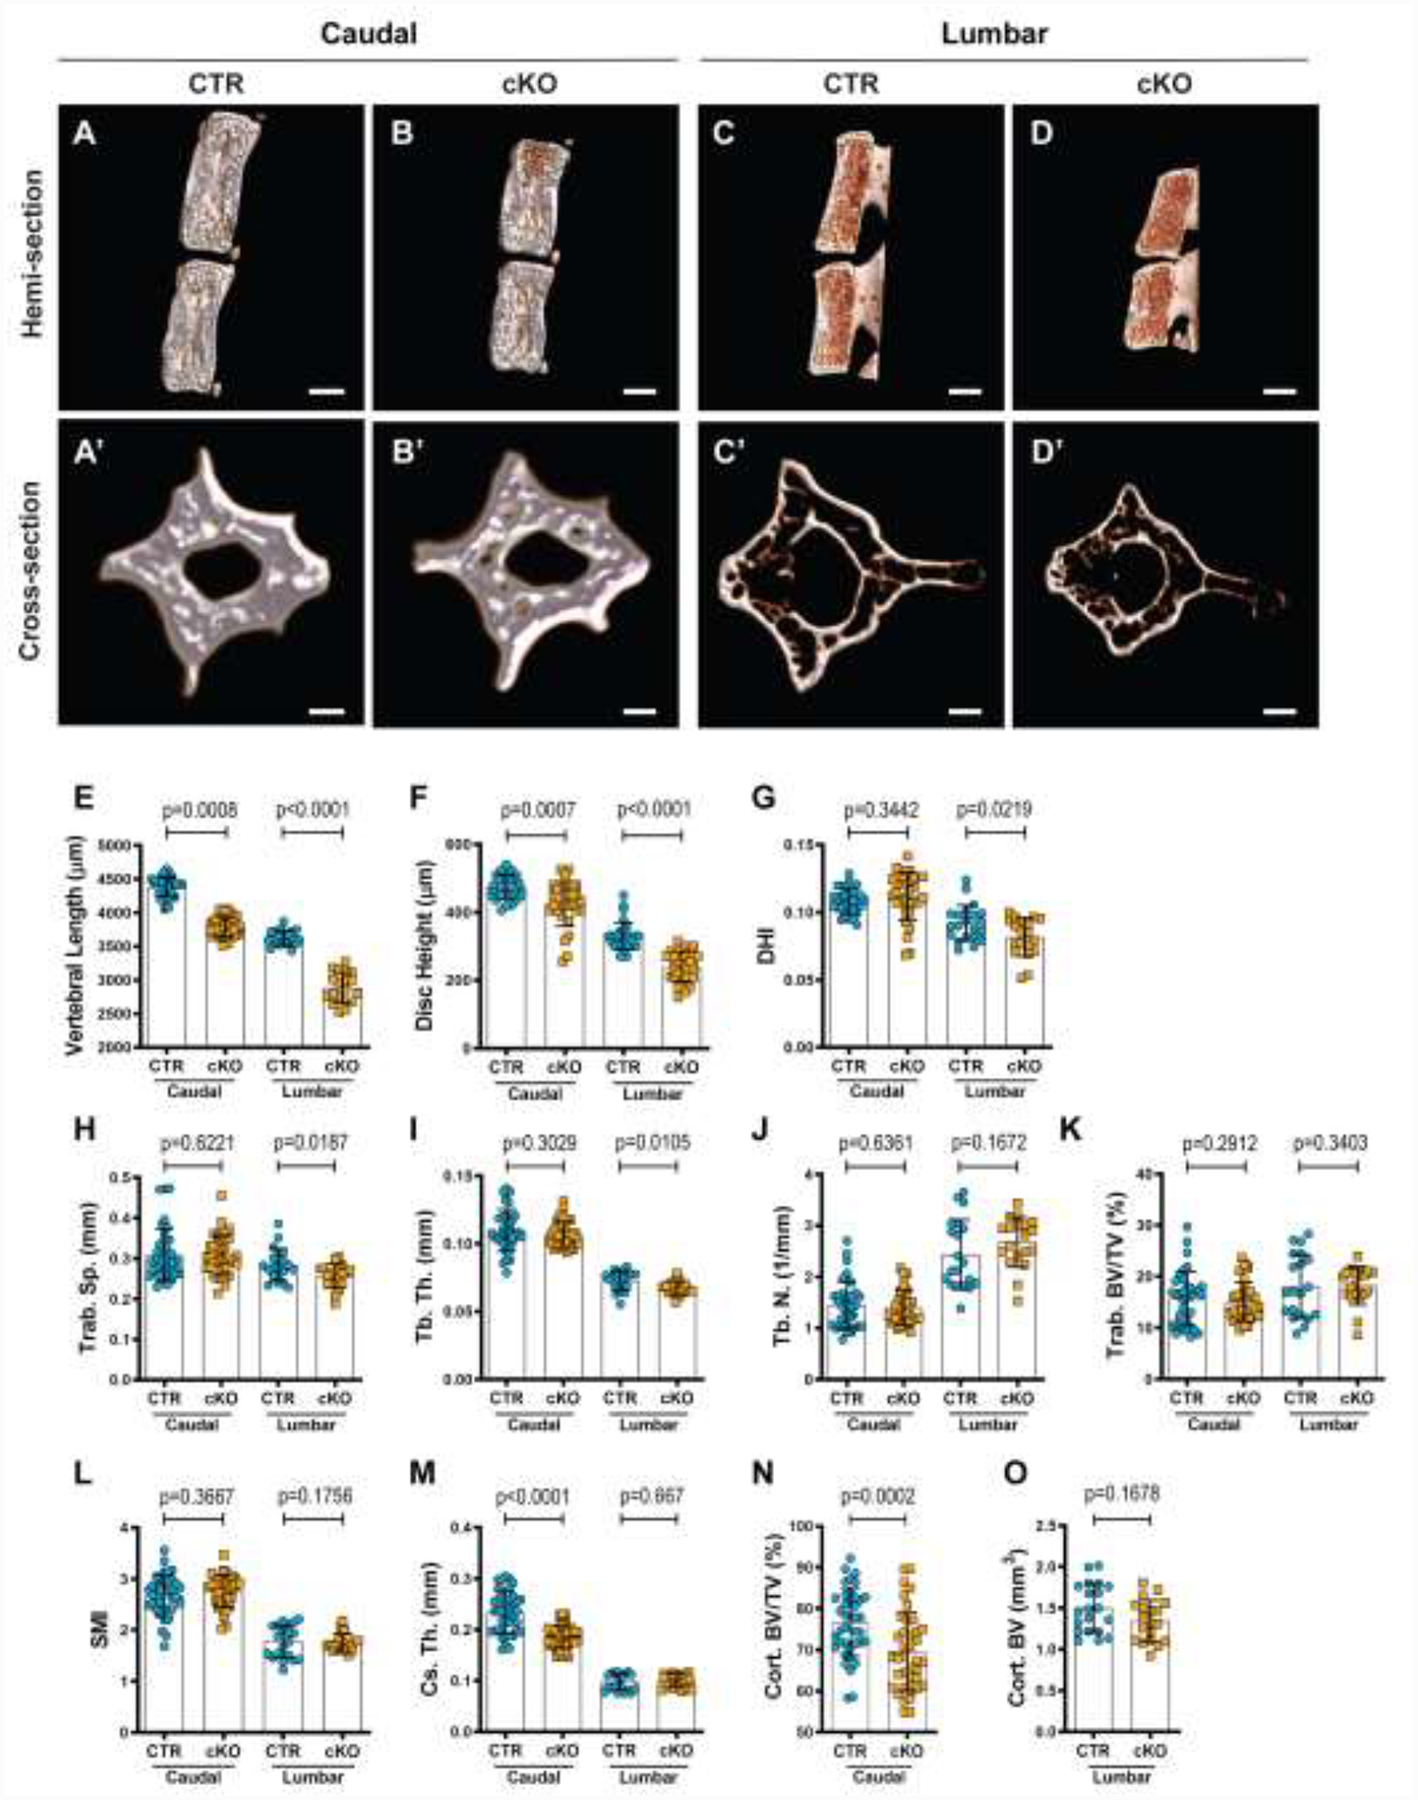
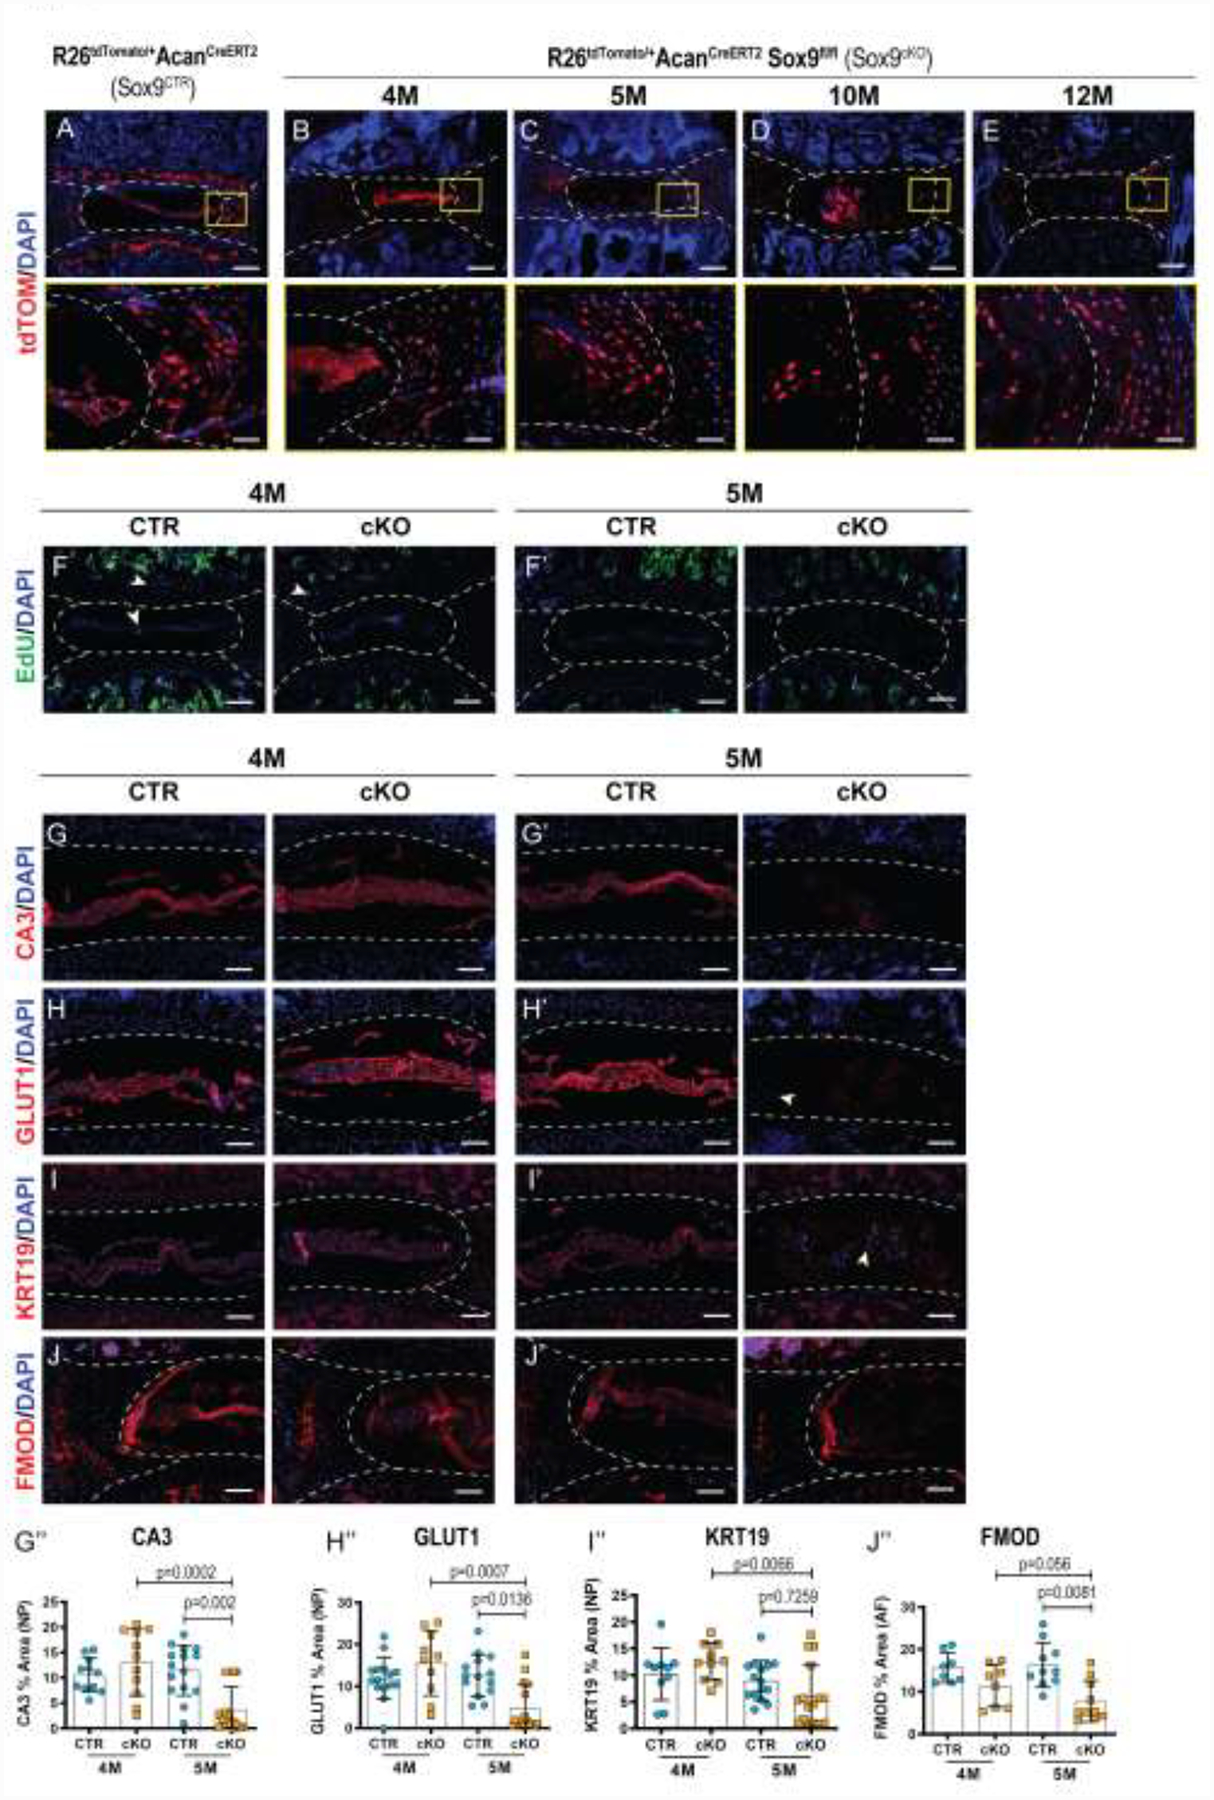
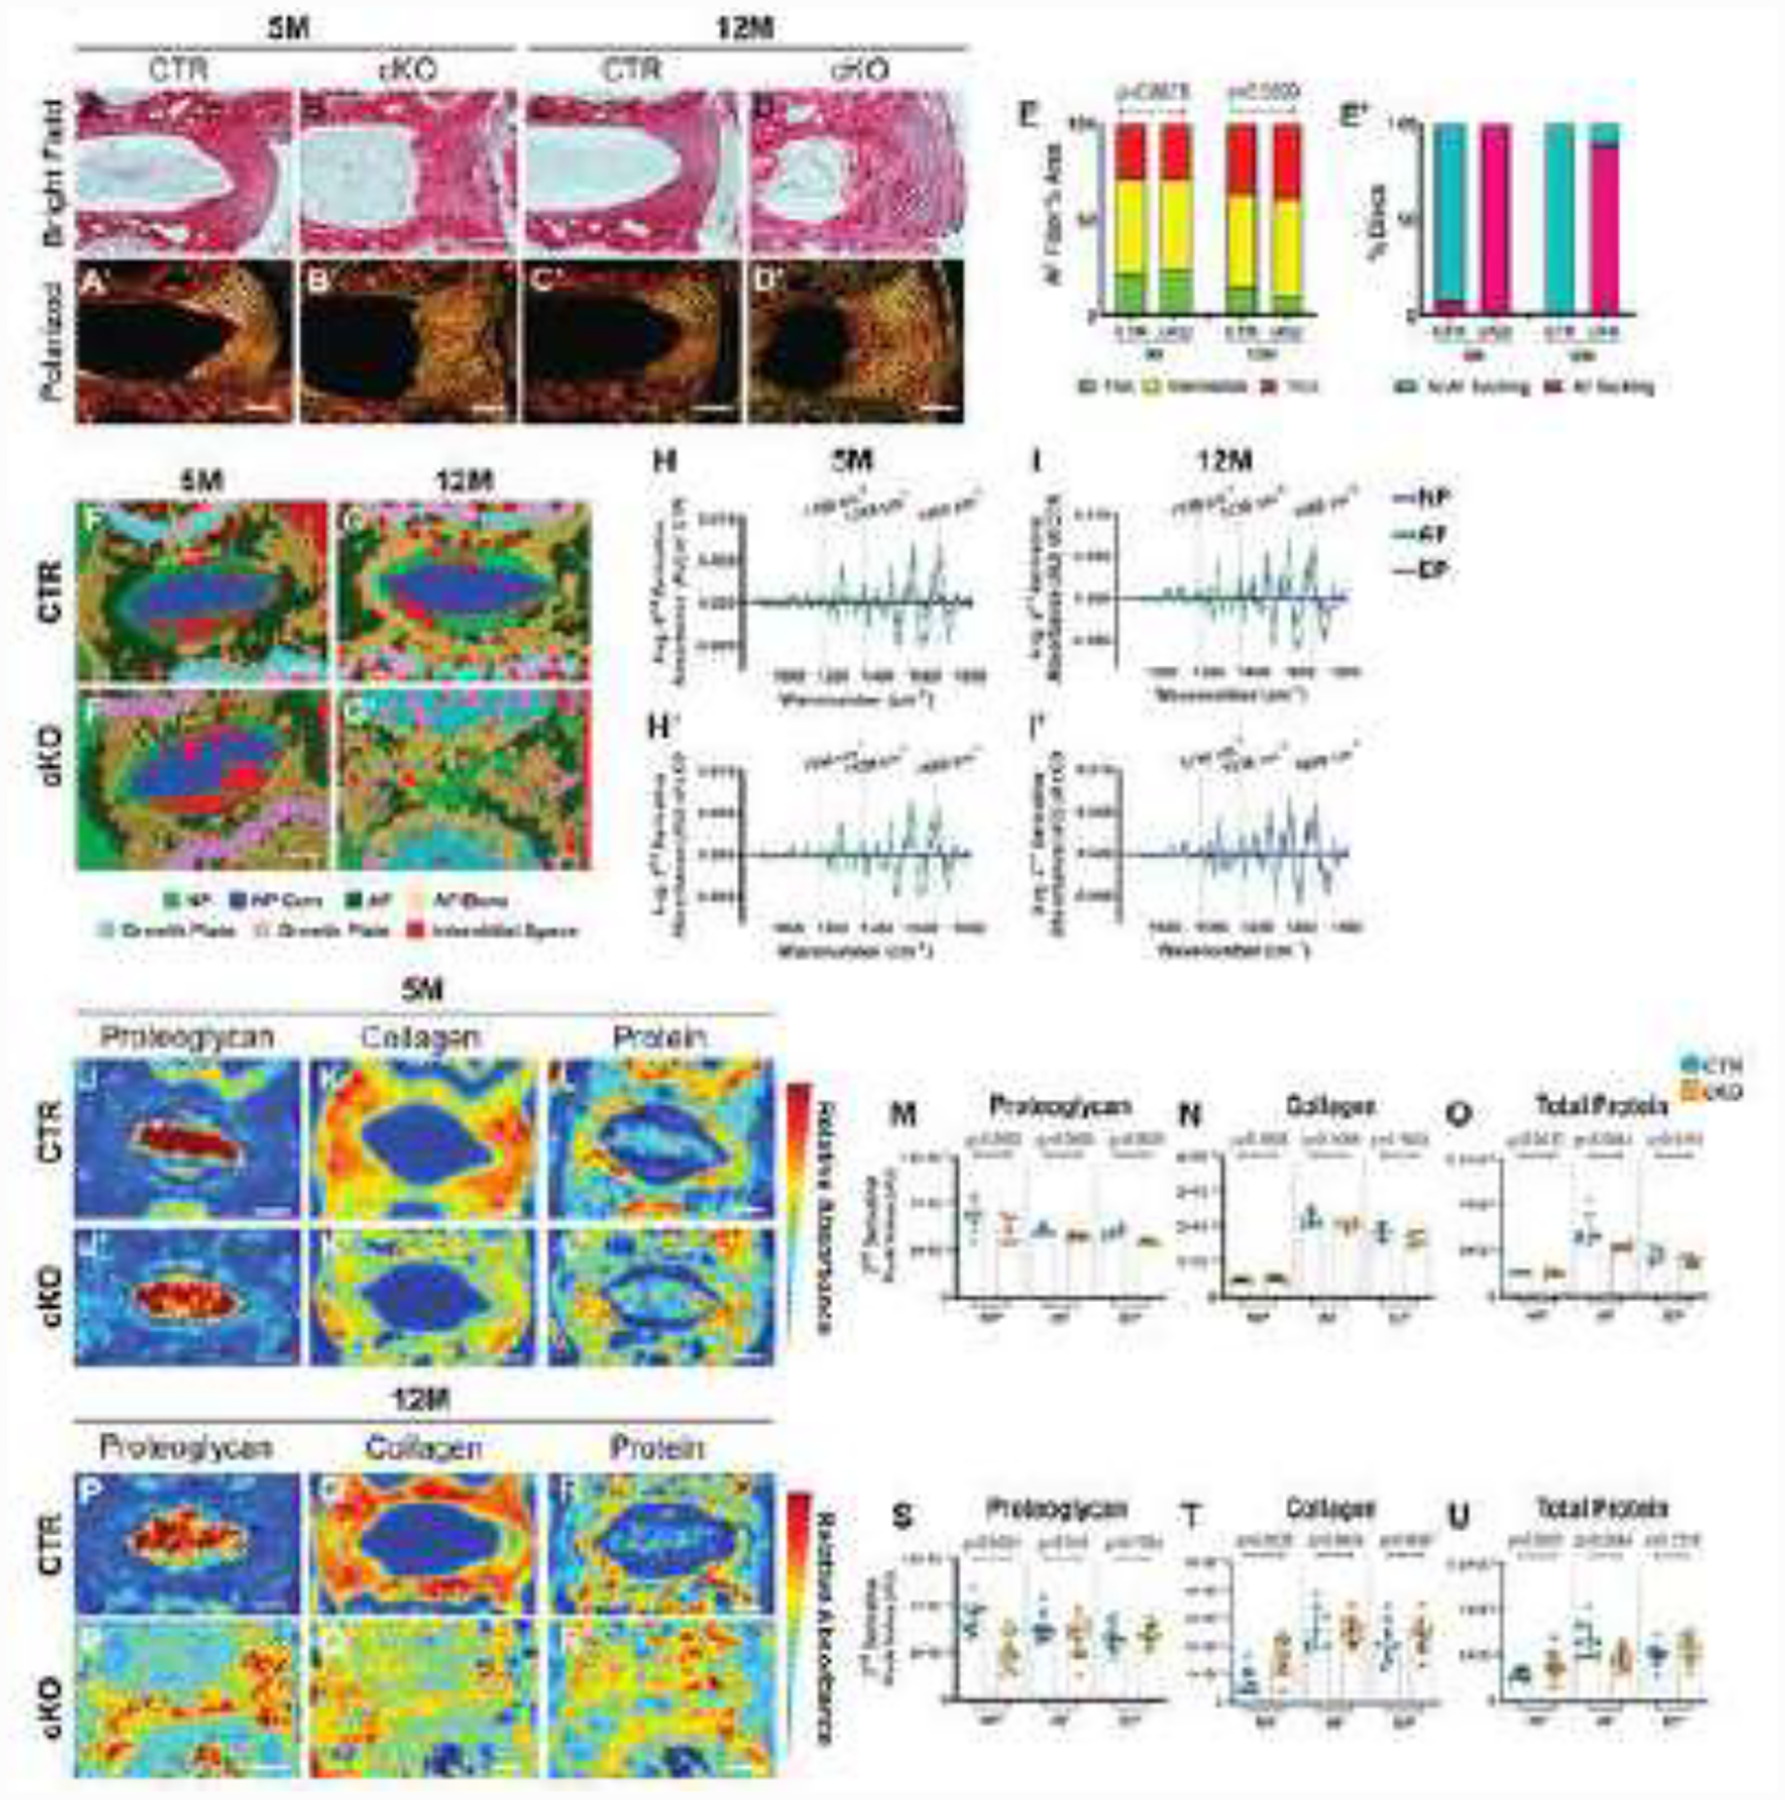
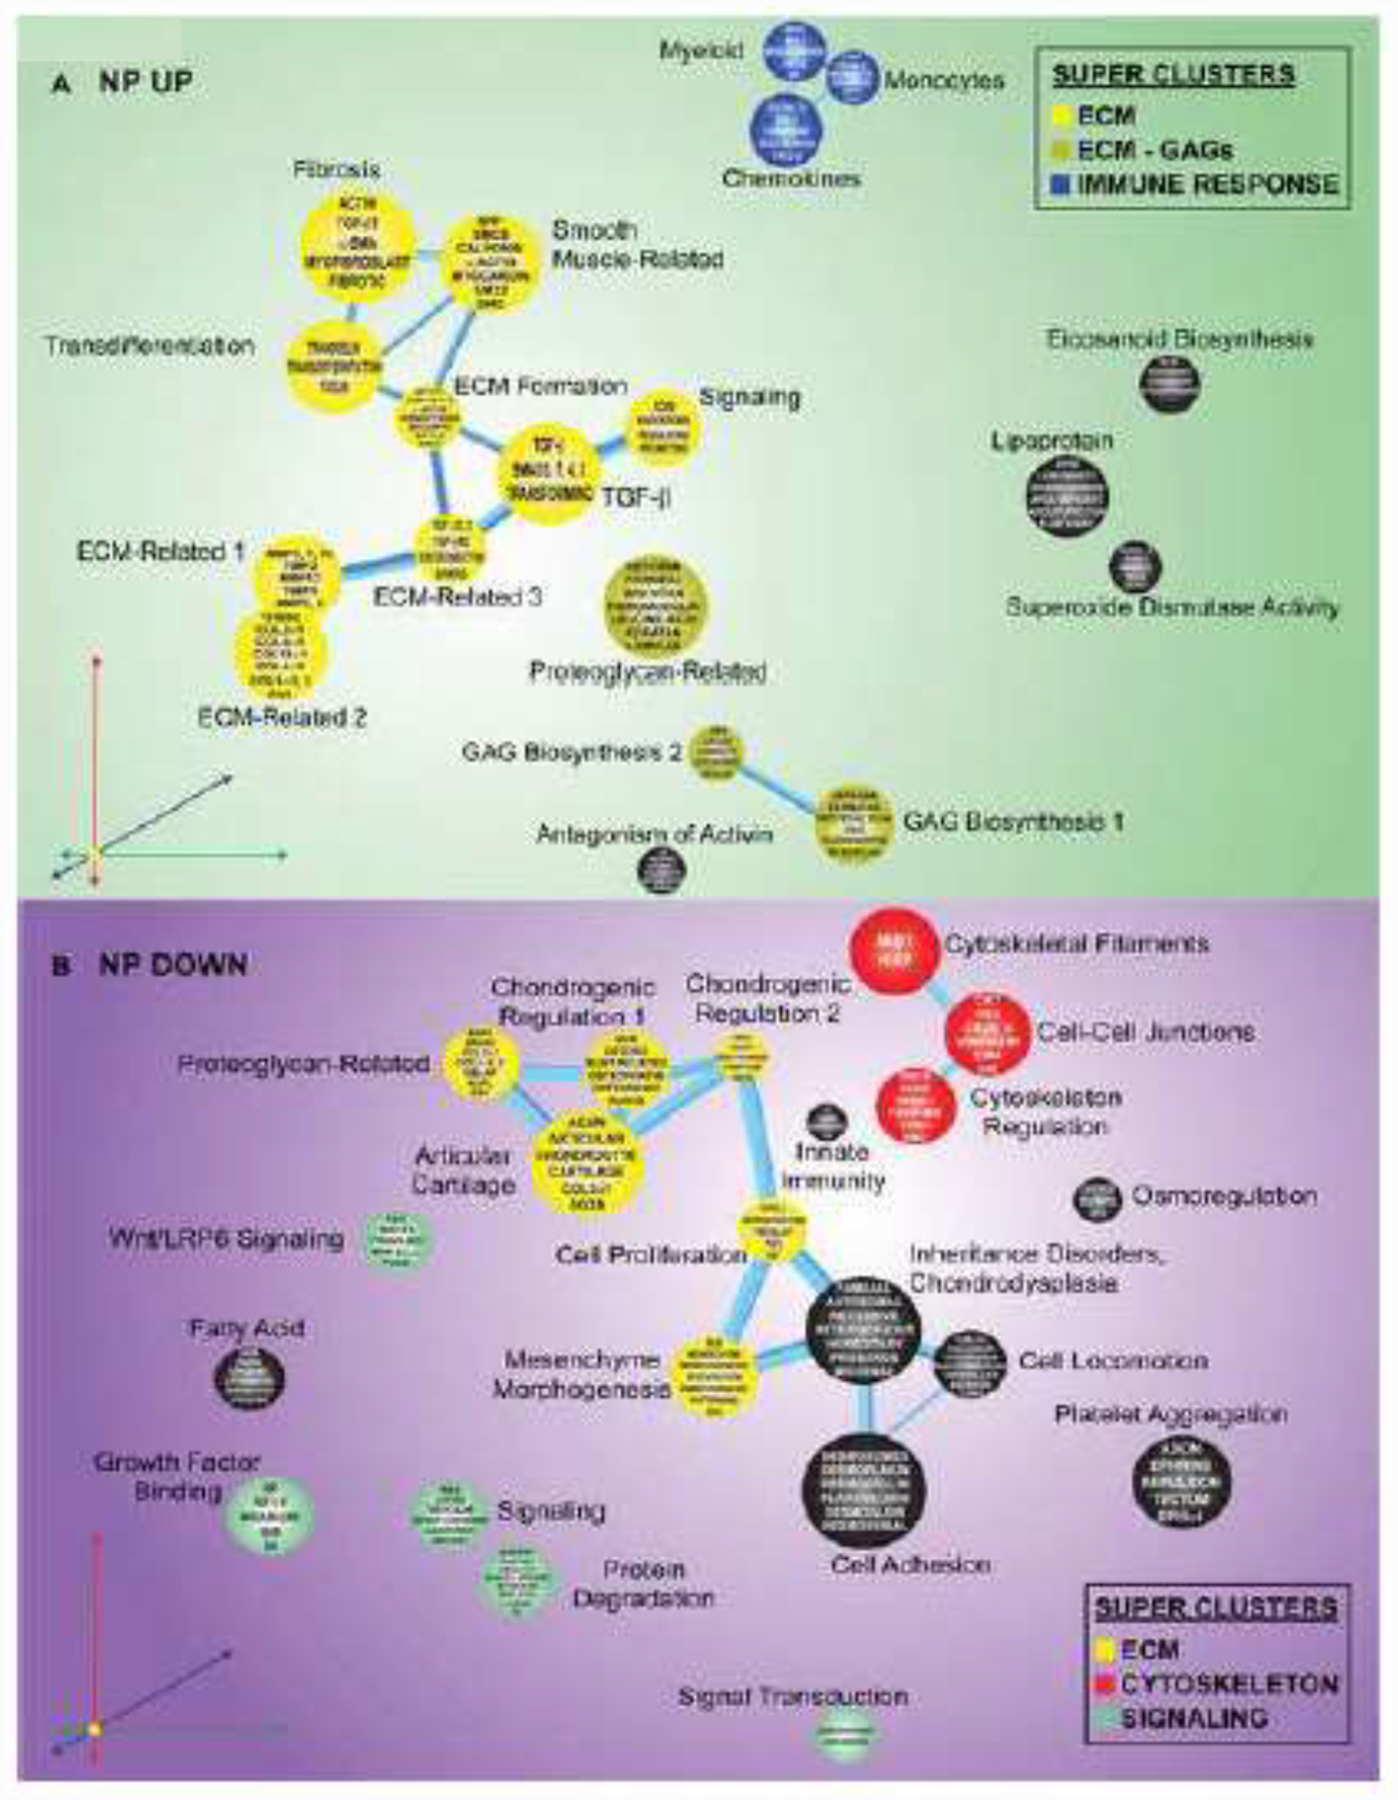
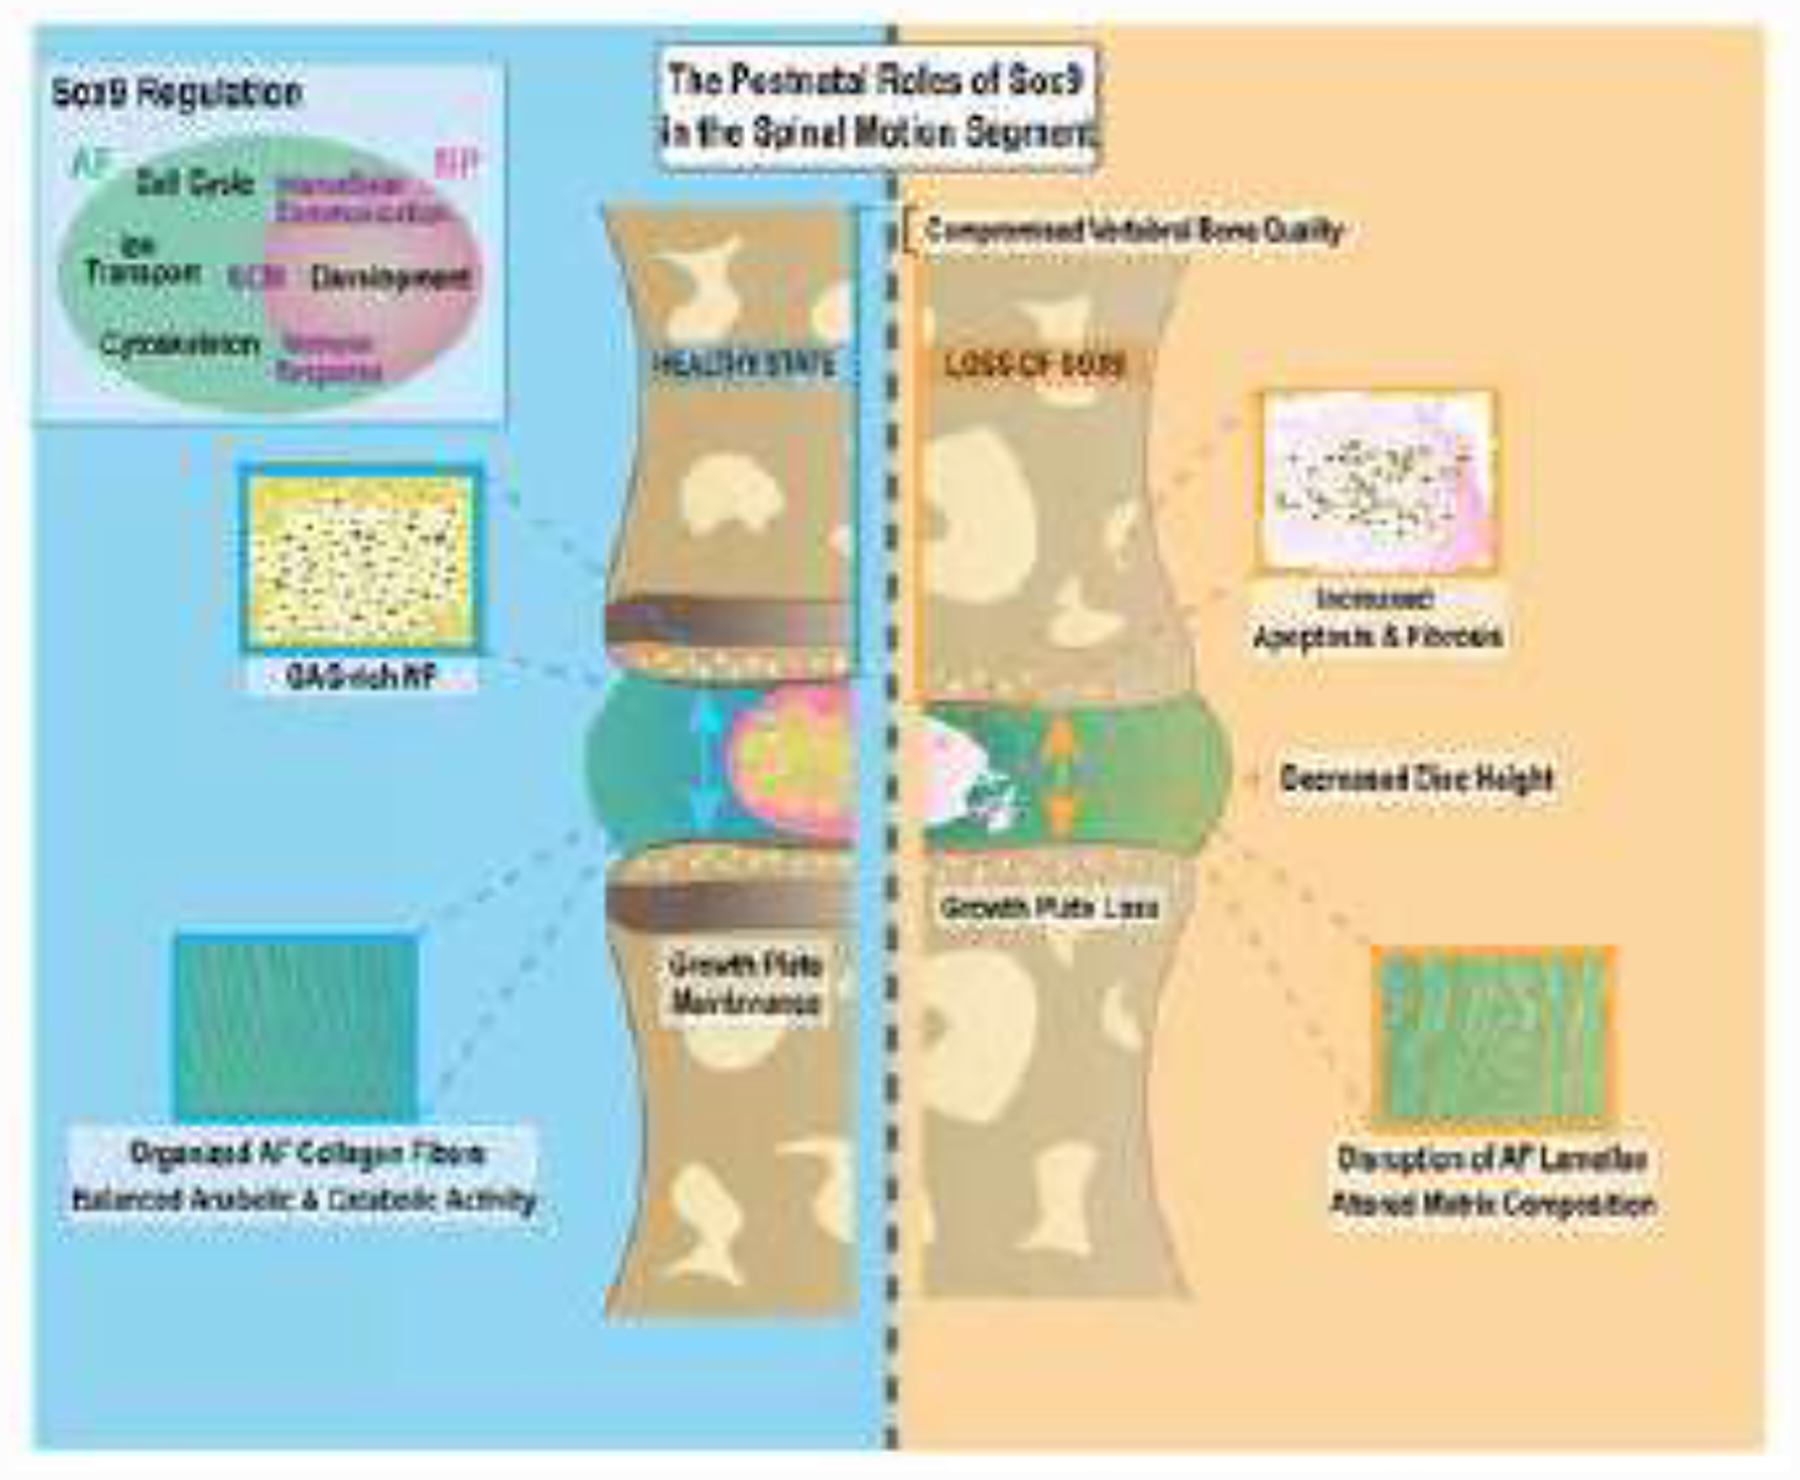
SOX9 plays an important role in chondrocyte differentiation and, in the developing axial skeleton, maintains the notochord and the demarcation of intervertebral disc compartments. Diminished expression is linked to campomelic dysplasia, resulting in severe scoliosis and progressive disc degeneration. However, the specific functions of SOX9 in the adult spinal column and disc are largely unknown. Accordingly, employing a strategy to conditionally delete Sox9 in Acan-expressing cells (AcanCreERT2Sox9fl/fl), we delineated these functions in the adult intervertebral disc. AcanCreERT2Sox9fl/fl mice (Sox9cKO) showed extensive and progressive remodeling of the extracellular matrix in nucleus pulposus (NP) and annulus fibrosus (AF), consistent with human disc degeneration. Progressive degeneration of the cartilaginous endplates (EP) was also evident in Sox9cKO mice, and it preceded morphological changes seen in the NP and AF compartments. Fate mapping using tdTomato reporter, EdU chase, and quantitative immunohistological studies demonstrated that SOX9 is crucial for disc cell survival and phenotype maintenance. Microarray analysis showed that Sox9 regulated distinct compartment-specific transcriptomic landscapes, with prominent contributions to the ECM, cytoskeleton-related, and metabolic pathways in the NP and ion transport, the cell cycle, and signaling pathways in the AF. In summary, our work provides new insights into disc degeneration in Sox9cKO mice at the cellular, molecular, and transcriptional levels, underscoring tissue-specific roles of this transcription factor. Our findings may direct future cell therapies targeting SOX9 to mitigate disc degeneration.

Keywords: Annulus fibrosus; Extracellular matrix; Intervertebral disc degeneration; Mouse model; Nucleus pulposus; Sox9.


Conflict of interest statement

Declaration of Competing Interest R.A. Barve may receive royalty income based on the CompBio technology developed by R.A. Barve and licensed by Washington University to PercayAI. The remaining authors declare they have no competing interests to disclose in relation to the contents of this article.

Figures

Figure 1.
Figure 1.. Sox9cKO mice show signs of early degenerative changes.
(A) Timeline of tamoxifen administration to generate Sox9CTR (Sox9fl/fl) and Sox9cKO (AcanCreERT2Sox9fl/fl) mice. Mice of both genotypes were injected at 3 months (3M) and analyzed at 1 week (3M 1 wk), 1 month (4M), and 2 months (5M) post injection. (B-D’) Safranin O/Fast Green staining of lumbar discs showing disc morphology and overall proteoglycan content in the intervertebral disc. (B-B’) One week post Sox9 deletion Sox9cKO mice show comparable disc morphology to Sox9CTR (scale bar = 200 μm). (C-D’) Whole disc (row 1, scale bar = 200 μm) and high-magnification images of the NP, EP, and NP/AF boundaries (rows 2, 4, scale bar = 50 μm; row 3, scale bar = 25 μm) in 4- and 5-month-old Sox9CTR and Sox9cKO mice. (C’, D’) Yellow arrowheads indicate proteoglycan loss in the growth plate at 4 months, without changes in other compartments. (D’) Complete ablation of the growth plate, fibrotic remodeling in the NP, loss of hypertrophic cells, and reduced definition between NP and AF compartments was evident in 5-month-old Sox9cKO mice. (E-H”) Histological grading assessment of 4-month- and 5-month-old lumbar discs using the modified Thompson and Tessier scales (n=4–5 discs/animal, 4–5 animals/genotype, 16–25 total discs/genotype). (E, F) Distribution of average histological grades in the NP and AF of 4-month-old (E) and 5-month-old (F) animals, with higher scores indicating higher levels of degeneration. (G-J’) Cumulative average, level-by-level average histological grades of the NP and AF, and average collective EP scores in 4-month-old (G-H’) and 5-month-old (I-J’) animals. (K-L’) TUNEL staining showing apoptotic cells in the NP and AF regions of lumbar intervertebral disc sections from 4-month (n=4 discs/animal, 4 animals/genotype, 16 total discs/genotype) and 5-month-old (n=6 discs/animal, 5 animals/genotype, 30 total discs/genotype) mice (scale bar= 200 μm). (M, N) Corresponding quantification showing the percentage of TUNEL-positive cells and the number of DAPI-stained nuclei. Significance for the grading distribution was determined using a χ2 test. Significance for all other quantitative measures was determined by using an unpaired t-test or Mann-Whitney test if data were not normally distributed. Quantitative measurements represent mean ± SD.
Figure 2.
Figure 2.. Sox9cKO mice show severe disc degeneration at 12 months of age.
(A) Timeline of tamoxifen administration to mice at 3 months. 9 months post injection, 12-month-old (12M) Sox9cKO and Sox9CTR mice were analyzed. (B-C’) Safranin O/Fast Green staining of (B, B’) lumbar and (C, C’) caudal discs showing tissue morphology and proteoglycan content (row 1, scale bar= 200 μm) and high magnification images of the NP, EP, and NP/AF tissue boundary (rows 2–4, scale bar= 50 μm). Yellow arrowheads indicate the fibrotic remodeling in the NP, loss of hypertrophic cells, and reduced demarcation between NP and AF compartments. (D-K) Histological grading assessment using the modified Thompson and Tessier scales for 12-month-old (D, F-H) lumbar and (E, I-K) caudal discs (n=3 lumbar discs/animal, 5 caudal discs/animal, 10 animals/genotype, 30 lumbar and 50 caudal discs/genotype). (D-E, F, I) Distribution of and average histological grades in the NP and AF, with higher scores indicating higher levels of degeneration. (G-H, J-K) Level-by-level average grades of NP and AF degeneration. (L-L’, M-M’) Average collective scores of endplate degeneration. Significance for grading distribution was determined using a χ2 test. Significance of level-by-level data was determined using an unpaired t-test or Mann-Whitney test, if data were not normally distributed. Quantitative measurements represent mean ± SD.
Figure 3.
Figure 3.. Conditional deletion of Sox9 results in reduced vertebral size and compromised trabecular and cortical bone quality.
(A-D) Representative μCT reconstructions of the hemi-section of a caudal (A, B) and lumbar (C, D) motion segment in a 12-month-old Sox9CTR and Sox9cKO mouse. (A’-D’) Cross-section of a representative caudal (A’, B’) and lumbar (C’, D’) vertebral body of 12-month-old Sox9CTR and Sox9cKO animals. (E) Vertebral length, (F) disc height, (G) and disc height index (DHI) are shown for caudal and lumbar vertebrae. (H-L) Trabecular bone properties of (H) Trab. Sp, (I) Tb. Th., (J) Tb. N., (K) Trab. BV/TV, and (L) structure model index (SMI) are shown for caudal and lumbar vertebrae. (M-O) Cortical bone properties of (M) Cs. Th. (caudal and lumbar), (N) Cort. BV/TV (caudal only), and (O) Cort. BV (lumbar only) are shown. Quantitative measurements represent mean ± SD (n=3 caudal discs and 4 vertebrae//mouse, 10 mice/genotype; n=2 lumbar discs and 3 vertebrae/mouse, 10 mice/genotype). (A-D) Scale bar = 1mm. (A’-D’) Scale bar = 250 μm. Significance of differences was determined using an unpaired t-test or Mann-Whitney test, if data were not normally distributed.
Figure 4.
Figure 4.. Sox9cKO mice progressively lose native cell populations and show diminished phenotypic marker expression.
(A-E) Fate mapping using tdTOM in a (A) Sox9CTR and (B) 4M), (C) 5M, (D) 10M and (E) 12M Sox9cKO animals (top row scale bar= 200 μm; bottom row scale bar= 50 μm). Loss of tdTOM+ cells was evident with time without replacement by tdTOM cell types, n=2 discs/animal, 2 animals/time point, 4 total discs/time point (F-F’) EdU labeling in (F) 4M and (F’) 5M animals, injected 6 hours prior to euthanasia (scale bar = 200 μm). White arrowheads indicate EdU-positive cells. (G-I”) Quantitative immunohistological staining of NP phenotypic markers using 4- and 5-month-old lumbar discs: (G-G”) carbonic anhydrase 3 (CA3); (H-H”) glucose transporter 1 (GLUT1); and (I-I”) keratin 19 (KRT19) (scale bar= 100 μm). Decreased staining area for all the markers and a subpopulation of cells negative for marker expression was evident in Sox9cKO mice. (J-J”) Quantitative immunohistological staining conducted on 4- and 5-month-old lumbar discs for AF phenotypic marker fibromodulin (FMOD) (scale bar= 100 μm). (n=2–4 discs/animal, 4 animals/genotype (4M), 8–15 discs/genotype/stain; 5 animals/genotype (5M), 10–16 discs/genotype/stain). Dotted lines demarcate different tissue compartments within the disc. Quantitative measurements represent mean ± SD. Significance was tested using Kruskal-Wallis and Dunn’s multiple comparison tests.
Figure 5.
Figure 5.. Changes in chemical composition accompany increased severity of disc degeneration in Sox9cKO mice.
(A-D’) Picrosirius Red staining of (A-B’) 5-month-old and (C-D’) 12-month-old caudal discs showing collagen organization of the AF in the (A-D) bright field and collagen fiber distribution under (A’-D’) polarized light (scale bar= 100 μm). (E-E’) Quantification of (E) fiber thickness distribution and (E’) proportion of discs with AF buckling for 5-month-old (n=4 discs/animal, 5 animals/genotype, 20 total discs/genotype) and 12-month-old (n=3 discs/animal, 6 animals/genotype, 18 total discs/genotype) caudal discs. (F-G’) Spectral cluster analysis images (Scale bar = 200 μm). (H-I’) Average second derivative spectra, inverted for positive visualization, of the NP, AF, and EP of (H, H’) 5-month-old (n=1 disc/animal, 5 animals/genotype, 5 total discs/genotype) and (I, I’) 12-month-old (n=1 disc/animal, 10 animals/genotype). (J-L’ and P-R’) Chemical maps and (M-O and S-U) quantification of mean second derivative peaks for (J-J’, M, P-P’, S) proteoglycan (1156 cm−1), (K-K’, N, Q-Q’, T) collagen (1338 cm−1), and (L-L’, O, R-R’, U) total protein (1660 cm−1) content. Significance between fiber distribution was determined using a χ2 test. AU: arbitrary units. Quantitative measurements represent mean ± SD. Significance of chemical components was determined using an unpaired t-test or Mann-Whitney test, if data were not normally distributed.
Figure 6.
Figure 6.. Sox9cKO mice show matrix remodeling characteristic of disc degeneration.
Quantitative immunohistological staining of 12-month-old Sox9CTR and Sox9cKO lumbar discs for: (A, A’) aggrecan (ACAN); (B, B’) chondroitin sulfate (CS); (C, C’) aggrecan neoepitope, generated by ADAMTS-dependent degradation (ARGxx); (E, E’) collagen I (COL I), (F, F’) collagen II (COL II); (G, G’) denatured collagen, measured by a collagen hybridization peptide binding (CHP); (I, I”) cartilage oligomeric matrix protein (COMP); (J, J’) fibromodulin (FMOD); (K, K’) matrix metalloproteinase 13 (MMP13); (L, L’) collagen X (COL X). Yellow arrowheads indicate (D) ARGxx-expressing cells and (M) COL X deposition. A-C, G, L, : scale bar= 200 μm; E-F, H-K: scale bar= 100 μm, and ARGxx, COL X: scale bar=50 μm. (n=1–3 discs/animal; 6 animals/genotype, 9–16 discs/genotype/stain; 5 animals/genotype, 12–15 total discs/genotype for CHP) Dotted lines demarcate different tissue compartments within the disc. Quantitative measurements represent mean ± SD. Significance was determined using an unpaired t-test or Mann-Whitney test as appropriate.
Figure 7.
Figure 7.. Sox9cKO mice show early transcriptional reprogramming in NP and AF tissues
(A) Timeline of tamoxifen administration in Sox9CTR and Sox9cKO mice at 3 months; RNA was analyzed 5 and 21 days post injection. (B) mRNA expression levels of Sox9 in the NP and AF of Sox9CTR and Sox9cKO —mice 5 days post tamoxifen injection (n=17 discs/animal, 4 animals/genotype). (C-C’) Clustering of transcriptomic profiles by Principal Component Analysis of NP (C) and AF (C’) tissues. (D, E) Hierarchical clustering of significantly differentially expressed genes (DEGs) (p < 0.05, ≥ 1.75-fold change). (D’, E’) Log-log scatterplots of DEGs in the (D’) NP and (E’) AF. (F) Venn Diagram showing the distribution and directionality of unique and common DEGs in the NP and AF (p ≤ 0.05, ≥ 1.75-fold change). (G-H’) Relative mRNA expression levels of genes confirmed by qPCR in the (G, G’) NP and (H, H’) AF of animals (G, H) 5 days (n=17 discs/animal, 7 animals/genotype) and (G’, H’) 21 days post tamoxifen injection (n=17 discs/animal, 5 Sox9CTR, 7 Sox9cKO). PCR data represents the mean ± SD. Significance was determined using an unpaired t-test or Mann-Whitney test, if data were not normally distributed.
Figure 8.
Figure 8.. Sox9 deletion in the AF significantly impacts transcriptional programming related to the immune response, cytoskeleton, cell cycle, extracellular matrix, and ion transport.
(A) Thematic organization of concepts determined by literature correspondence to significantly differentially upregulated genes in the AF of Sox9cKO mice, emphasizing immune responses (blue), the cytoskeleton (red), the cell cycle (orange), and the extracellular matrix (yellow) as prominent physiological features impacted by SOX9 loss of function. (B) Downregulated DEGs in the AF of Sox9cKO mice indicating the extracellular matrix (yellow) and ion transport (pink) as the most prominent physiological features impacted by Sox9 deletion. (n=17 discs/animal, 4 animals/genotype)
Figure 9.
Figure 9.. Sox9 deletion in the NP significantly impacts transcriptional programs related to extracellular matrix, glycosaminoglycans, immune response, cytoskeleton, and signaling.
(A) Thematic organization of concepts determined by literature correspondence to significantly differentially upregulated genes in the NP of Sox9cKO mice emphasizes the immune response (blue), the extracellular matrix (yellow), and the extracellular matrix subset of glycosaminoglycans (dark yellow) as prominent physiological features impacted by Sox9 deletion. (B) Downregulated genes in the NP of Sox9cKO mice indicate the extracellular matrix (yellow), cytoskeleton (red), and signaling (green) as the most prominent physiological features impacted by Sox9 deletion. (n=17 discs/animal, 4 animals/genotype)
Figure 10.
Figure 10.
Schematic summarizing roles of SOX9 in post-natal maintenance of the intervertebral disc and its unique biological functions in the AF and NP compartments.

References

    1. Katz JN (2006). Lumbar disc disorders and low-back pain: socioeconomic factors and consequences. J Bone Joint Surg Am 88 Suppl 2, 21–24. doi: 10.2106/JBJS.E.01273 - DOI - PubMed
    1. Murray CJL, Atkinson C, Bhalla K, et al. (2013). The state of US health, 1990–2010: burden of diseases, injuries, and risk factors. JAMA 310, 591–608. doi: 10.1001/jama.2013.13805 - DOI - PMC - PubMed
    1. Global Burden of Disease Study 2013 Collaborators (2015). Global, regional, and national incidence, prevalence, and years lived with disability for 301 acute and chronic diseases and injuries in 188 countries, 1990–2013: a systematic analysis for the Global Burden of Disease Study 2013. Lancet 386, 743–800. doi: 10.1016/S0140-6736(15)60692-4 - DOI - PMC - PubMed
    1. Arnbak B, Jensen TS, Egund N, et al. (2016). Prevalence of degenerative and spondyloarthritis-related magnetic resonance imaging findings in the spine and sacroiliac joints in patients with persistent low back pain. Eur Radiol 26, 1191–1203. doi: 10.1007/s00330-015-3903-0 - DOI - PubMed
    1. Livshits G, Popham M, Malkin I, et al. (2011). Lumbar disc degeneration and genetic factors are the main risk factors for low back pain in women: the UK Twin Spine Study. Ann Rheum Dis 70, 1740–1745. doi: 10.1136/ard.2010.137836 - DOI - PMC - PubMed

Publication types

Substances