. 2021 Jan 22;32(4):045501.
doi: 10.1088/1361-6528/abbf26.

Quantification of low affinity binding interactions between natural killer cell inhibitory receptors and targeting ligands with a self-induced back-action actuated nanopore electrophoresis (SANE) sensor

Affiliations

Quantification of low affinity binding interactions between natural killer cell inhibitory receptors and targeting ligands with a self-induced back-action actuated nanopore electrophoresis (SANE) sensor

Sai Santosh Sasank Peri et al. Nanotechnology. .

Abstract

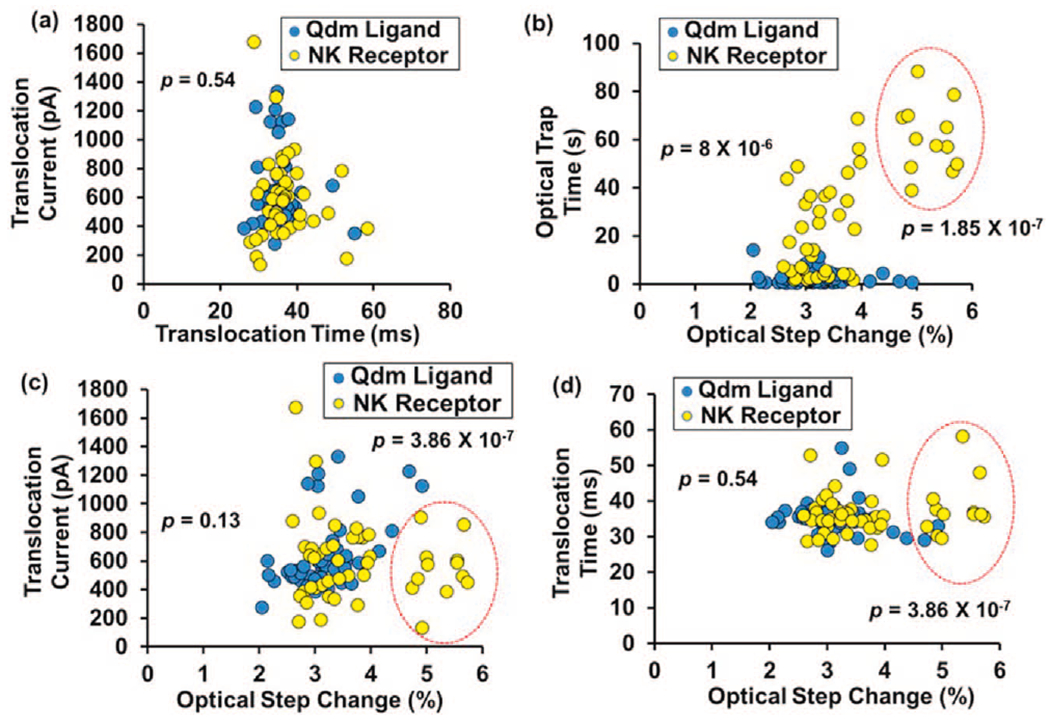
A plasmonic nanopore sensor enabling detection of bimodal optical and electrical molecular signatures was fabricated and tested for its ability to characterize low affinity ligand-receptor interactions. This plasmonic nanosensor uses self-induced back-action (SIBA) for optical trapping to enable SIBA-actuated nanopore electrophoresis (SANE) through a nanopore located immediately below the optical trap volume. A natural killer (NK) cell inhibitory receptor heterodimer molecule CD94/NKG2A was synthesized to target a specific peptide-presenting Qa-1b Qdm ligand as a simplified model of low-affinity interactions between immune cells and peptide-presenting cancer cells that occurs during cancer immunotherapy. A cancer-irrelevant Qa-1b GroEL ligand was also targeted by the same receptor as a control experiment to test for non-specific binding. The analysis of different pairs of bimodal SANE sensor signatures enabled discrimination of ligand, receptor and their complexes and enabled differentiating between specific and non-specific ligand interactions. We were able to detect ligand-receptor complex binding at concentrations over 500 times lower than the free solution equilibrium binding constant (K D ). Additionally, SANE sensor measurements enabled estimation of the fast dissociation rate (k off) for this low-affinity specific ligand-receptor system, previously shown to be challenging to quantify with commercial technologies. The k off value of targeted peptide-presenting ligands is known to correlate with the subsequent activation of immune cells in vivo, suggesting the potential utility of the SANE senor as a screening tool in cancer immunotherapy.


Figures

Figure 1.
Figure 1.
(a) Scanning electron microscope image of FIB-milled DNH and nanopores structure on the metal-dielectric membrane. (b) Experimental setup with optical and electrical measurement instruments. LD: Laser Diode, QWP: Quarter Wave Plate, GTP: Glan-Thompson Polarizer, HWP: Half Wave Plate, 4× BE: 4× Beam Expander, MR: Mirror, OL: Carl-Zeiss 1.3 N.A. 63× Objective Lens, CL: Condenser Lens, PD: Photodiode. (c) PDMS flow cell cross-sectional view with SANE sensor.
Figure 2.
Figure 2.
Time traces of individual Qdm ligand (a)–(c) and NK receptor molecules, (d)–(f). Optical transmission (a) and (d), raw ionic current (b) and (e) and low-pass filtered ionic current (c) and (f).
Figure 3.
Figure 3.
Histograms of translocation current and translocation time for (a), (b) individual Qdm ligand (blue) and NK receptor (yellow) and (c), (d) equimolar mixtures of Qdm-NK receptor (Green) and GroEL-NK receptor (Orange).
Figure 4.
Figure 4.
Event density plots comparing Qdm ligands (blue circles, n = 51) and both the groups of NK receptors (yellow circles, n = 47, group 2 is circled) for all data types. (a) Electrical metrics alone. (b) Optical metrics alone. (c), (d) Combined optical-electrical metrics. Bimodal metrics were tested for statistically significant differences using a 2s–2d KS test.
Figure 5.
Figure 5.
Histogram of optical step change for ligand-receptor (Qdm-NK receptor) equimolar mixtures. A threshold of 3.15% (red dashed line) was defined for classifying events as bound complex (middle gaussian) versus unbound ligand and receptor (left gaussian) and likely larger complexes or receptor agglomerates (right gaussian).
Figure 6.
Figure 6.
(a) Event scatter plots of optical metrics for equimolar mixtures of Qdm and NK receptor at (a) 600 nM (b) 300 nM, (c) 100 nM and (d) 10 nM.
Figure 7.
Figure 7.
(a)–(c) Optical and electrical time traces from a Qdm equimolar mixture with NK receptor at 10 nM. (d)–(f) Corresponding time traces for an equimolar mixture of non-specific GroEL ligand with NK receptor at 10 nM.
Figure 8.
Figure 8.
Event density plots comparing the specific mixture (Qdm-NK receptor, green circles (n = 132)) with the non-specific mixture (GroEL-NK receptor, orange circles (n = 41)) for all data types. (a) Electrical nanopore translocation times and translocation current for an NK receptor targeting a specific Qdm ligand and a non-specific GroEL ligand are highly overlapped. (b) Optical metrics alone. (c), (d) Event density plots comparing optical transmission data with electrical nanopore data to enable discrimination between specific and non-specific binding. Some events showed clear separation (optical step change <3.15%, orange circles) from the specific mixture. Bimodal metrics were tested for statistical differences using a 2s–2d KS test (p < 0.01).
Figure 9.
Figure 9.
Event density plots comparing the overlapping events of non-specific mixture (GroEL-NK receptor, pink circles (n = 55)) with specific mixture (Qdm-NK receptor, green circles (n = 98)) for all data types. The overlapping events (optical step change >3.15% in non-specific mixture) were identified as non-specific binding through ligand-receptor binding duration, to be discussed below. (a) Electrical nanopore translocation times and translocation current for an NK receptor targeting a specific Qdm ligand and a non-specific GroEL ligand are highly overlapped. (b) Optical metrics alone. (c), (d) Event density plots comparing optical transmission data with electrical nanopore data to enable discrimination between specific and non-specific binding. Bimodal metrics were tested for statistical differences using a 2s–2d KS test (p < 0.01).
Figure 10.
Figure 10.
(a) A typical binding duration observed for low-affinity (μM) interactions of Qdm-NK receptor complexes at 10 nM concentration (~2 s). (b) Typical binding interaction of Groel-NK receptor at 10 nM concentration (~13 s). (c) Event frequency histograms of optical step change for all the specific binding events (green columns) and overlapping events (pink columns) from non-specific mixture. (d) Scatter plot separating the non-specific mixture events (pink circles, n = 55) from specific binding events (green circles, n = 132) based on binding duration and optical step change. Natural log plot of event frequency of ligand-receptor binding interaction duration for (e) specific mixture and (f) non-specific mixture. In contrast to (e), the data could not be fit to a linear curve in (f). The slope of the line equation is the koff.
Figure 11.
Figure 11.
(a) Schematic of the protein crowding effect created by the applied electric field immediately over the SANE sensor. (b) The observed Qdm-NK receptor bound fraction is significantly higher than corresponding values at the same bulk Qdm-NK receptor concentrations, due to the sensor-induced protein crowding. (c) Zoomed out time-series plot showing no trapping events for several seconds at the beginning of an experiment.

References

    1. Spitzberg JD, Zrehen A, van Kooten XF and Meller A 2019. Plasmonic-nanopore biosensors for superior single-molecule detection Adv. Mater 31 e1900422. - PubMed
    1. Neuman KC and Nagy A 2008. Single-molecule force spectroscopy: optical tweezers, magnetic tweezers and atomic force microscopy Nat. Methods 5 491–505 - PMC - PubMed
    1. Dekker C 2007. Solid-state nanopores Nat. Nanotechnol 2 209–15 - PubMed
    1. Ilyas A, Asghar W, Allen PB, Duhon H, Ellington AD and Iqbal SM 2012. Electrical detection of cancer biomarker using aptamers with nanogap break-junctions Nanotechnology 23 275502. - PMC - PubMed
    1. Yuan Z, Wang C, Yi X, Ni Z, Chen Y and Li T 2018. Solid-state nanopore Nanoscale Res. Lett 13 56. - PMC - PubMed