. 2020 Oct 5;21(19):7361.
doi: 10.3390/ijms21197361.

The Anaerobic Product Ethanol Promotes Autophagy-Dependent Submergence Tolerance in Arabidopsis

Affiliations

The Anaerobic Product Ethanol Promotes Autophagy-Dependent Submergence Tolerance in Arabidopsis

Li-Bing Yuan et al. Int J Mol Sci. .

Abstract

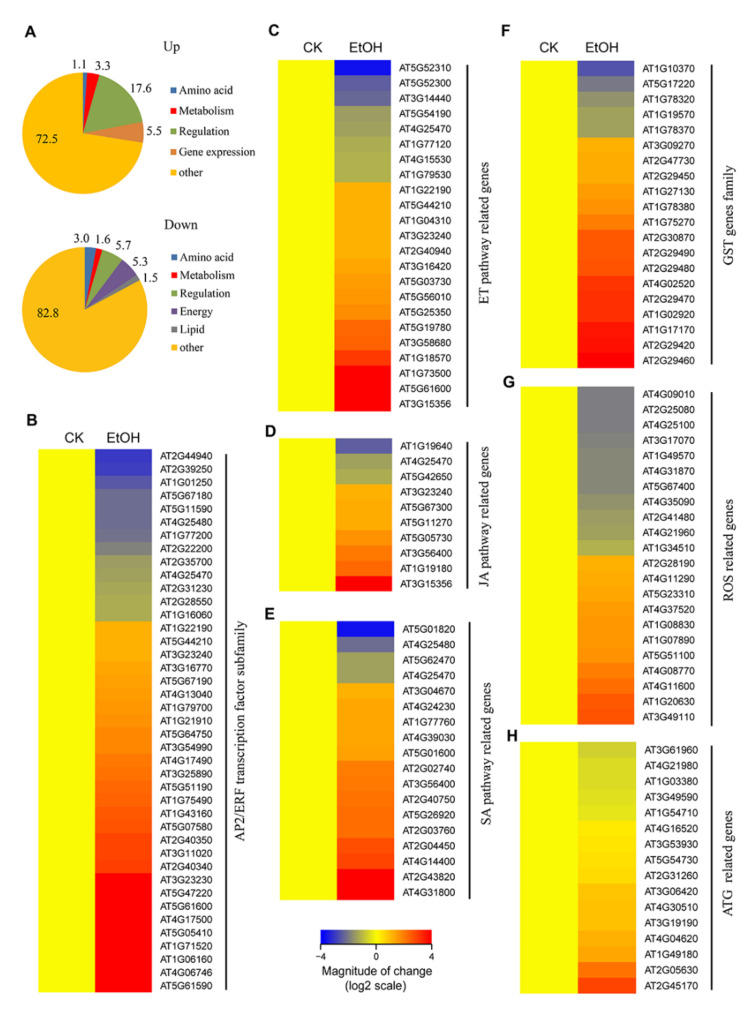
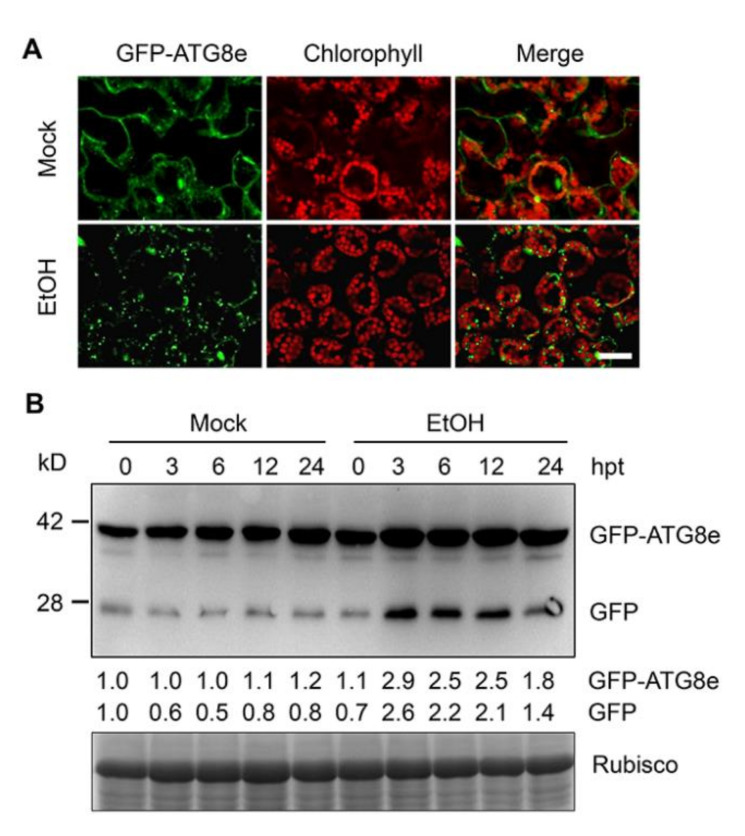
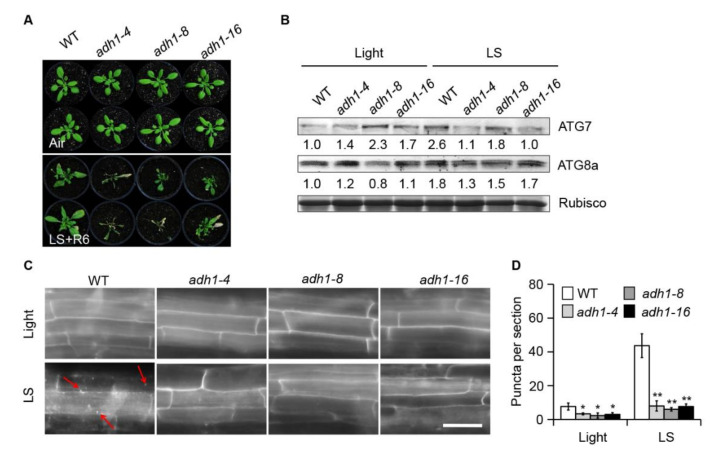
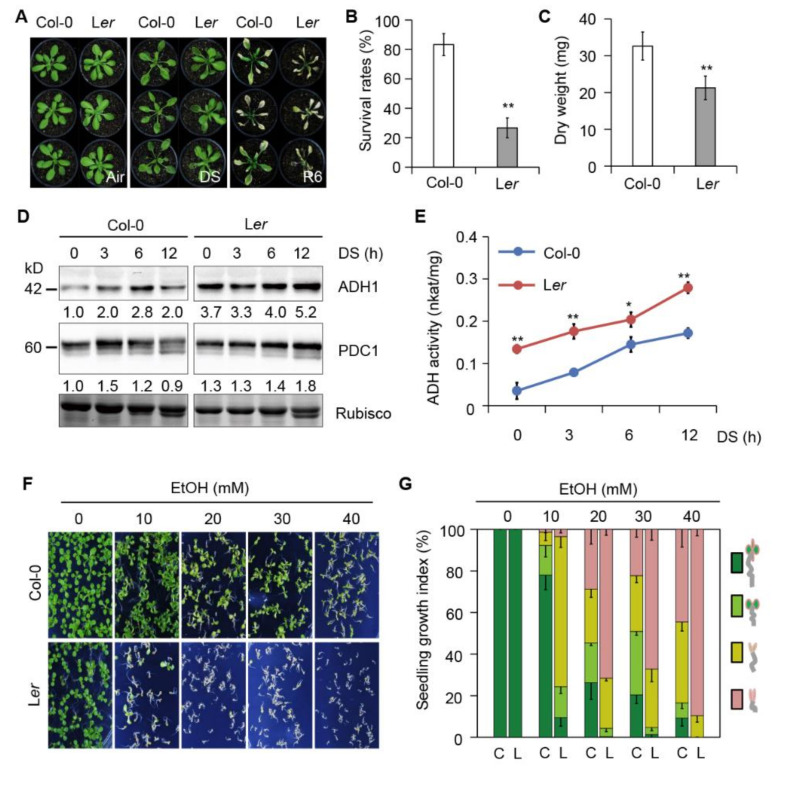
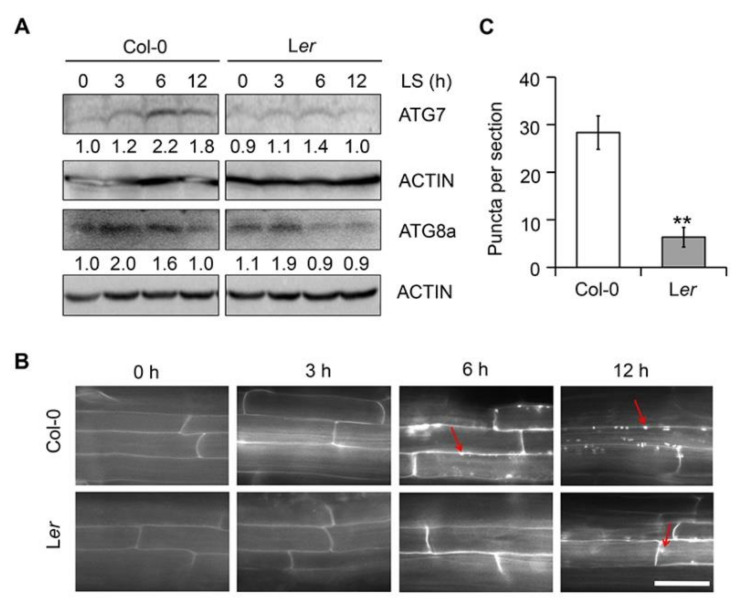
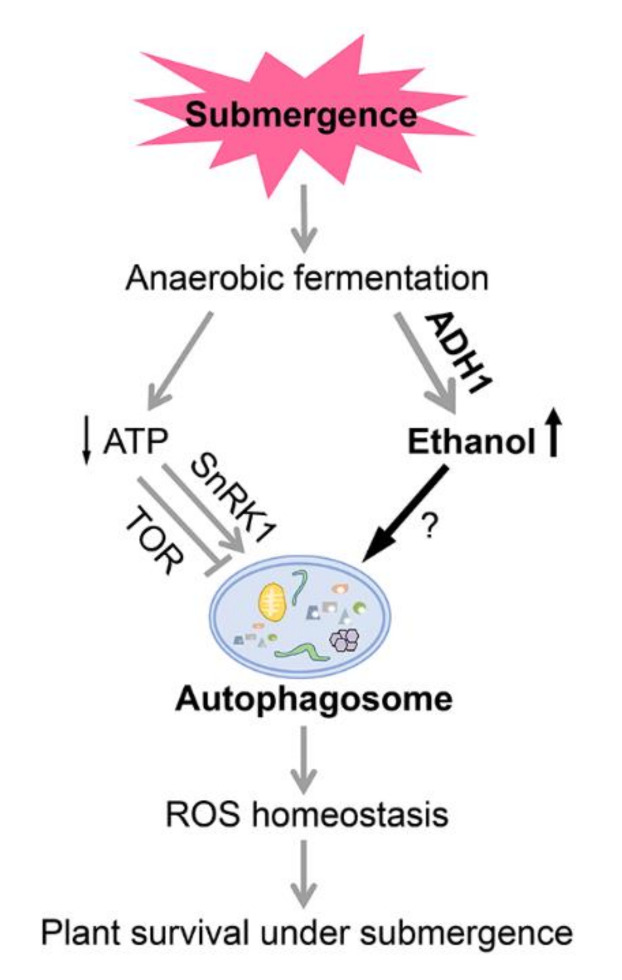
In response to hypoxia under submergence, plants switch from aerobic respiration to anaerobic fermentation, which leads to the accumulation of the end product, ethanol. We previously reported that Arabidopsis thaliana autophagy-deficient mutants show increased sensitivity to ethanol treatment, indicating that ethanol is likely involved in regulating the autophagy-mediated hypoxia response. Here, using a transcriptomic analysis, we identified 3909 genes in Arabidopsis seedlings that were differentially expressed in response to ethanol treatment, including 2487 upregulated and 1422 downregulated genes. Ethanol treatment significantly upregulated genes involved in autophagy and the detoxification of reactive oxygen species. Using transgenic lines expressing AUTOPHAGY-RELATED PROTEIN 8e fused to green fluorescent protein (GFP-ATG8e), we confirmed that exogenous ethanol treatment promotes autophagosome formation in vivo. Phenotypic analysis showed that deletions in the alcohol dehydrogenase gene in adh1 mutants result in attenuated submergence tolerance, decreased accumulation of ATG proteins, and diminished submergence-induced autophagosome formation. Compared to the submergence-tolerant Arabidopsis accession Columbia (Col-0), the submergence-intolerant accession Landsberg erecta (Ler) displayed hypersensitivity to ethanol treatment; we linked these phenotypes to differences in the functions of ADH1 and the autophagy machinery between these accessions. Thus, ethanol promotes autophagy-mediated submergence tolerance in Arabidopsis.

Keywords: ADH1; autophagy; ethanol; hypoxia; submergence.


Conflict of interest statement

The authors declare no conflict of interest.

Figures

Figure 1
Figure 1
Differentially expressed genes in response to ethanol treatment. (A) Functional annotation of 2487 upregulated and 1422 downregulated genes after ethanol treatment. (B) Hierarchical clustering of differentially expressed ethanol-responsive genes from the AP2/ERF transcription factor subfamily. (C,E) Hierarchical clustering of differentially expressed ethanol-responsive genes from the ethylene (ET, C), jasmonic acid (JA, D), and salicylic acid (SA, E) biosynthesis and signaling pathways. (F,H) Hierarchical clustering of differentially expressed ethanol-responsive genes from the glutathione S-transferase (GST, F) gene family, reactive oxygen species (ROS, G)- and autophagy (ATG, H)-related genes. The log2 fold change values of the transcriptional profiles were calculated using the R program heatmap 2.0. Red and blue represent up- and downregulated genes, respectively. Differentially expressed genes were identified based on the criteria FDR < 0.005 and FC ≥ 1.5 or FC ≤ 0.67.
Figure 2
Figure 2
Induction of autophagy by ethanol treatment. (A) Confocal analysis of changes in transgenic lines expressing autophagy-related protein 8e fused to green fluorescent protein (GFP-ATG8e) in leaf cells in response to ethanol treatment. Leaves of 4-week-old GFP-ATG8e transformants were detached and immersed in 100 mM ethanol or water for 6 h, and GFP-ATG8e was visualized by fluorescence confocal microscopy. Bar, 50 µm. (B) Immunoblot analysis showing the free GFP generated from GFP-ATG8e fusion protein upon ethanol treatment. Detached leaves from 4-week-old GFP-ATG8e plants were immersed in 100 mM ethanol or water, and leaves were collected at 0, 3, 6, 12, and 24 h after treatment. Anti-GFP antibodies were used for immunoblotting. Coomassie blue-stained total proteins are shown at the bottom to indicate the amount of protein loaded per lane. Numbers below the protein bands indicate relative gray values of the bands. The numbers on the left indicate the molecular mass (kD) of the size markers. hpt, hours post-treatment.
Figure 3
Figure 3
Loss of function of ADH1 attenuates submergence tolerance and autophagosome formation. (A) Phenotypes of 4-week-old wild-type (WT), adh1-4, adh1-8, and adh1-16 plants before treatment (Air) and following 6 d of recovery after 7 d of light (normal light/dark cycle) submergence (LS) treatment (LS+R6). (B) ATG7 and ATG8a protein levels in 4-week-old WT, adh1-4, adh1-8, and adh1-16 plants before treatment (Light) and after 24 h of LS treatment. Coomassie blue-stained total proteins are shown below the blots to indicate the amount of protein loaded per lane. (C) Monodansylcadaverine (MDC) staining of mature root cells from one-week-old WT, adh1-4, adh1-8, and adh1-16 seedlings under normal light/dark (Light) conditions or following 24 h of LS treatment. Red arrows indicate labeled autophagosomes. Bars = 50 µm. (D) Number of puncta per root section in mature root cells from the WT, adh1-4, adh1-8, and adh1-16 seedlings shown in (C). Data are average values ± SD of three biological replicates. For each experiment, 15 sections were analyzed per genotype. Asterisks represent significant differences between WT and adh1 samples, as determined by Student’s t-test (* p < 0.05 and ** p < 0.01).
Figure 4
Figure 4
Two Arabidopsis accessions with different levels of submergence tolerance show different responses to ethanol. (A) Phenotypes of 4-week-old Columbia (Col-0) and Landsberg erecta (Ler) plants before submergence (Air) and after 60 h of dark submergence (DS), followed by recovery for 6 d (R6). The experiments were repeated three times with similar results. (B) and (C) survival rate (B) and dry weights (C) of Col-0 and Ler plants after DS treatment followed by recovery for 6 d. Data are means (± SD) of three biological replicates. For each biological repetition, 15 plants were used per accession. Asterisks indicate significant differences between Col-0 and Ler, as determined by Student’s t-test (** P < 0.01). (D) Protein abundance of ADH1 and PDC1 in 4-week-old Col-0 and Ler plants treated with dark submergence (DS) at various time points. Numbers below the protein bands indicate relative gray values of the bands. Coomassie blue-stained Rubisco is shown as a loading control. The experiments were repeated three times with similar results. (E) Measurement of alcohol dehydrogenase (ADH) activity in 2-week-old Col-0 and Ler plants after dark submergence (DS) treatment for 0, 3, 6, and 12 h. The experiments were biologically repeated three times with similar results. Error bars represent SD (n = 3 technical replicates). Asterisks indicate significant difference between Col-0 and Ler, as determined by Student’s t-test (* p < 0.05 and ** p < 0.01). (F) Col-0 and Ler seedlings grown on MS medium supplemented with different concentrations of ethanol. Images were taken 10 d after germination. The experiments were repeated three times with similar results. (G) Seedling growth index in (F). The colors in the columns correspond to seedlings with true leaves (dark green), seedlings with green (light green) or brown (yellow) cotyledons, and etiolated seedlings (pink). Data are means (± SD) of three biological replicates. C, Col-0; L, Ler.
Figure 5
Figure 5
Autophagosome formation in two Arabidopsis accessions in response to submergence. (A) Protein abundance of ATG7 and ATG8a in one-week-old Col-0 and Ler seedlings treated with light submergence (LS) at various time points. Numbers below the protein bands indicate relative gray values of the bands. Actin bands are shown below the blots to indicate the amount of protein loaded per lane. The experiments were repeated three times with similar results. (B) MDC staining of root cells from one-week-old Col-0 and Ler seedlings treated with light submergence (LS) at various time points. Red arrows indicate labeled autophagosomes. The experiments were repeated three times with similar results. Bars = 50 µm. (C) Number of puncta per root section in mature root cells of one-week-old Col-0 and Ler seedlings following LS treatment for 12 h in (B). Data are average values ± SD of three biological replicates. For each experiment, 15 sections were analyzed per accession. Asterisks indicate significant differences between Col-0 and Ler, as determined by Student’s t-test (** p < 0.01).
Figure 6
Figure 6
Proposed model for the role of ethanol-induced autophagy in regulating plant responses to submergence. Submergence causes hypoxia, which leads to deficiencies in cellular energy and carbohydrate shortages in plants. To survive hypoxic stress, plant cells switch from aerobic respiration to anaerobic fermentation, especially ethanolic fermentation. In this context, ADH1 (alcohol dehydrogenase1) activity increases rapidly in plant cells, resulting in the accumulation of ethanol. The increased ethanol levels promote autophagosome formation, which modulates hypoxia responses and facilitates plant survival by regulating ROS homeostasis, although the precise mechanism remains to be elucidated. By contrast, anaerobic fermentation produces much less ATP than aerobic respiration. The TOR (target of rapamycin) pathway and SnRK1 (Snf1-related protein kinase 1) play opposite roles in regulating autophagy in response to energy limitation. The energy sensor SnRK1 is activated under hypoxia stress and acts as a positive regulator of autophagy, whereas the negative effect of the TOR pathway on autophagy is repressed, ultimately improving plant survival following submergence.

References

    1. Bailey-Serres J., Fukao T., Gibbs D.J., Holdsworth M.J., Lee S.C., Licausi F., Perata P., Voesenek L.A.C.J., van Dongen J.T. Making sense of low oxygen sensing. Trends Plant Sci. 2012;17:129–138. doi: 10.1016/j.tplants.2011.12.004. - DOI - PubMed
    1. Voesenek L.A.C.J., Bailey-Serres J. Flood adaptive traits and processes: An overview. New Phytol. 2015;206:57–73. doi: 10.1111/nph.13209. - DOI - PubMed
    1. Bailey-Serres J., Lee S.C., Brinton E. Waterproofing crops: Effective flooding survival strategies. Plant Physiol. 2012;160:1698–1709. doi: 10.1104/pp.112.208173. - DOI - PMC - PubMed
    1. Sasidharan R., Bailey-Serres J., Ashikari M., Atwell B.J., Colmer T.D., Fagerstedt K., Fukao T., Geigenberger P., Hebelstrup K.H., Hill R.D., et al. Community recommendations on terminology and procedures used in flooding and low oxygen stress research. New Phytol. 2017;214:1403–1407. doi: 10.1111/nph.14519. - DOI - PubMed
    1. Voesenek L.A.C.J., Colmer T.D., Pierik R., Millenaar F.F., Peeters A.J.M. How plants cope with complete submergence. New Phytol. 2006;170:213–226. doi: 10.1111/j.1469-8137.2006.01692.x. - DOI - PubMed

MeSH terms

LinkOut - more resources