

Silencing p53 inhibits interleukin 10-induced activated hepatic stellate cell senescence and fibrotic degradation in vivo
- PMID: 33028080
- PMCID: PMC7885051
- DOI: 10.1177/1535370220960391
Silencing p53 inhibits interleukin 10-induced activated hepatic stellate cell senescence and fibrotic degradation in vivo
Abstract
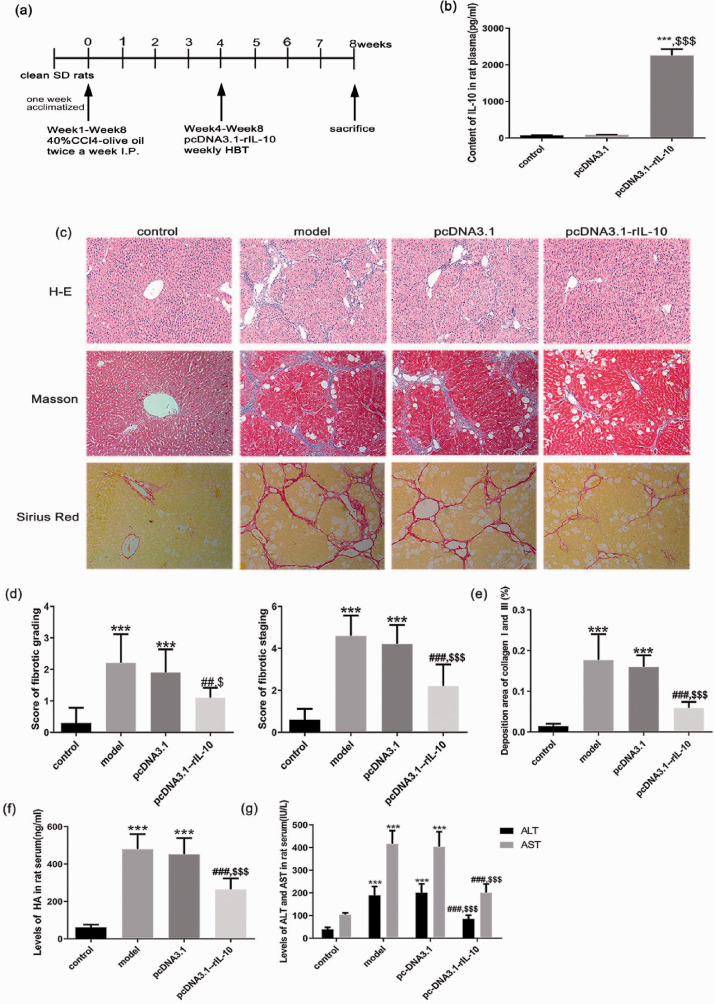
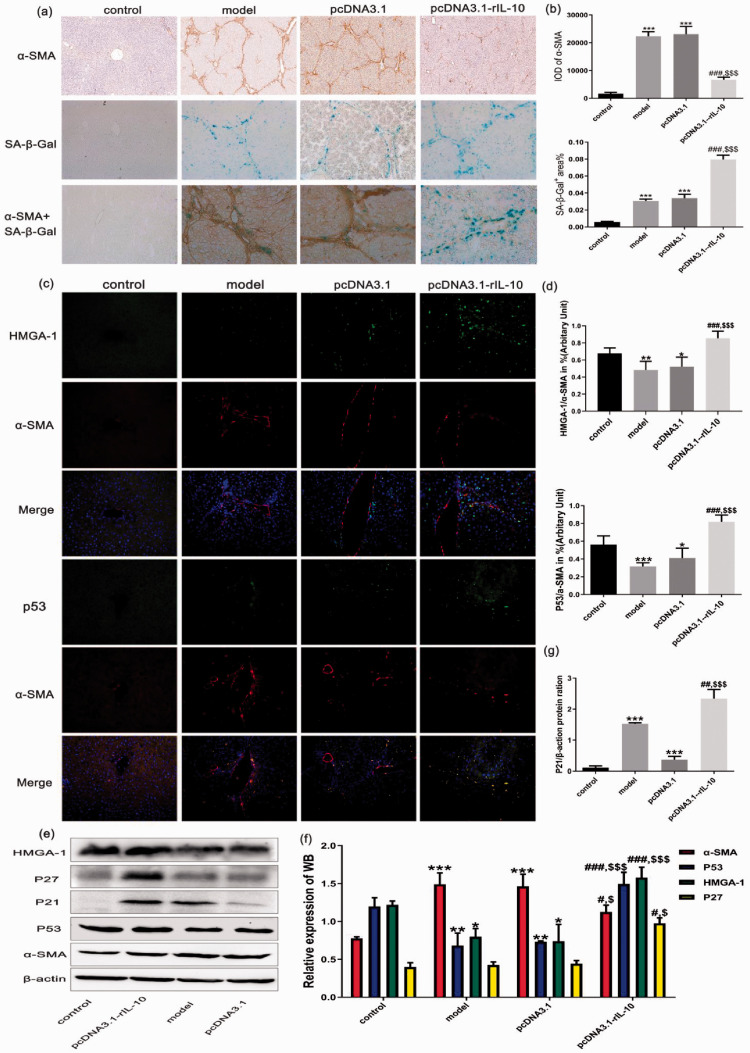
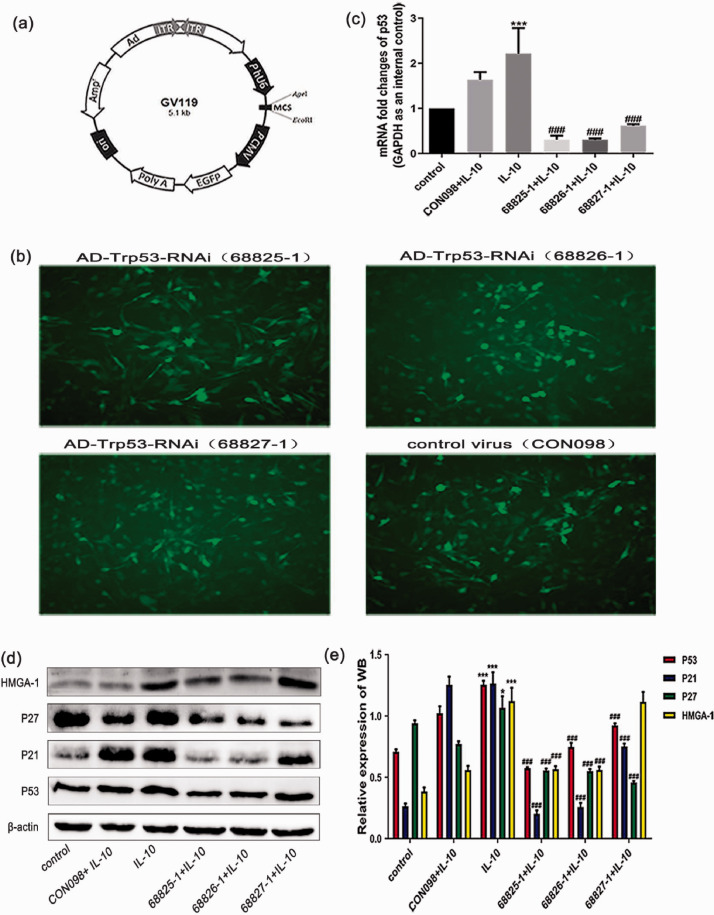
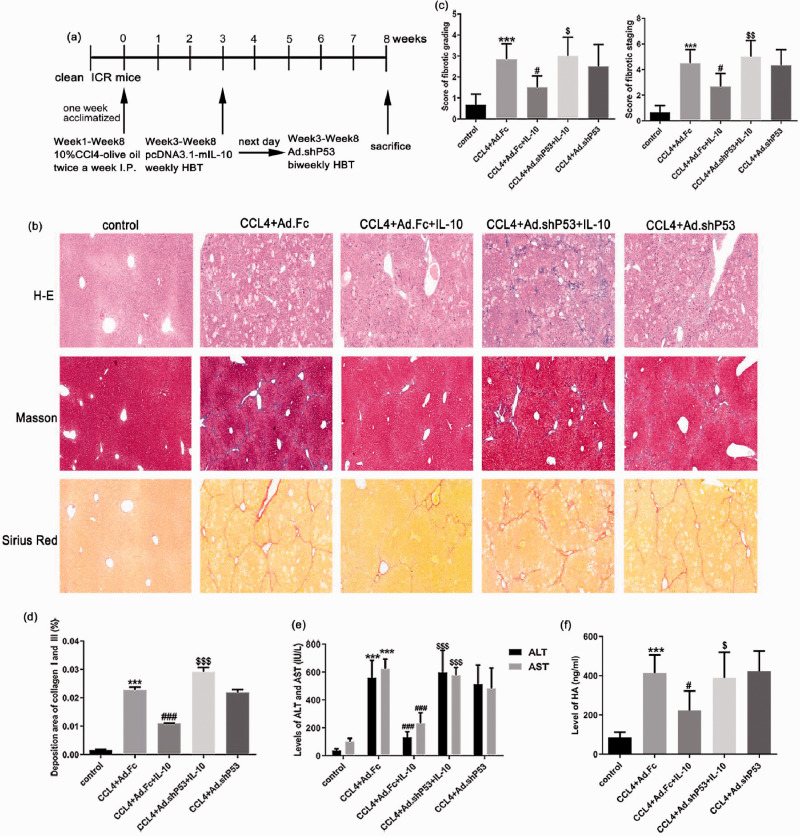
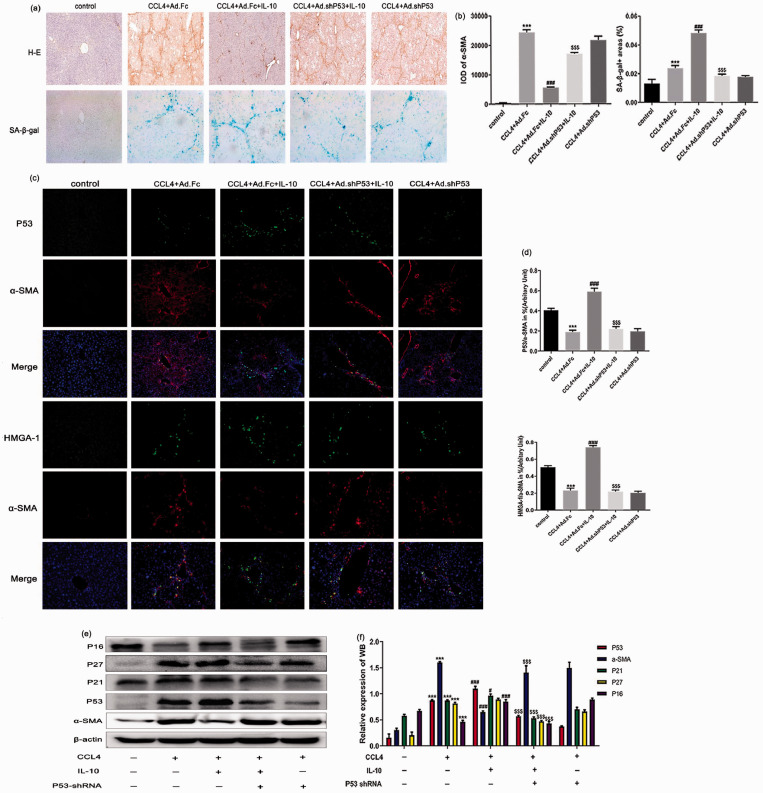
Activated hepatic stellate cells are reported to play a significant role in liver fibrogenesis. Beside the phenotype reversion and apoptosis of activated hepatic stellate cells, the senescence of activated hepatic stellate cells limits liver fibrosis. Our previous researches have demonstrated that interleukin-10 could promote hepatic stellate cells senescence via p53 signaling pathway in vitro. However, the relationship between expression of p53 and senescence of activated hepatic stellate cells induced by interleukin-10 in fibrotic liver is unclear. The purpose of present study was to explore whether p53 plays a crucial role in the senescence of activated hepatic stellate cells and degradation of collagen mediated by interleukin-10. Hepatic fibrosis animal model was induced by carbon tetrachloride through intraperitoneal injection and transfection of interleukin-10 gene to liver was performed by hydrodynamic-based transfer system. Depletions of p53 in vivo and in vitro were carried out by adenovirus-based short hairpin RNA against p53. Regression of fibrosis was assessed by liver biopsy and collagen staining. Cellular senescence in the liver was observed by senescence-associated beta-galactosidase (SA-β-Gal) staining. Immunohistochemistry, immunofluorescence double staining, and Western blot analysis were used to evaluate the senescent cell and senescence-related protein expression. Our data showed that interleukin-10 gene treatment could lighten hepatic fibrosis induced by carbon tetrachloride and induce the aging of activated hepatic stellate cells accompanied by up-regulating the expression of aging-related proteins. We further demonstrated that depletion of p53 could abrogate up-regulation of interleukin-10 on the expression of senescence-related protein in vivo and vitro. Moreover, p53 knockout in fibrotic mice could block not only the senescence of activated hepatic stellate cells, but also the degradation of fibrosis induced by interleukin-10 gene intervention. Taken together, our results suggested that interleukin-10 gene treatment could attenuate carbon tetrachloride-induced hepatic fibrosis by inducing senescence of activated hepatic stellate cells in vivo, and this induction was closely related to p53 signaling pathway.
Keywords: Interleukin 10; gene therapy; hepatic stellate cells; liver fibrosis; p53; senescence.
Figures
Similar articles
-
Interleukin-10 induces senescence of activated hepatic stellate cells via STAT3-p53 pathway to attenuate liver fibrosis.Cell Signal. 2020 Feb;66:109445. doi: 10.1016/j.cellsig.2019.109445. Epub 2019 Nov 12. Cell Signal. 2020. PMID: 31730896
-
Activation of PPARγ/P53 signaling is required for curcumin to induce hepatic stellate cell senescence.Cell Death Dis. 2016 Apr 14;7(4):e2189. doi: 10.1038/cddis.2016.92. Cell Death Dis. 2016. PMID: 27077805 Free PMC article.
-
IGF-I induces senescence of hepatic stellate cells and limits fibrosis in a p53-dependent manner.Sci Rep. 2016 Oct 10;6:34605. doi: 10.1038/srep34605. Sci Rep. 2016. PMID: 27721459 Free PMC article.
-
Hepatic stellate cell senescence in liver fibrosis: Characteristics, mechanisms and perspectives.Mech Ageing Dev. 2021 Oct;199:111572. doi: 10.1016/j.mad.2021.111572. Epub 2021 Sep 16. Mech Ageing Dev. 2021. PMID: 34536446 Review.
-
Molecular interplays in hepatic stellate cells: apoptosis, senescence, and phenotype reversion as cellular connections that modulate liver fibrosis.Cell Biol Int. 2017 Sep;41(9):946-959. doi: 10.1002/cbin.10790. Epub 2017 Jul 20. Cell Biol Int. 2017. PMID: 28498509 Review.
Cited by
-
IL-10 deficiency aggravates cell senescence and accelerates BLM-induced pulmonary fibrosis in aged mice via PTEN/AKT/ERK pathway.BMC Pulm Med. 2024 Sep 11;24(1):443. doi: 10.1186/s12890-024-03260-x. BMC Pulm Med. 2024. PMID: 39261827 Free PMC article.
-
Hydrodynamic Delivery: Characteristics, Applications, and Technological Advances.Pharmaceutics. 2023 Mar 31;15(4):1111. doi: 10.3390/pharmaceutics15041111. Pharmaceutics. 2023. PMID: 37111597 Free PMC article. Review.
-
Bioinformatics Analysis of Common Genetic and Molecular Traits and Association of Portal Hypertension with Pulmonary Hypertension.J Healthc Eng. 2022 Oct 20;2022:9237701. doi: 10.1155/2022/9237701. eCollection 2022. J Healthc Eng. 2022. PMID: 36312597 Free PMC article.
-
Cellular Senescence in Hepatocellular Carcinoma: The Passenger or the Driver?Cells. 2022 Dec 29;12(1):132. doi: 10.3390/cells12010132. Cells. 2022. PMID: 36611926 Free PMC article. Review.
-
Navigating the complex role of senescence in liver disease.Chin Med J (Engl). 2024 Dec 20;137(24):3061-3072. doi: 10.1097/CM9.0000000000003439. Epub 2024 Dec 16. Chin Med J (Engl). 2024. PMID: 39679454 Free PMC article. Review.
References
-
- Gur C, Doron S, Kfir-Erenfeld S, Horwitz E, Abu-Tair L, Safadi R, Mandelboim O. NKp46-mediated killing of human and mouse hepatic stellate cells attenuates liver fibrosis. Gut 2012; 61:885–93 - PubMed
-
- Kong D, Zhang F, Zhang Z, Zhang S. Clearance of activated stellate cells for hepatic fibrosis regression: molecular basis and translational potential. Biomed Pharmacother 2013; 67:246–50 - PubMed
-
- Jin H, Jia Y, Yao Z, Huang J, Hao M, Yao S, Lian N, Zhang F, Zhang C, Chen X, Bian M, Shao J, Wu L, Chen A, Zheng S. Hepatic stellate cell interferes with NK cell regulation of fibrogenesis via curcumin induced senescence of hepatic stellate cell. Cell Signal 2017; 33:79–85 - PubMed
Publication types
MeSH terms
Substances
LinkOut - more resources
Full Text Sources
Medical
Research Materials
Miscellaneous