. 2020 Oct 7;13(1):134.
doi: 10.1186/s13041-020-00667-5.

Fear response-based prediction for stress susceptibility to PTSD-like phenotypes

Affiliations

Fear response-based prediction for stress susceptibility to PTSD-like phenotypes

Min-Jae Jeong et al. Mol Brain. .

Abstract

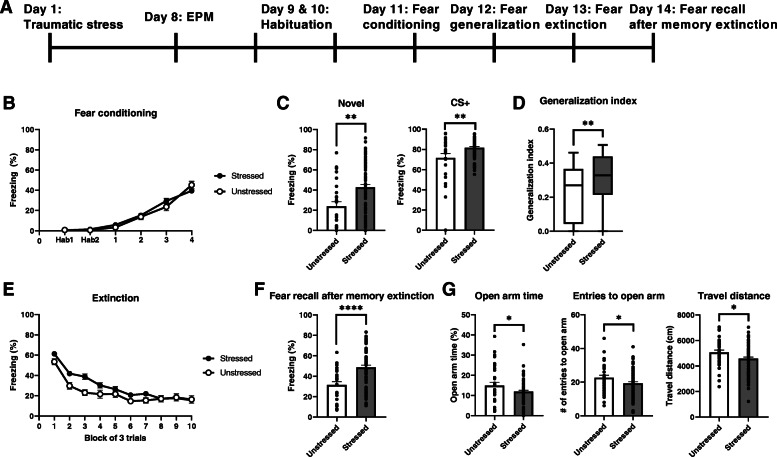
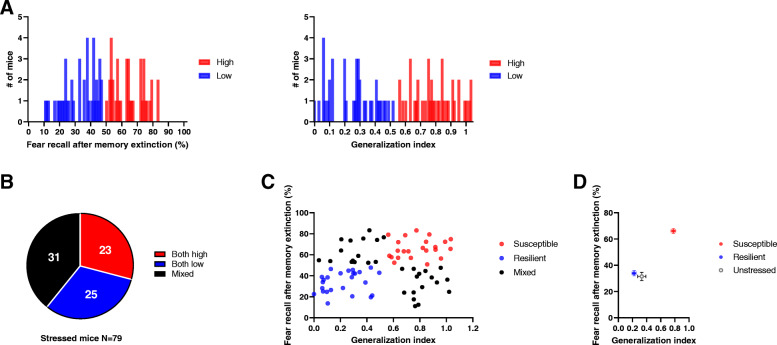
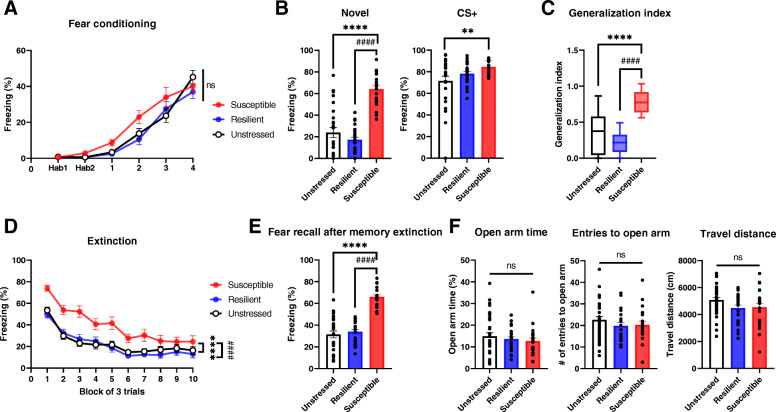
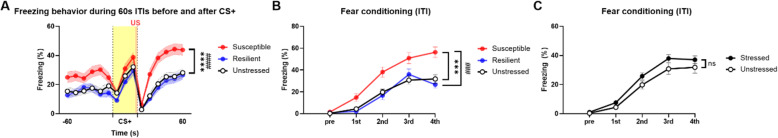
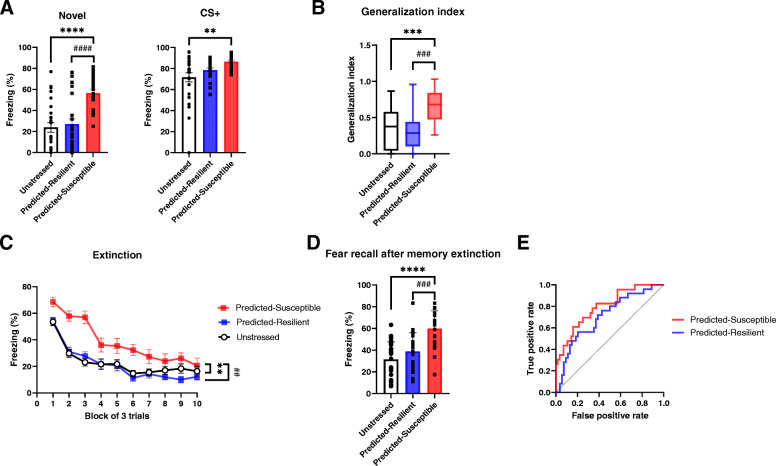
Most individuals undergo traumatic stresses at some points in their life, but only a small proportion develop stress-related disorders such as anxiety diseases and posttraumatic stress disorder (PTSD). Although stress susceptibility is one determinant of mental disorders, the underlying mechanisms and functional implication remain unclear yet. We found that an increased amount of freezing that animals exhibited in the intertrial interval (ITI) of a stress-enhanced fear learning paradigm, predicts ensuing PTSD-like symptoms whereas resilient mice show ITI freezing comparable to that of unstressed mice. To examine the behavioral features, we developed a systematic analytical approach for ITI freezing and stress susceptibility. Thus, we provide a behavioral parameter for prognosis to stress susceptibility of individuals in the development of PTSD-like symptoms as well as a new mathematical means to scrutinize freezing behavior.

Keywords: Fear conditioning; ITI; PTSD; Stress.


Conflict of interest statement

The authors declare that they have no competing interests.

Figures

Fig. 1
Fig. 1
Acute traumatic stress increases anxious behaviors and fear responses. a A schematic of the behavioral test. Restraint and tail shock stresses are used as the traumatic stressor. 7 days later, anxiety levels are examined with an EPM test. Fear conditioning, fear generalization, fear extinction, and fear recall after memory extinction are then assessed sequentially. b Freezing responses of unstressed control (n = 26) and stressed (n = 79) mice during fear conditioning (two-way repeated measures ANOVA). c-d Fear generalization test. c Stressed mice show significantly enhanced freezing responses to a novel cue (left) and a CS (right) compared with those of unstressed control mice. d Generalization indices, calculated as the ratios of freezing responses to the novel cue and to the CS, are significantly higher in stressed mice than in control mice. **P < 0.01 (unpaired t test). e Freezing responses during extinction training are comparable between the two groups (two way repeated measures ANOVA). f Stressed mice show significantly increased freezing after extinction training. ****P < 0.0001 (unpaired t test). g EPM data from stressed and unstressed control mice. Stressed mice spend significantly less time in the open arms than control mice (left). Stressed mice make significantly fewer entries into open arms than controls (middle). Travel distances significantly differ between two groups (right). *P < 0.05; ns, not significant (unpaired t tests). Plots show means ± SEMs
Fig. 2
Fig. 2
Classification of stressed mice through indices of fear generalization and extinction resistance. a K-means clustering analysis of freezing responses that stressed mice (n = 79) display one day after extinction training. Red, high, 38 mice; blue, low, 41 mice (left). K-means clustering analysis of generalization indices of stressed mice (n = 79). Red, high, 39 mice; blue, low, 40 mice (right). b Distribution of mice clustered and denoted as “both high” from fear recall and generalization indices (n = 23 mice [29.11%]), “both low” from both (n = 25 mice [31.65%]), and “mixed” for opposite results from two indices (n = 31 mice [39.24%]). c K-means clustering analysis using fear recall and generalization indices show distinct distributions of susceptible mice (red, both high), resilient mice (blue, both low), and nonallocated mice (black, mixed). d Distributions of fear recall and generalization indices for susceptible, resilient, and unstressed control mice (means ± SEMs)
Fig. 3
Fig. 3
Similar anxiety levels but increased fear responses from susceptible mice. a Freezing responses to CS during fear conditioning are similar among groups (two-way repeated measures ANOVA). b-c Susceptible mice exhibit enhanced fear generalization. b Susceptible mice show increased freezing responses to the novel cue compared with those of resilient and unstressed mice (left) and increased freezing responses to the CS compared with those of unstressed mice but not resilient ones (right). c Generalization indices of susceptible mice are significantly higher than those of the other groups. **P < 0.01, ****P < 0.0001, ####P < 0.0001 (one-way ANOVAs). d Fear extinction is significantly impaired in susceptible mice. ****P < 0.0001, ####P < 0.0001 (two-way repeated measures ANOVA, Tukey’s test). e Susceptible mice exhibit increased freezing responses 24 h after memory extinction compared with those of other groups. ****P < 0.0001, ####P < 0.0001 (one-way ANOVA). f All groups exhibit comparable anxious behaviors in the EPM for times spent in open arms (left), numbers of entries into open arms (middle), and the travel distance (right) (one-way ANOVAs). Plots show means ± SEMs
Fig. 4
Fig. 4
Stress exposure results in increased freezing in the ITI during fear conditioning only in susceptible mice. a Susceptible mice exhibit enhanced freezing 60 s before and 60 s after CS presentation compared with that by unstressed and resilient mice. Those data are mean values of freezing responses from 4 trials of 60 s before and 60 s after CS-US pairing. US was presented and co-terminated with CS. ****P < 0.0001, ####P < 0.0001 (two-way repeated measures ANOVA, Tukey’s test). b Susceptible mice exhibit increased freezing responses compared with those by unstressed and resilient mice in the ITI. ***P < 0.001, ###P < 0.001 (two-way repeated measures ANOVA, Tukey’s test). c Stressed mice exhibit comparable freezing responses in ITI to those by unstressed control mice. ns, not significant (two-way repeated measures ANOVA). Plots show means ± SEMs
Fig. 5
Fig. 5
Validation of the prediction model for stress susceptibility to PTSD-like behaviors. a-b Freezing responses during the fear generalization test. a Predicted-susceptible mice show increased freezing to a novel cue compared with that by unstressed control and predicted resilient mice (left). Predicted-susceptible mice show increased freezing responses to the CS compared with those by control mice but not predicted-resilient ones (right). b Predicted-susceptible mice show increases in generalization indices compared with those for control and predicted-resilient mice. **P < 0.01, ***P < 0.001, ****P < 0.0001, ###P < 0.001, ####P < 9 0.0001 (one-way ANOVA, Tukey’s test). c Predicted-susceptible mice show increased freezing responses during extinction training compared with those by unstressed control and predicted-resilient mice. **P < 0.01, ##P < 0.01 (two-way repeated measures ANOVA, Tukey’s test). d Predicted-susceptible mice exhibit enhanced freezing responses 24 h after extinction training compared with those by unstressed control and predicted resilient mice. ****P < 15 0.0001, ###P < 0.001 (one-way ANOVA, Tukey’s test). e ROC curves for predicted-susceptible and predicted-16 resilient mice. The AUC for the predicted-susceptible group is 0.7950 (95% confidence interval, 0.6884–0.9017; ****P < 0.0001) and that for predicted-resilient group is 0.7067 (95% confidence interval, 0.5845–0.8288; **P < 0.01)

References

    1. Alyssa Boasso, Maria Steenkamp, William Nash, Jonathan Larson BL. The relationship between course of PTSD symptoms in deployed U.S. Marines and degree of combat exposure. J Trauma Stress. 2015;28:73–8. - PubMed
    1. Delahanty DL, Raimonde AJ, Spoonster E, Cullado M. Injury severity, prior trauma history, urinary cortisol levels, and acute PTSD in motor vehicle accident victims. J Anxiety Disord. 2003;17:149–164. doi: 10.1016/S0887-6185(02)00185-8. - DOI - PubMed
    1. American Psychiatric Association. Diagnostic and Statistical Manual of Mental Disorders, Fifth Edition. Washington, DC: Am Psychiatr Assoc; 2013.
    1. Siegmund A, Wotjak CT. Toward an animal model of posttraumatic stress disorder. Ann N Y Acad Sci. 2006;1071:324–334. doi: 10.1196/annals.1364.025. - DOI - PubMed
    1. Kessler RC, Sonnega A, Bromet E, Hughes M, Nelson SB. Posttraumatic stress disorder in the national comorbidity survey. Arch Gen Psychiatry Psychiatry. 1995;52:1048–1060. doi: 10.1001/archpsyc.1995.03950240066012. - DOI - PubMed

Publication types