

Spatial localization of charged molecules by salt ions in oil-confined water microdroplets
- PMID: 33028513
- PMCID: PMC7541078
- DOI: 10.1126/sciadv.aba0181
Spatial localization of charged molecules by salt ions in oil-confined water microdroplets
Abstract
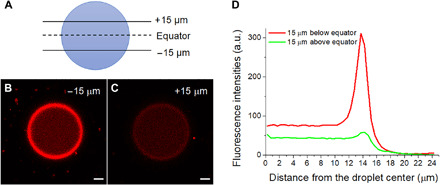
Cells contain more than 100 mM salt ions that are typically confined to dimensions of 5 to 10 micrometers by a hydrophobic cellular membrane. We found that in aqueous microdroplets having the same size as cells and that are confined in hydrocarbon oil, negatively charged molecules were distributed rather uniformly over the interior of the microdroplet, whereas positively charged molecules were localized at and near the surface. However, the addition of salt (NaCl) to the microdroplet caused all charged molecules to be localized near the oil-water interface. This salt-induced relocalization required less salt concentration in microdroplets compared to bulk water. Moreover, the localization became more prominent as the size of the microdroplet was reduced. The relocatization also critically depended on the type of oil. Our results imply that salt ions and different hydrophobic interfaces together may govern the local distribution of charged biomolecules in confined intracellular environments.
Copyright © 2020 The Authors, some rights reserved; exclusive licensee American Association for the Advancement of Science. No claim to original U.S. Government Works. Distributed under a Creative Commons Attribution NonCommercial License 4.0 (CC BY-NC).
Figures


Similar articles
-
Strong Concentration Enhancement of Molecules at the Interface of Aqueous Microdroplets.J Phys Chem B. 2020 Nov 5;124(44):9938-9944. doi: 10.1021/acs.jpcb.0c07718. Epub 2020 Oct 21. J Phys Chem B. 2020. PMID: 33084345
-
Simple model for the electric field and spatial distribution of ions in a microdroplet.J Chem Phys. 2020 May 14;152(18):184702. doi: 10.1063/5.0006550. J Chem Phys. 2020. PMID: 32414270 Free PMC article.
-
Exploration of the presence of bulk-like water in AOT reverse micelles and water-in-oil nanodroplets: the role of charged interfaces, confinement size and properties of water.Phys Chem Chem Phys. 2016 Aug 21;18(31):21767-79. doi: 10.1039/c6cp04378j. Epub 2016 Jul 20. Phys Chem Chem Phys. 2016. PMID: 27435512
-
Water-Microdroplet-Driven Interface-Charged Chemistries.JACS Au. 2024 Nov 1;4(11):4141-4147. doi: 10.1021/jacsau.4c00804. eCollection 2024 Nov 25. JACS Au. 2024. PMID: 39610748 Free PMC article. Review.
-
Organic Reactions in Microdroplets: Reaction Acceleration Revealed by Mass Spectrometry.Angew Chem Int Ed Engl. 2016 Oct 10;55(42):12960-12972. doi: 10.1002/anie.201602270. Angew Chem Int Ed Engl. 2016. PMID: 27530279 Review.
Cited by
-
Enzyme-photo-coupled catalysis in gas-sprayed microdroplets.Chem Sci. 2022 Jun 24;13(28):8341-8348. doi: 10.1039/d2sc02791g. eCollection 2022 Jul 20. Chem Sci. 2022. PMID: 35919726 Free PMC article.
-
Enhanced Biphasic Reactions in Amphiphilic Silica Mesopores.J Phys Chem C Nanomater Interfaces. 2024 Jan 18;128(4):1644-1653. doi: 10.1021/acs.jpcc.3c07477. eCollection 2024 Feb 1. J Phys Chem C Nanomater Interfaces. 2024. PMID: 38322775 Free PMC article.
-
The Spontaneous Electron-Mediated Redox Processes on Sprayed Water Microdroplets.JACS Au. 2023 May 25;3(6):1563-1571. doi: 10.1021/jacsau.3c00191. eCollection 2023 Jun 26. JACS Au. 2023. PMID: 37388681 Free PMC article. Review.
-
Imaging of pH distribution inside individual microdroplet by stimulated Raman microscopy.Proc Natl Acad Sci U S A. 2023 May 16;120(20):e2219588120. doi: 10.1073/pnas.2219588120. Epub 2023 May 8. Proc Natl Acad Sci U S A. 2023. PMID: 37155894 Free PMC article.
-
Oxidation of Cysteine by Electrogenerated Hexacyanoferrate(III) in Microliter Droplets.Langmuir. 2022 Oct 4;38(39):11892-11898. doi: 10.1021/acs.langmuir.2c01385. Epub 2022 Sep 19. Langmuir. 2022. PMID: 36121813 Free PMC article.
References
-
- Fallah-Araghi A., Meguellati K., Baret J.-C., Harrak A. E., Mangeat T., Karplus M., Ladame S., Marques C. M., Griffiths A. D., Enhanced chemical synthesis at soft interfaces: a universal reaction-adsorption mechanism in microcompartments. Phys. Rev. Lett. 112, 028301 (2014). - PubMed
-
- Bain R. M., Pulliam C. J., Raab S. A., Cooks R. G., Chemical synthesis accelerated by paper spray: The haloform reaction. J. Chem. Educ. 93, 340–344 (2016).
Publication types
LinkOut - more resources
Full Text Sources
Other Literature Sources
