

Spatial and temporal variations in global soil respiration and their relationships with climate and land cover
- PMID: 33028522
- PMCID: PMC7541079
- DOI: 10.1126/sciadv.abb8508
Spatial and temporal variations in global soil respiration and their relationships with climate and land cover
Abstract
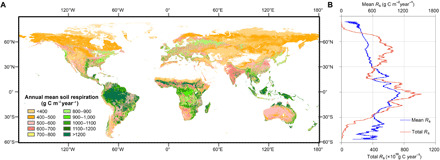
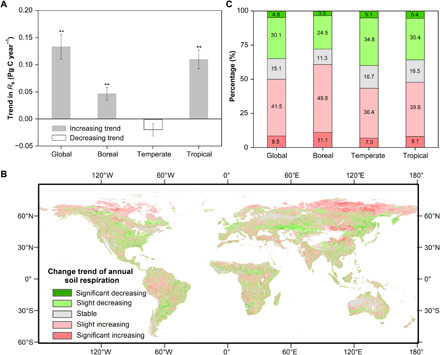
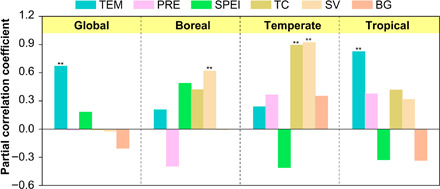
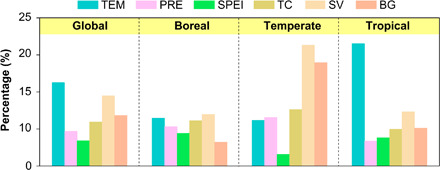
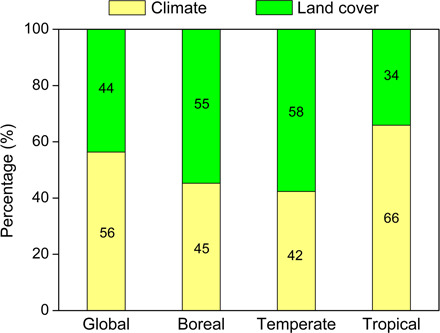
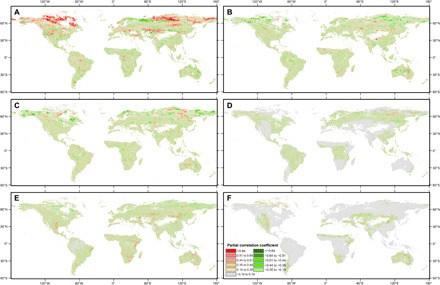
Soil respiration (R s) represents the largest flux of CO2 from terrestrial ecosystems to the atmosphere, but its spatial and temporal changes as well as the driving forces are not well understood. We derived a product of annual global R s from 2000 to 2014 at 1 km by 1 km spatial resolution using remote sensing data and biome-specific statistical models. Different from the existing view that climate change dominated changes in R s, we showed that land-cover change played a more important role in regulating R s changes in temperate and boreal regions during 2000-2014. Significant changes in R s occurred more frequently in areas with significant changes in short vegetation cover (i.e., all vegetation shorter than 5 m in height) than in areas with significant climate change. These results contribute to our understanding of global R s patterns and highlight the importance of land-cover change in driving global and regional R s changes.
Copyright © 2020 The Authors, some rights reserved; exclusive licensee American Association for the Advancement of Science. No claim to original U.S. Government Works. Distributed under a Creative Commons Attribution NonCommercial License 4.0 (CC BY-NC).
Figures
Similar articles
-
Extensive land cover change across Arctic-Boreal Northwestern North America from disturbance and climate forcing.Glob Chang Biol. 2020 Feb;26(2):807-822. doi: 10.1111/gcb.14804. Epub 2019 Sep 17. Glob Chang Biol. 2020. PMID: 31437337
-
Estimation of global soil respiration by accounting for land-use changes derived from remote sensing data.J Environ Manage. 2017 Sep 15;200:97-104. doi: 10.1016/j.jenvman.2017.05.076. Epub 2017 May 30. J Environ Manage. 2017. PMID: 28575781
-
Temperature-associated increases in the global soil respiration record.Nature. 2010 Mar 25;464(7288):579-82. doi: 10.1038/nature08930. Nature. 2010. PMID: 20336143
-
Land cover change in global drylands: A review.Sci Total Environ. 2023 Mar 10;863:160943. doi: 10.1016/j.scitotenv.2022.160943. Epub 2022 Dec 14. Sci Total Environ. 2023. PMID: 36526201 Review.
-
Measurement of CO2 exchange between Boreal forest and the atmosphere.SEB Exp Biol Ser. 2005:151-85. SEB Exp Biol Ser. 2005. PMID: 17633035 Review.
Cited by
-
Carbon Materials Advancing Microorganisms in Driving Soil Organic Carbon Regulation.Research (Wash D C). 2022 Jan 12;2022:9857374. doi: 10.34133/2022/9857374. eCollection 2022. Research (Wash D C). 2022. PMID: 35098139 Free PMC article. Review.
-
Nitrogen addition promotes soil carbon accumulation globally.Sci China Life Sci. 2025 Jan;68(1):284-293. doi: 10.1007/s11427-024-2752-2. Epub 2024 Oct 25. Sci China Life Sci. 2025. PMID: 39465462
-
Fertilization treatments affect soil CO2 emission through regulating soil bacterial community composition in the semiarid Loess Plateau.Sci Rep. 2022 Nov 22;12(1):20123. doi: 10.1038/s41598-022-21108-4. Sci Rep. 2022. PMID: 36418374 Free PMC article.
-
Spatial and Temporal Pattern of Net Ecosystem Productivity in China and Its Response to Climate Change in the Past 40 Years.Int J Environ Res Public Health. 2022 Dec 21;20(1):92. doi: 10.3390/ijerph20010092. Int J Environ Res Public Health. 2022. PMID: 36612413 Free PMC article.
-
Variability of ecosystem carbon source from microbial respiration is controlled by rainfall dynamics.Proc Natl Acad Sci U S A. 2021 Dec 28;118(52):e2115283118. doi: 10.1073/pnas.2115283118. Proc Natl Acad Sci U S A. 2021. PMID: 34930848 Free PMC article.
References
-
- Friedlingstein P., Jones M. W., O’Sullivan M., Andrew R. M., Hauck J., Peters G. P., Peters W., Pongratz J., Sitch S., Le Quéré C., Bakker D. C. E., Canadell J. G., Ciais P., Jackson R. B., Anthoni P., Barbero L., Bastos A., Bastrikov V., Becker M., Bopp L., Buitenhuis E., Chandra N., Chevallier F., Chini L. P., Currie K. I., Feely R. A., Gehlen M., Gilfillan D., Gkritzalis T., Goll D. S., Gruber N., Gutekunst S., Harris I., Haverd V., Houghton R. A., Hurtt G., Ilyina T., Jain A. K., Joetzjer E., Kaplan J. O., Kato E., Klein Goldewijk K., Korsbakken J. I., Landschützer P., Lauvset S. K., Lefèvre N., Lenton A., Lienert S., Lombardozzi D., Marland G., McGuire P. C., Melton J. R., Metzl N., Munro D. R., Nabel J. E. M. S., Nakaoka S., Neill C., Omar A. M., Ono T., Peregon A., Pierrot D., Poulter B., Rehder G., Resplandy L., Robertson E., Rödenbeck C., Séférian R., Schwinger J., Smith N., Tans P. P., Tian H., Tilbrook B., Tubiello F. N., van der Werf G. R., Wiltshire A. J., Zaehle S., Global carbon budget 2019. Earth Syst. Sci. Data 11, 1783–1838 (2019).
-
- Warner D. L., Bond-Lamberty B., Jian J., Stell E., Vargas R., Spatial predictions and associated uncertainty of annual soil respiration at the global scale. Glob. Biogeochem. Cycles 33, 1733–1745 (2019).
-
- Tang X., Fan S., Du M., Zhang W., Gao S., Liu S., Chen G., Yu Z., Yang W., Spatial-and temporal-patterns of global soil heterotrophic respiration in terrestrial ecosystems. Earth Syst. Sci. Data 12, 1037–1051 (2020).
-
- Bond-Lamberty B., New techniques and data for understanding the global soil respiration flux. Earth Future 6, 1176–1180 (2018).
-
- Anav A., Friedlingstein P., Beer C., Ciais P., Harper A., Jones C., Murray-Tortarolo G., Papale D., Parazoo N. C., Peylin P., Piao S., Sitch S., Viovy N., Wiltshire A., Zhao M., Spatiotemporal patterns of terrestrial gross primary production: A review. Rev. Geophys. 53, 785–818 (2015).
Publication types
LinkOut - more resources
Full Text Sources
Other Literature Sources
